

Three mega-cap U.S. banking and brokerage giants appear to have the strongest setup from a technical perspective. I do not follow the banks closely, but thought it would be useful to put out a quick article with some charts for those looking to acquire shares in the banking sector. Without doubt, large operating losses are coming from defaulted loans of all types in the coronavirus recession. However, the banking sector was well capitalized going into the situation, holding about twice the ratio of equity vs. total loans than before the life-altering Great Recession of 2007-09. The Federal Reserve and even the Treasury are promising help for the banking sector to absorb and paper over losses, with new money printing and emergency loans.
Granted, I have no crystal ball to predict if the March bottoms in price will hold. A second sell wave on Wall Street may have begun this week, discussed in my Seeking Alpha article posted on Monday. Whether the banking group has bottomed already or continues lower, I expect the three in this article to survive and perform better than the industry average over the next 6-12 months. At least that’s what the technical trading picture in each stock is suggesting.
For starters, The Goldman Sachs Group (GS), Bank of America Corporation (BAC), and JPMorgan Chase & Co. (JPM) have performed far better than the peer sector SPDR S&P Bank ETF (KBE). You can review the comparative charts below, their outperformance of the banking index, alongside S&P 500 changes over the last three-month and one-year periods.
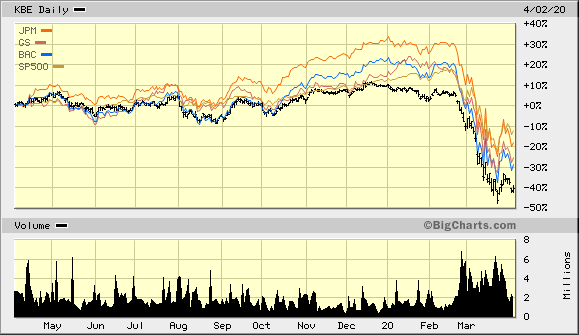
Perhaps not coincidentally, all three banks are members of the largest, most diverse operation, the Wall Street banking club. Warren Buffett owns all three today and had given each his seal of approval for business management and balance sheet safety, before the coronavirus pandemic showed up.
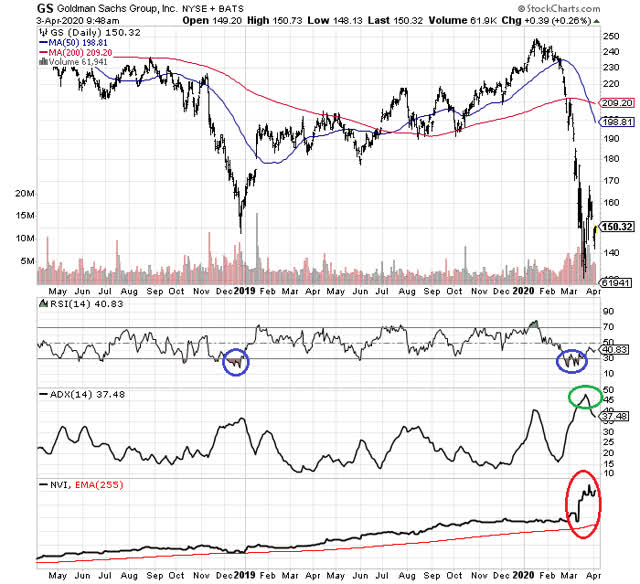
Goldman Sachs
Goldman paid a “trailing” dividend yield of 3.3% at today’s $150.32 stock quote. While the future of dividend payouts at the big banks is questionable going forward, similar to any large U.S. corporation in April 2020, I like to use it as a yardstick for valuation. Price to “trailing” earnings stands at a 7x ratio, price to sales near 1.6x, and price to book value at 0.6x. Under normal circumstances, I would categorize the company as having exceptional value against the S&P 500 equivalent ratios of 19x earnings, 1.7x sales and 3x book value, with a 2.4% dividend yield.
The two-year chart below highlights the 2020 sell-off picture with some of my favorite oversold indicators, plus a record of buying trends on low volume days. The 14-day Relative Strength Index (RSI) reached its lowest number since December 2018, circled in blue. The 14-day Average Directional Index (ADX) jumped to almost 48, circled in green. On a sell-off, this trend indicator has not been as stretched since 2015. The $130 bottom in March approached a five-year low price from 2016. The most interesting and positive note on the Goldman chart is the action of the Negative Volume Index (NVI). The strong upmove, circled in red, signals a tremendous amount of buying “after” the largest sell-off days for volume. Plenty of buying on dips has been occurring. Actually, the opposite has been taking place in the vast majority of bank stocks in March, namely net selling has continued on lower volume days.
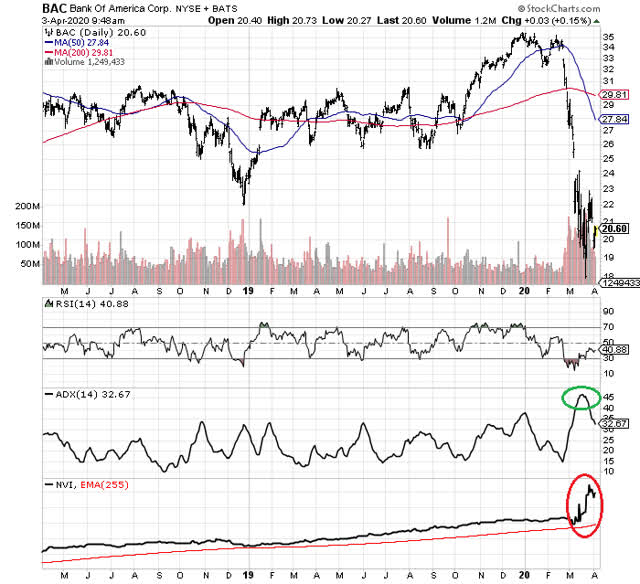
 Bank of America
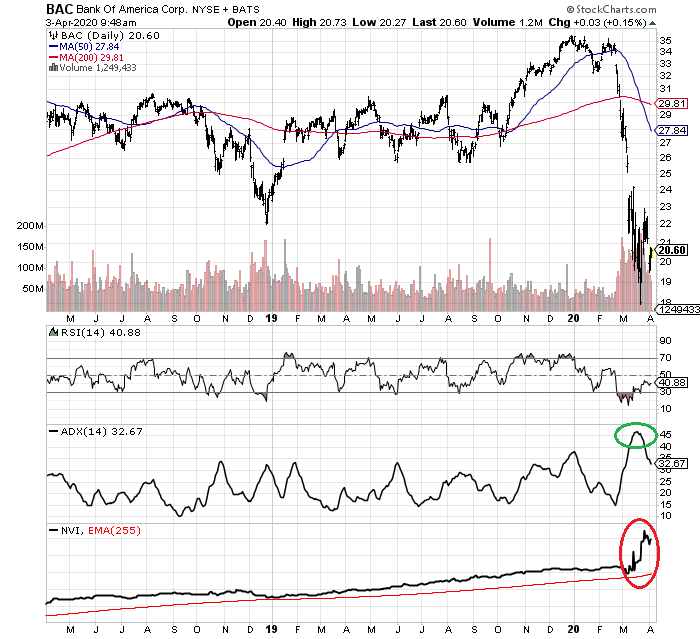
Bank of America paid a trailing dividend yield of 3.5% at today’s $20.60 stock quote. Price to trailing earnings is at a 7x ratio, price to sales at 1.9x, and price to book value at 0.7x. The company’s basic financial metric valuation is not much different than Goldman Sachs’.
The below chart highlights the 2020 sell-off. The 14-day RSI reached for an ultra-low 12 number at $18 a share several weeks ago. In a similar fashion to Goldman, the 14-day ADX outlined an extreme 46 sell-off reading for intermediate trend intensity, circled in green. The ADX number on a sell-off was the highest since the autumn of 2011, in part from the Treasury debt credit downgrade by Standard & Poor’s. Again, the NVI indicator of buying/selling on lower volume days has ramped up sharply. This signals considerable “buying on dip” interest from investors of all stripes.
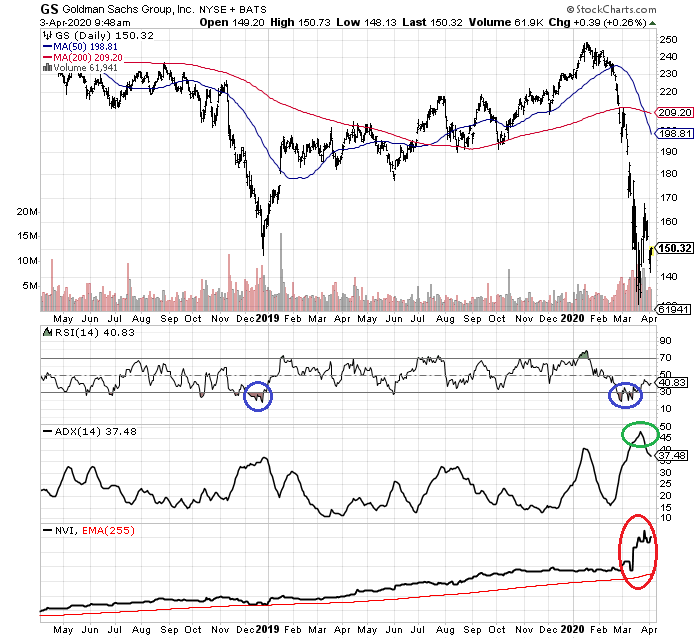
 JPMorgan
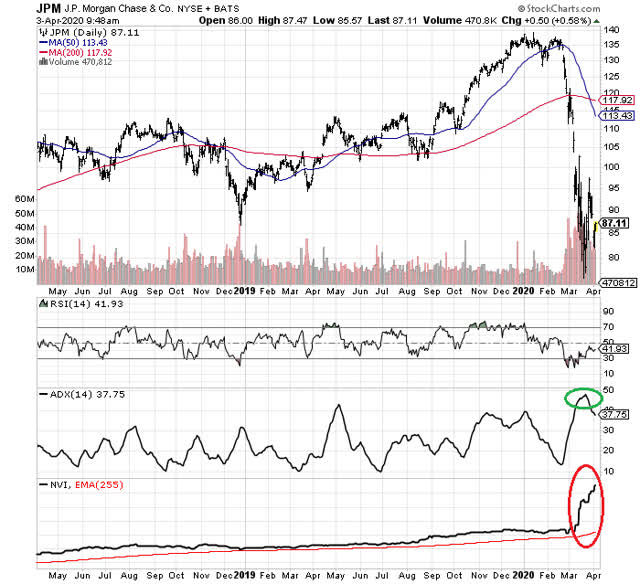
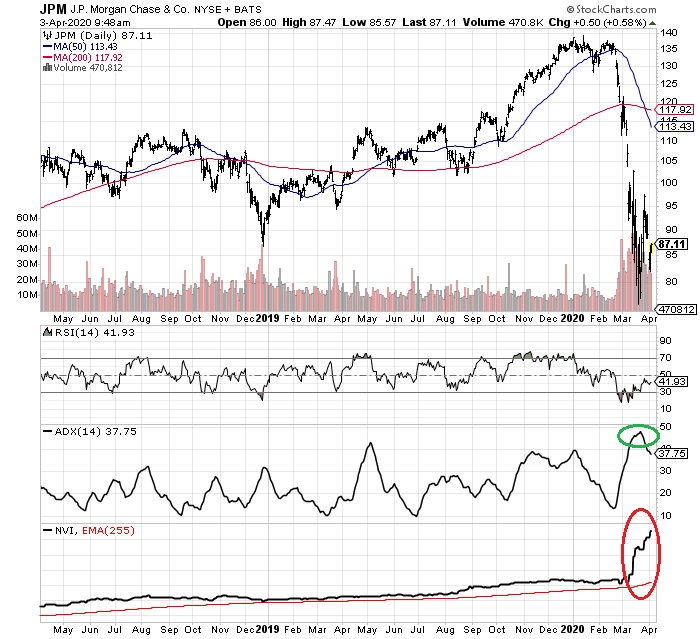
JPMorgan Chase paid a trailing dividend yield of 4.1% at today’s $87.11 stock quote. Price to trailing earnings stands at an 8x ratio, price to sales at 2.3x, and price to book value at 1.0x. JPMorgan’s basic fundamental valuation is again similar to Goldman’s and Bank of America’s.
The stock quote has been hit hard in 2020, but is the strongest performer of the three since early 2018. Pictured below, the RSI outlined a multi-year low oversold condition, the smallest number since 2012. The ADX line made it to 48, circled in green, before reversing lower in late March. It was the highest ADX number on a sell-off since the 2001 recession. Plus, the NVI indicator has exploded to the upside on buying interest during lower volume days, circled in red.
 Summary
Overall, the fundamental and technical picture is much brighter for the three in this article vs. the average bank stock. Does the technical picture guarantee sizable upside is next? Absolutely not, but I expect them as a group to “outperform” other bank equities the rest of 2020.
Historically, on average, money center banks survive better than smaller institutions during major economic stress events. Will the coronavirus shutdown shock prove any different? Warren Buffett chose to make big investments in the money center banks during past recessions. Should smart investors be considering such for portfolios today?
If you are looking for blue-chip bank and financial business exposure in your portfolio, I think Goldman Sachs, Bank of America and JPMorgan Chase are a great starting point for extra research. Thanks for reading.
Want to read more? Click the “Follow” button at the top of this article to receive future author posts.
Disclosure: I/we have no positions in any stocks mentioned, but may initiate a long position in GS, BAC, JPM over the next 72 hours. I wrote this article myself, and it expresses my own opinions. I am not receiving compensation for it (other than from Seeking Alpha). I have no business relationship with any company whose stock is mentioned in this article.
Additional disclosure: This writing is for informational purposes only. All opinions expressed herein are not investment recommendations, and are not meant to be relied upon in investment decisions. The author is not acting in an investment advisor capacity and is not a registered investment advisor. The author recommends investors consult a qualified investment advisor before making any trade. This article is not an investment research report, but an opinion written at a point in time. The author’s opinions expressed herein address only a small cross-section of data related to an investment in securities mentioned. Any analysis presented is based on incomplete information, and is limited in scope and accuracy. The information and data in this article are obtained from sources believed to be reliable, but their accuracy and completeness are not guaranteed. Any and all opinions, estimates, and conclusions are based on the author’s best judgment at the time of publication, and are subject to change without notice. Past performance is no guarantee of future returns.
Be the first to comment