

Richard Drury/DigitalVision via Getty Images
The Blackstone Long-Short Credit Income Fund (NYSE:BGX) is a high yielding closed‐end fund (“CEF”) that invests in high yielding secured loans and junk bonds.
After analyzing the fund’s performance, my conclusion is that the BGX fund is yet another example of a CEF that pays more than it earns. This leads to a shrinking NAV / shrinking distribution spiral. It is also notable that while BGX is marketed as a long-short credit fund, it had no short positions in one of the worst bear markets in history. Investors are advised to stay away.
Fund Overview
The Blackstone Long Short Credit Income Fund is a closed‐end fund that provides current income and capital appreciation. The BGX fund has over $150 million in net assets and $260 million in managed assets.
Strategy
The BGX fund’s strategy is to use a dynamic long-short strategy in a diversified portfolio of loans and fixed-income instruments to generate income and capital gains. The majority of the fund’s assets are invested in non-investment grade loans and fixed-income instruments, i.e. those rated lower than BB+ by S&P and Fitch or Ba1 by Moody’s. The fund can also invest in unrated instruments provided the manager deems them suitable.
The BGX fund takes long positions in investments the manager believes will offer attractive returns and short positions in investments that the manager believes will underperform. The fund’s short positions may total up to 30% of net assets.
Portfolio Holdings
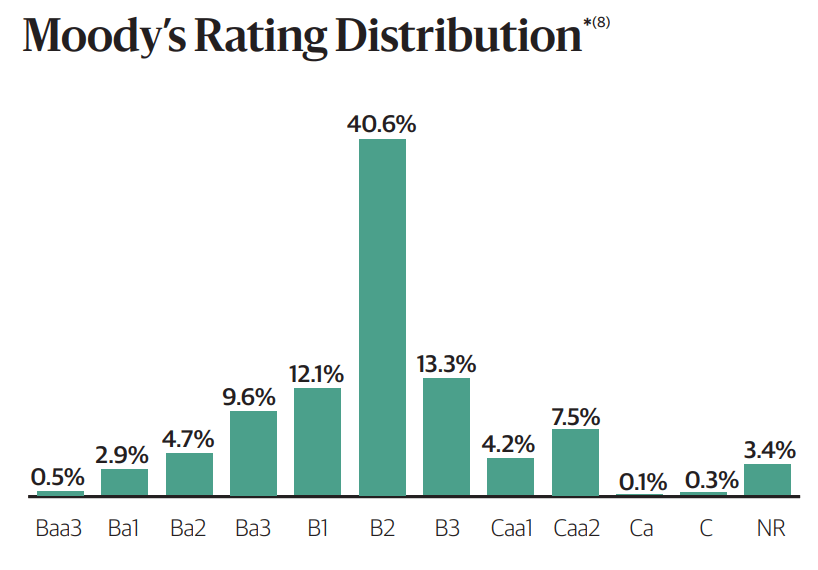
As of September 30, 2022, the fund’s asset allocation and credit quality allocation are shown in figures 1 and 2. As discussed above, we can see the fund is primarily invested in secured loans and high yield bonds, totaling 94% of assets. 81% of the fund’s investments are floating rate, and 97% of the investments are below investment grade. The fund also has close to 40% leverage.
Figure 1 – BGX asset allocation (BGX September 2022 fact sheet) Figure 2 – BGX credit quality distribution (BGX September 2022 fact sheet)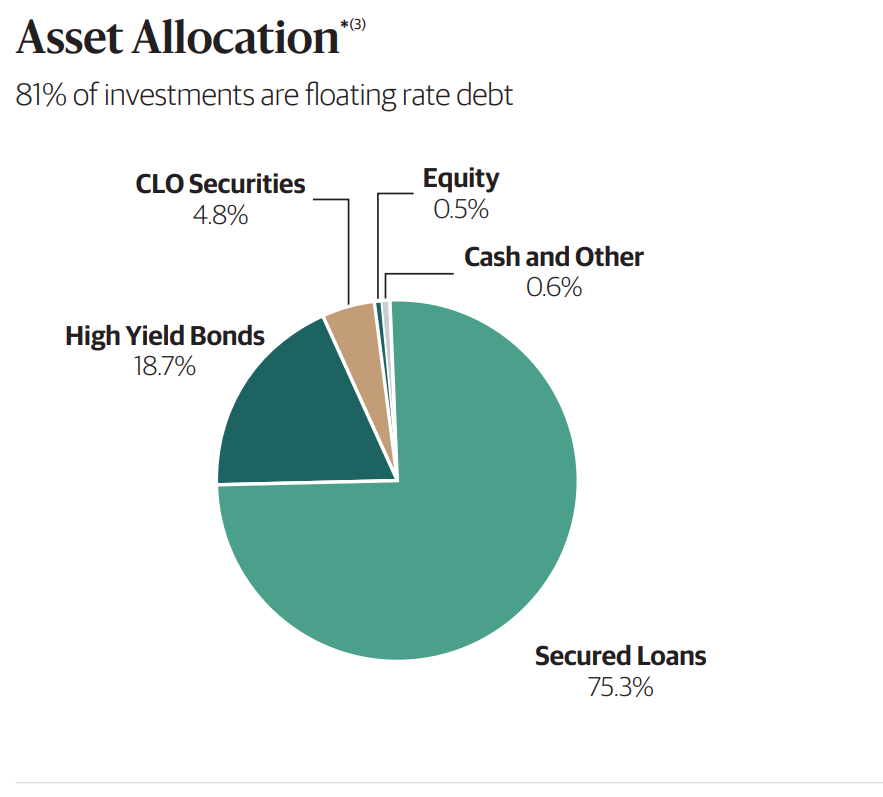
Interestingly, the fund had no short positions despite one of the worst bond bear markets in history (Figure 3). In fact, going through the fund’s December 31, 2021 Annual report, March 31, 2022 Q1/2022 portfolio report, and the June 30, 2022 Semi-annual report, we could not see any indication that the fund engages in short selling.
Figure 3 – BGX fund snapshot (BGX September 2022 fact sheet)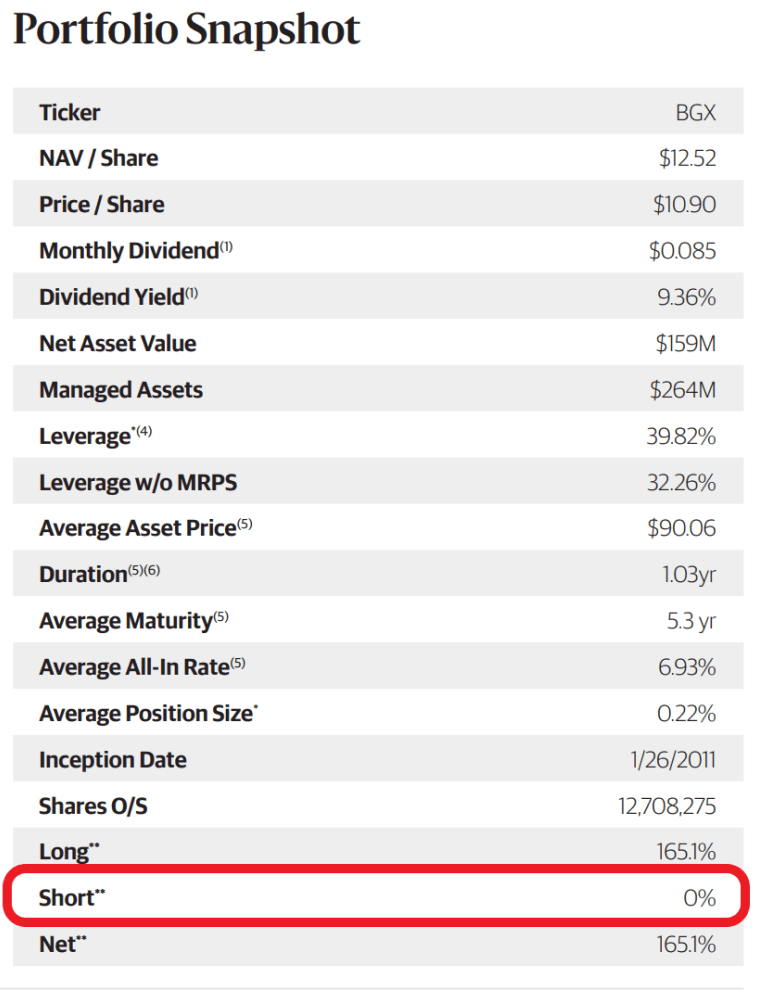
Returns
The BGX fund’s returns have been mediocre, with 1/3/5/10 Yr annualized returns of -17.9%/-1.3%/2.2%/3.3% respectively to November 30, 2022 (Figure 4).
Figure 4 – BGX returns (morningstar.com)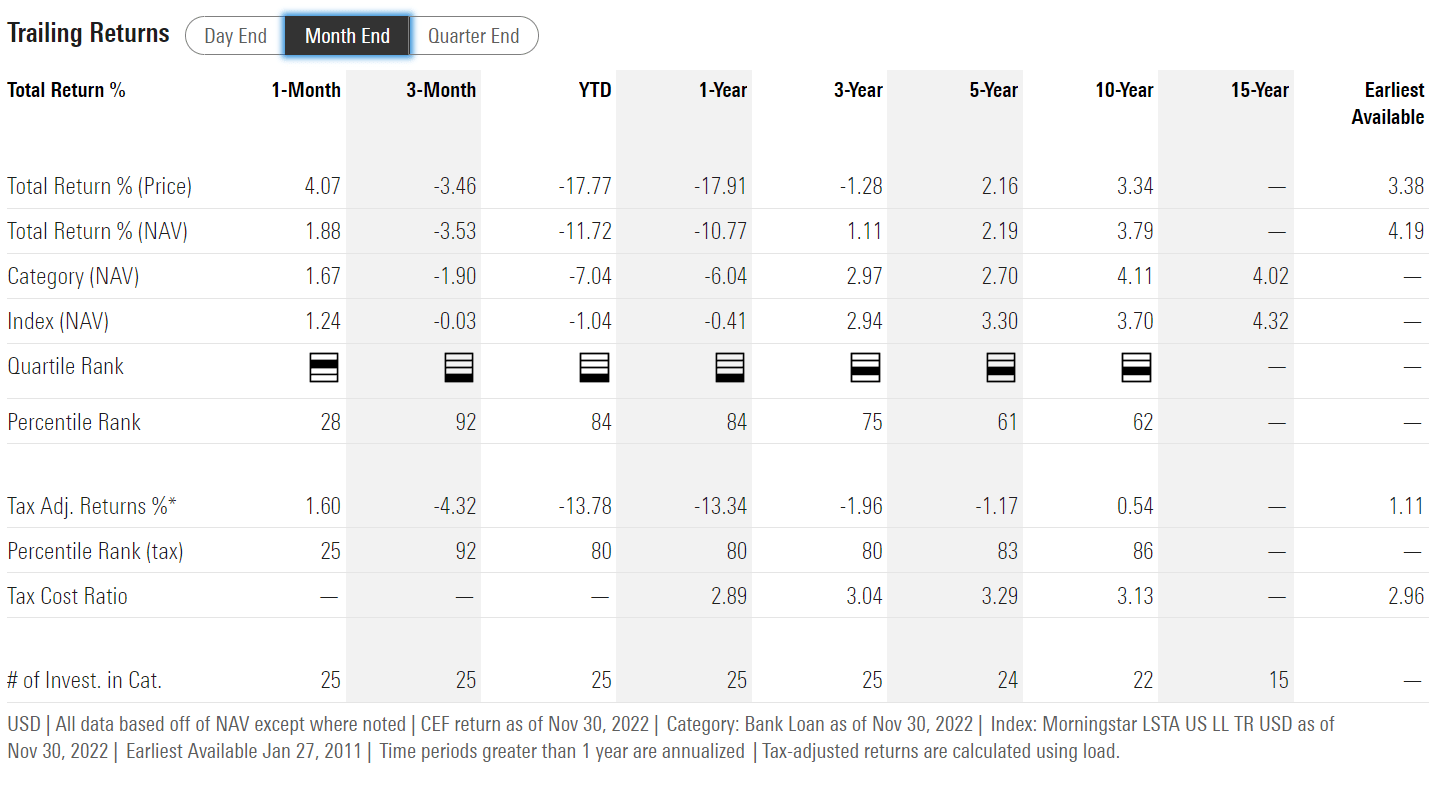
2022 has been an especially poor year for the BGX fund, with a -11.7% YTD return to November 30, 2022, erasing the prior two years of modest gains (Figure 5).
Figure 5 – BGX annual returns (morningstar.com)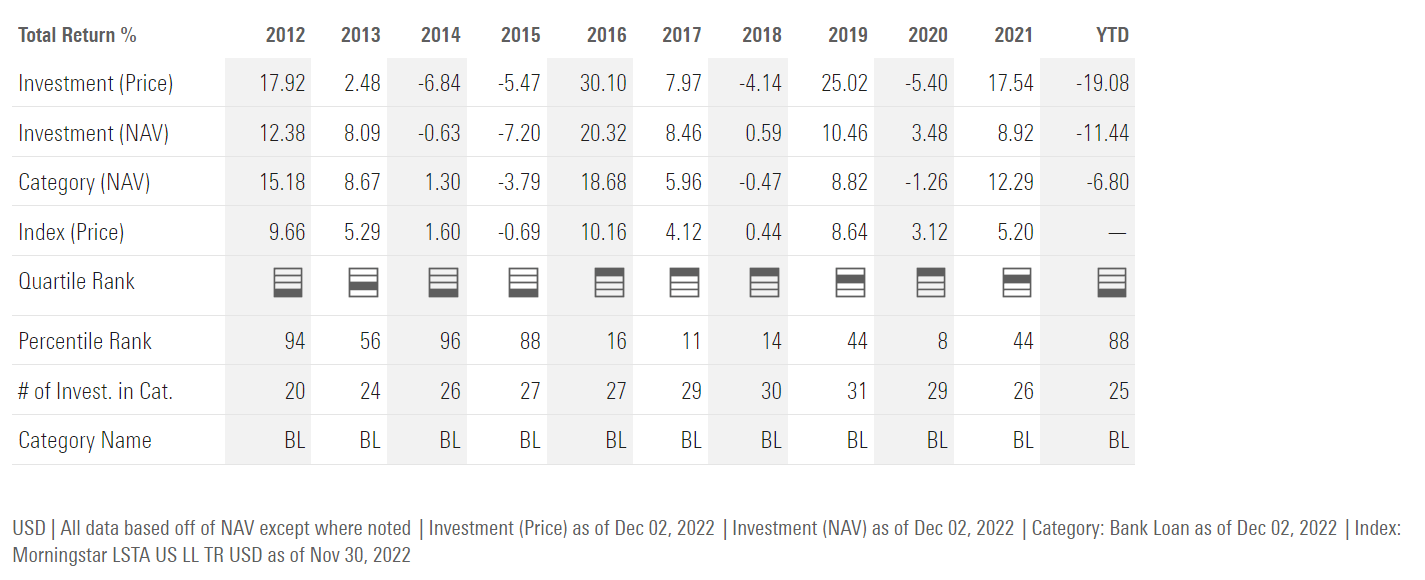
Distribution & Yield
The BGX fund pays a high distribution of $0.085 / month, which annualizes to 9.2% on market price. The fund’s distribution is determined on a quarterly basis and has been rising in the past few quarters, as the distribution was only $0.073 / month in Q1/2022 (Figure 6).
Figure 6 – BGX monthly distributions (Seeking Alpha)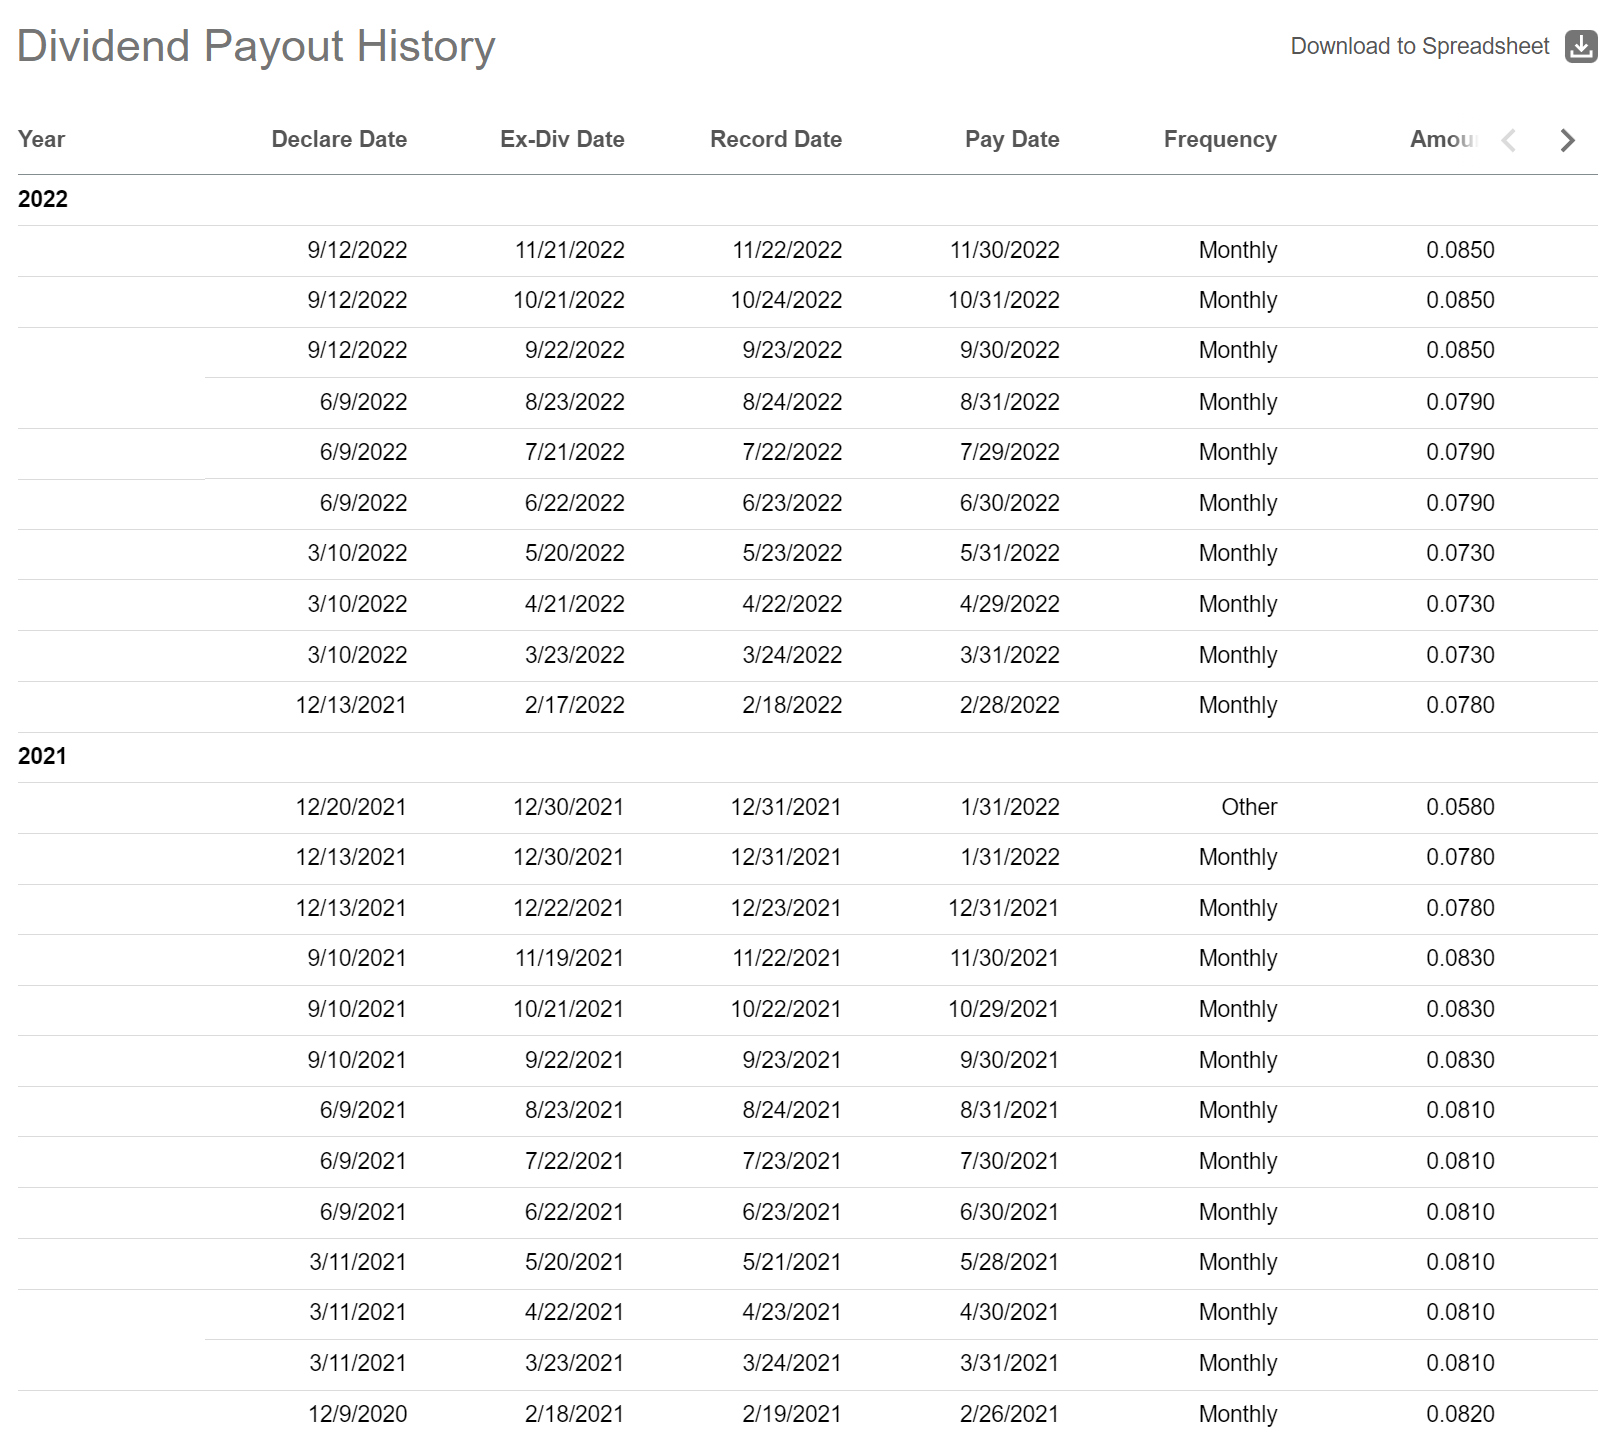
However, investors are cautioned that the BGX fund does not appear to earn sufficient income and capital gains to support its distribution. For example, if we look at the past 5 fiscal years, the BGX fund earned a total of $4.81 / share in income and gains, however it paid $6.53 in distributions (Figure 7).
Figure 7 – BGX financial highlights (BGX 2021 Annual Report)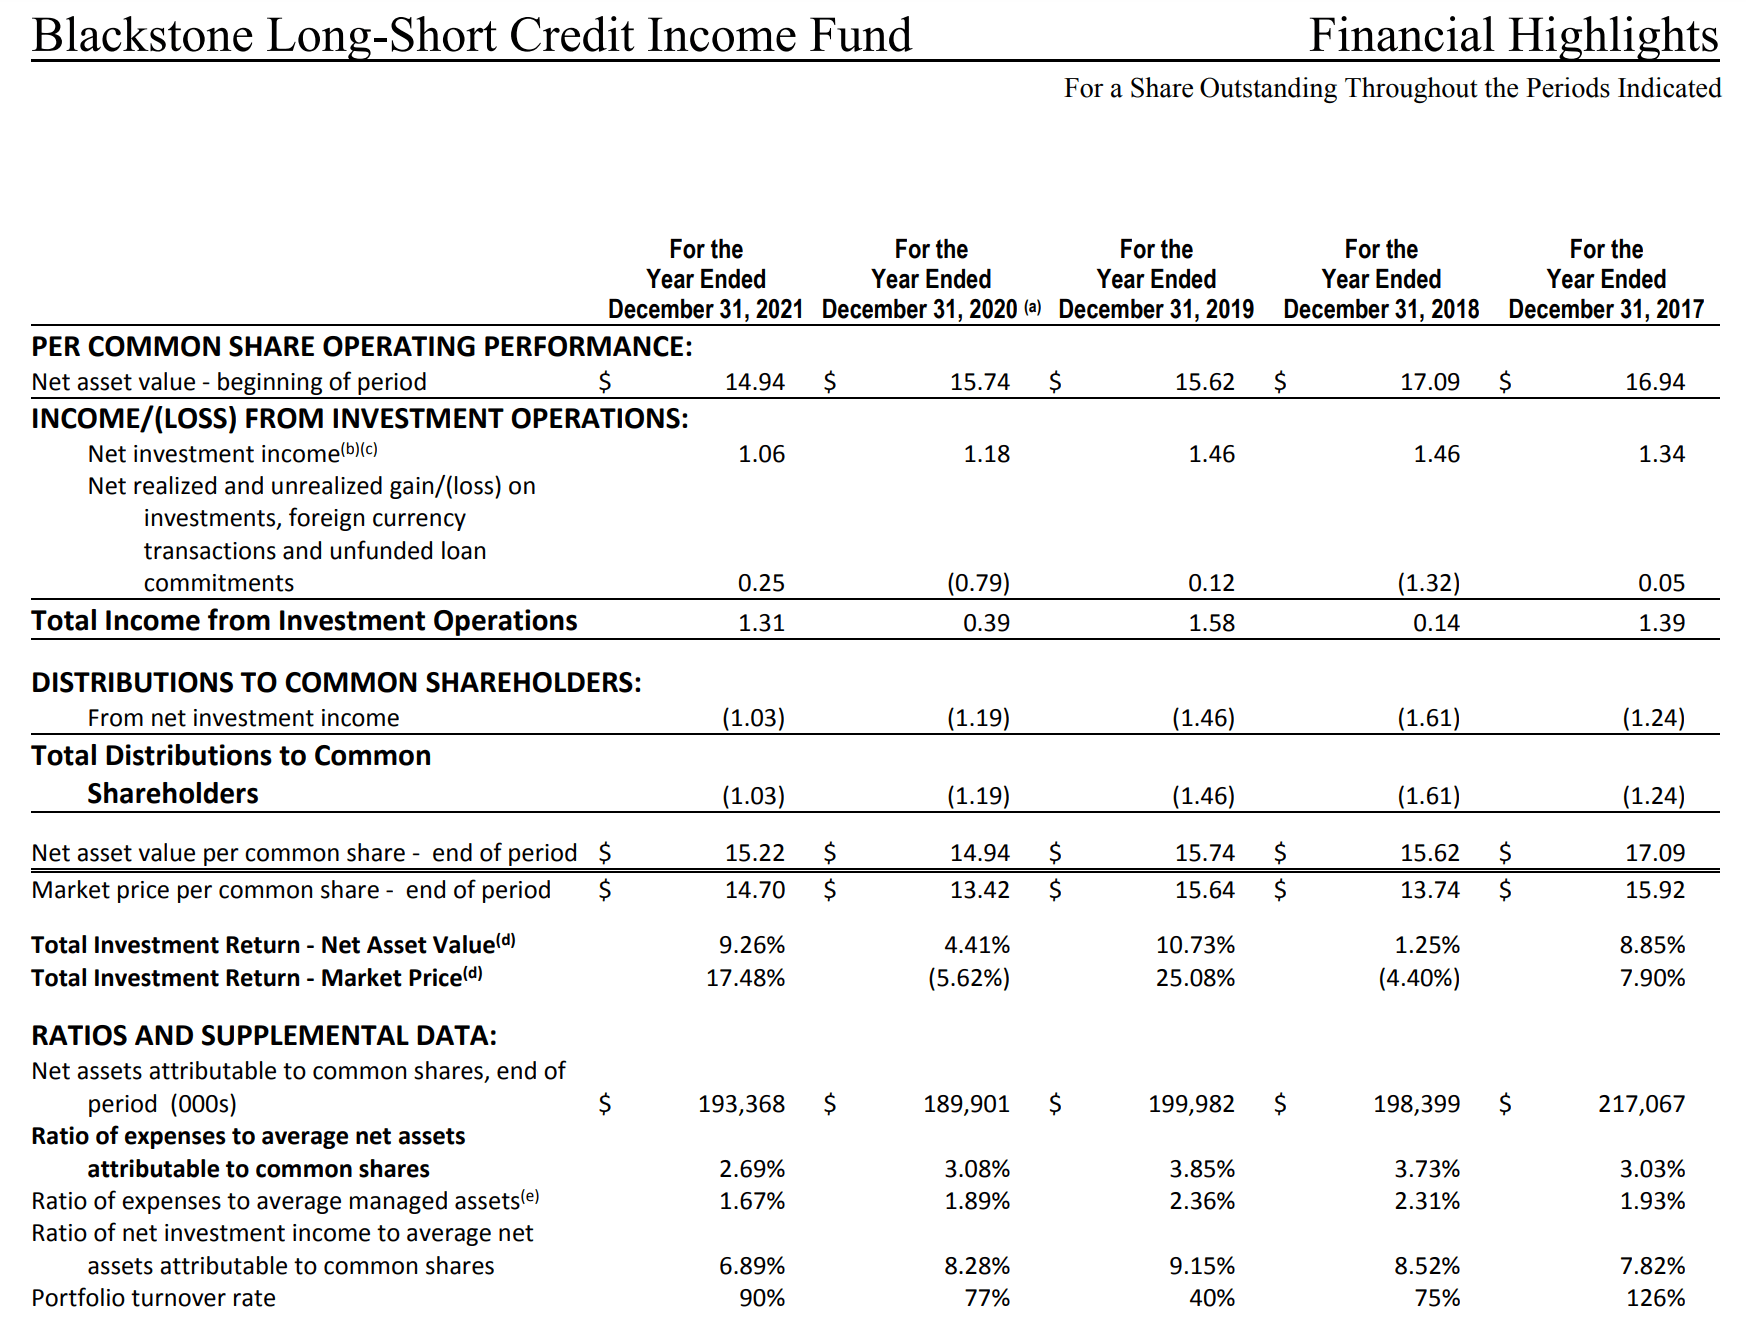
Fees
The BGX fund charges a 2.77% total expense ratio, which is on the high side. This expense consists of 1.2% management fee, 1.04% expense from leverage (preferred shares and debt) and 0.53% from other expenses (Figure 8).
Figure 8 – BGX charges a high fee (BGX prospectus)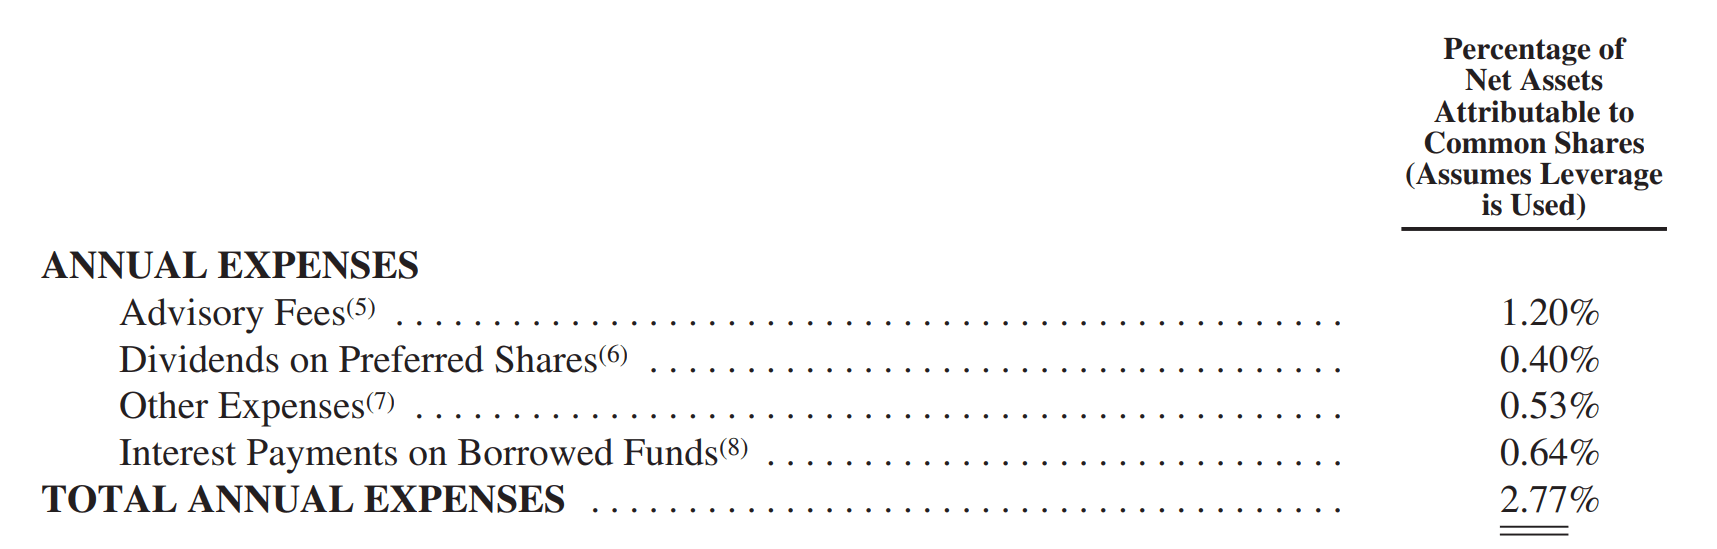
Yet Another Shrinking NAV Fund
BGX is yet another example of CEFs that pay a distribution yield beyond what it earns on average. From 2012 to 2021 (excluding the abnormally bad 2022), BGX has earned an average annual total return of 6.5% of NAV (calculated from figure 5 above). However, it has paid an average distribution yield of 13.7% (Figure 9).
Figure 9 – BGX historical distributions (Seeking Alpha)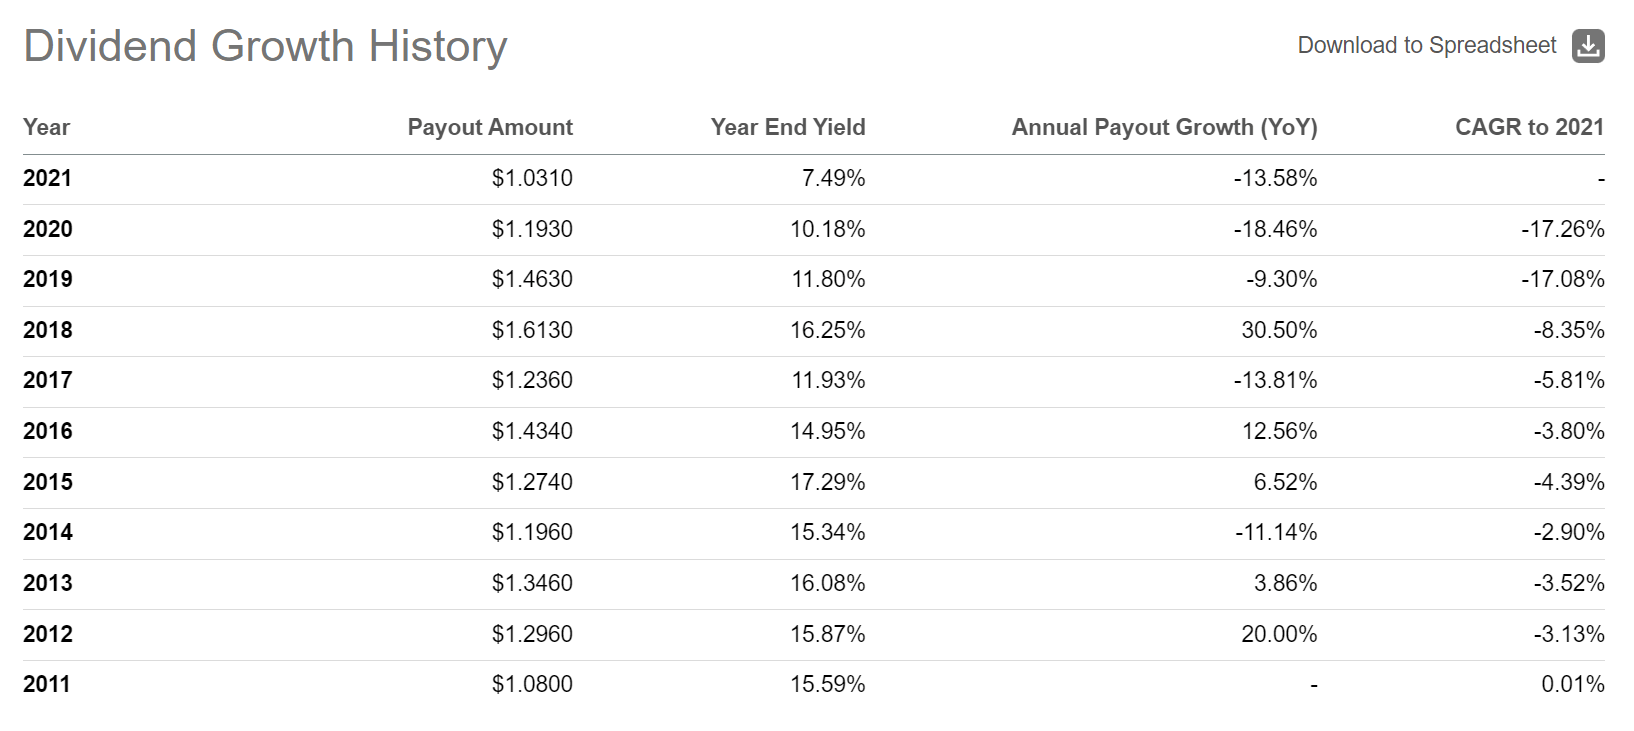
While the average annual shortfall is manageable, over time, the NAV shrinks and may be insufficient to generate income to support future distributions. This leads to a shrinking NAV / shrinking distribution spiral. For example, BGX’s NAV has declined from over $19 in 2011 to ~$11 today, and the distribution has shrunk from $1.296 / share in 2012 to $0.95 / share in the past year (Figure 10).
Figure 10 – BGX NAV has shrunk over time (cefconnect.com)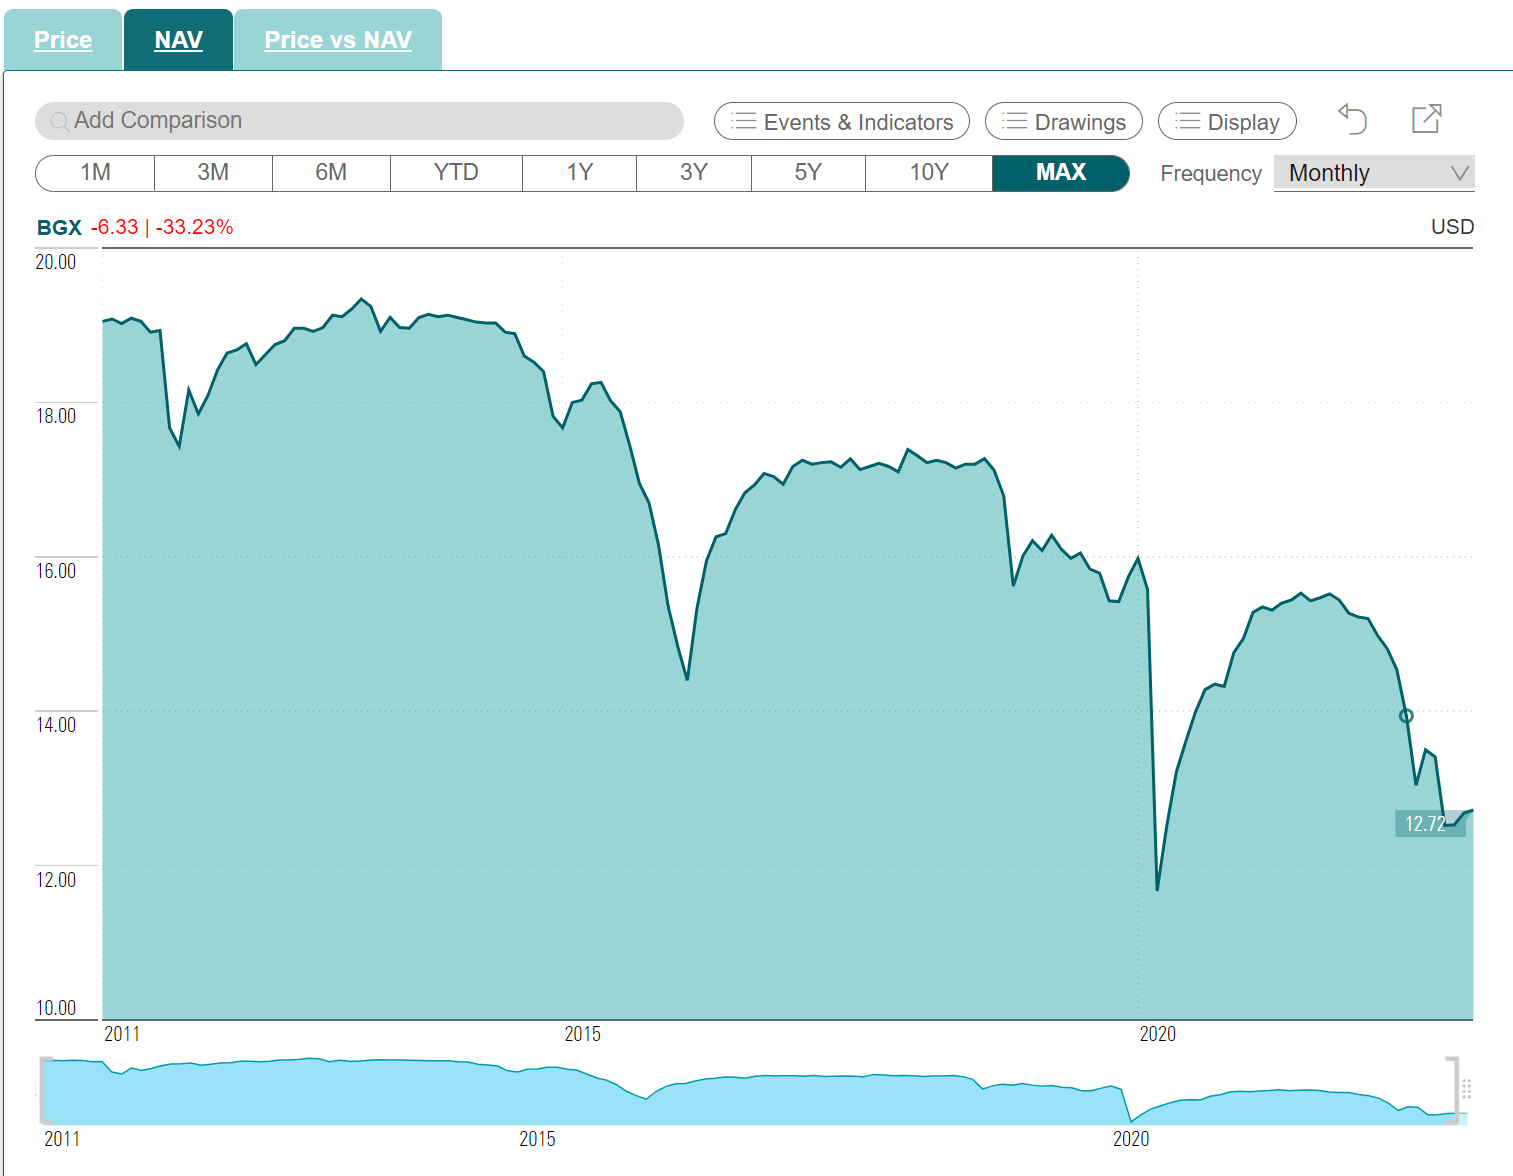
Conclusion
Once again, we come across another example of a CEF that entices investors with a high distribution yield, but does not earn sufficient levels of income to support the distribution. This shortfall causes BGX’s NAV to shrink over time, leading to a decline in the distribution as well. It is also notable that while BGX is marketed as a long-short fund, it did not hold any short positions in one of the worst bond bear market in history.
Be the first to comment