


gguy44/iStock via Getty Images
Earnings of Berkshire Hills Bancorp, Inc. (NYSE:BHLB) will most probably recover in 2023 on the back of moderate loan growth. Further, the margin will continue to expand this year, albeit at a slower pace than in 2022. Overall, I’m expecting the company to report earnings of $2.40 per share for 2023, up 16% from my estimated earnings of $2.06 per share for 2022. The December 2023 target price suggests a moderate upside from the current market price. As a result, I’m adopting a hold rating on Berkshire Hills Bancorp.
Commercial Loan Growth Outlook Remains Bright
Berkshire Hills Bancorp’s loan growth slowed down to 1.9% in the third quarter from 7.5% in the second quarter and 6.7% in the first quarter of 2022. Loan growth was unusually high in the first half of the year and the growth for the third quarter is closer to the historical growth trend.
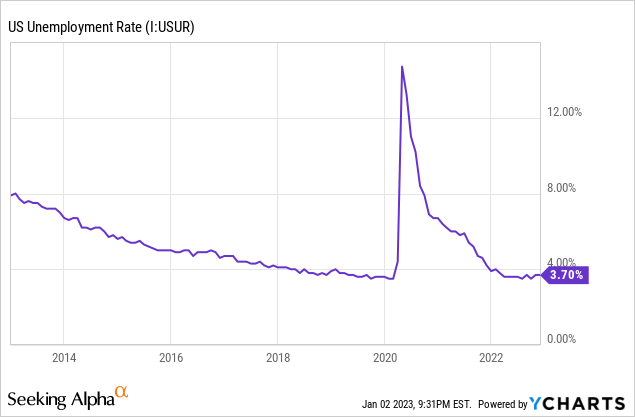
The management was optimistic about near-term loan growth at the time of the conference call. The commercial loan pipeline got built up by the end of the third quarter; therefore, the management expected stronger growth in this segment in the fourth quarter compared to the third quarter. Further, strong job markets can support commercial loan growth. Berkshire Hills operates in the diverse states of New England plus New York. As a result, the national average unemployment rate is a good proxy for labor market conditions in the company’s operating regions. As shown below, the unemployment rate has been consistently low throughout 2022.
On the other hand, the outlook for residential loans isn’t bright. Borrowing for home purchases is heavily dependent on borrowing costs as many home buyers are not time constrained and they can wait for better times. Therefore, the current high interest-rate environment is bound to keep the growth of residential loans subdued this year. Residential mortgages are an important focus area for Berkshire Hills as they made up 27% of total loans at the end of September 2022.
Considering these factors, I’m expecting the loan portfolio to have grown by 1.5% in the fourth quarter of 2022, taking full-year loan growth to 18.5%. For 2023, I’m expecting loans to grow by 6.1%. Meanwhile, I’m expecting deposits to grow mostly in line with loans. The following table shows my balance sheet estimates.
| Financial Position | FY18 | FY19 | FY20 | FY21 | FY22E | FY22E |
| Net Loans | 8,982 | 9,439 | 7,954 | 6,720 | 7,965 | 8,454 |
| Growth of Net Loans | 8.9% | 5.1% | (15.7)% | (15.5)% | 18.5% | 6.1% |
| Other Earning Assets | 2,003 | 2,281 | 3,708 | 4,073 | 2,667 | 2,694 |
| Deposits | 8,982 | 10,336 | 10,216 | 10,069 | 10,138 | 10,760 |
| Borrowings and Sub-Debt | 1,518 | 828 | 572 | 111 | 126 | 127 |
| Common equity | 1,512 | 1,718 | 1,188 | 1,182 | 965 | 1,041 |
| Book Value Per Share ($) | 32.7 | 34.8 | 23.6 | 23.9 | 21.4 | 23.1 |
| Tangible BVPS ($) | 20.8 | 22.6 | 22.9 | 23.3 | 20.9 | 22.5 |
| Source: SEC Filings, Author’s Estimates(In USD million unless otherwise specified) | ||||||
Margin Expansion Likely to Decelerate
Berkshire Hills Bancorp’s net interest margin surged by 37 basis points in the third quarter following a growth of 50 basis points in the second quarter of this year. The expansion was largely attributable to sticky deposit costs. According to details given in the 10-Q filing, the average deposit cost during the third quarter of 2022 was 0.33%, which barely changed from 0.22% in the third quarter of 2021. During the same time frame, the fed funds rate rose by a massive 300 basis points.
The low deposit beta (meaning rate-sensitivity) cannot be maintained for long as depositors will start shifting their funds to either the higher-rate certificates of deposits (“CD”) or other banks. Fortunately, Berkshire Hills operates in a market that is relatively less competitive, according to the management. Therefore, deposit retention is not a big problem. The management mentioned in the conference call that it expects the deposit beta to rise to 30% – 40%.
According to the latest results of the management’s rate-sensitivity simulation model, a 200-basis points hike in interest rate could boost the net interest income by 5.0% over the first twelve months and 9.9% in the subsequent twelve months.

3Q 2022 10-Q Filing
Considering the factors given above, I’m expecting the margin to grow by ten basis points in the last quarter of 2022 and twenty basis points in 2023.
Expecting Earnings to Grow by 16%
The anticipated loan growth and margin expansion will drive earnings this year. Meanwhile, I’m expecting the provisioning for expected loan losses to remain near the historical average. I’m expecting the net provision expense to make up 0.31% of total loans in 2023, which is near the average from 2017 – 2019.
Overall, I’m expecting Berkshire Hills Bancorp to report earnings of $2.06 per share for 2022, down 13.8% year-over-year. For 2023, I’m expecting the company to report earnings of $2.40 per share, up 16% year-over-year. The following table shows my income statement estimates.
| Income Statement | FY18 | FY19 | FY20 | FY21 | FY22E | FY23E |
| Net interest income | 356 | 365 | 317 | 291 | 337 | 404 |
| Provision for loan losses | 25 | 35 | 76 | (1) | 2 | 26 |
| Non-interest income | 74 | 84 | 66 | 143 | 70 | 66 |
| Non-interest expense | 267 | 290 | 840 | 286 | 288 | 309 |
| Net income – Common Sh. | 105 | 96 | (533) | 119 | 93 | 108 |
| EPS – Diluted ($) | 2.29 | 1.97 | -10.60 | 2.39 | 2.06 | 2.40 |
| EPS Normalized – Diluted ($) | 2.17 | 1.92 | 0.33 | 1.88 | 2.02 | 2.40 |
| Source: SEC Filings, Author’s Estimates, Historical Normalized EPS from Seeking Alpha(In USD million unless otherwise specified) | ||||||
My estimates are based on certain macroeconomic assumptions that may not come to fruition. Therefore, actual earnings can differ materially from my estimates.
Moderate Upside Justifies a Hold Rating
Berkshire Hills resumed the growth of its dividend in the last quarter of 2022 after a prolonged flat trend since the halving of its dividend in the mid of 2020. Given the earnings outlook, I don’t think the company can afford to return to its pre-pandemic level in 2023. I’m expecting the company to maintain its quarterly dividend at the current level of $0.18 per share. My earnings and dividend estimates suggest a payout ratio of 30% for 2023, which is close to the five-year average of 35%. The current quarterly dividend implies a dividend yield of 2.4%.
I’m using the historical price-to-tangible book (“P/TB”) and price-to-earnings (“P/E”) multiples to value Berkshire Hills Bancorp. The stock has traded at an average P/TB ratio of 1.23 in the past, as shown below.
| FY18 | FY19 | FY20 | FY21 | Average | |||
| T. Book Value per Share ($) | 20.8 | 22.6 | 22.9 | 23.3 | |||
| Average Market Price ($) | 38.2 | 30.2 | 15.6 | 25.0 | |||
| Historical P/TB | 1.84x | 1.33x | 0.68x | 1.08x | 1.23x | ||
| Source: Company Financials, Yahoo Finance, Author’s Estimates | |||||||
Multiplying the average P/TB multiple with the forecast tangible book value per share of $22.5 gives a target price of $27.8 for the end of 2023. This price target implies a 7.1% downside from the December 30 closing price. The following table shows the sensitivity of the target price to the P/TB ratio.
| P/TB Multiple | 1.13x | 1.18x | 1.23x | 1.28x | 1.33x |
| TBVPS – Dec 2023 ($) | 22.5 | 22.5 | 22.5 | 22.5 | 22.5 |
| Target Price ($) | 25.5 | 26.7 | 27.8 | 28.9 | 30.0 |
| Market Price ($) | 29.9 | 29.9 | 29.9 | 29.9 | 29.9 |
| Upside/(Downside) | (14.6)% | (10.8)% | (7.1)% | (3.3)% | 0.5% |
| Source: Author’s Estimates |
The stock has traded at an average P/E ratio of around 15.5x in the past, excluding the anomaly in 2020, as shown below.
| FY18 | FY19 | FY20 | FY21 | T. Average | |||
| Norm. Earnings per Share ($) | 2.17 | 1.92 | 0.33 | 1.88 | |||
| Average Market Price ($) | 38.2 | 30.2 | 15.6 | 25.0 | |||
| Historical P/E | 17.6x | 15.7x | 47.4x | 13.3x | 15.5x | ||
| Source: Company Financials, Yahoo Finance, Author’s Estimates | |||||||
Multiplying the average trimmed P/E multiple with the forecast earnings per share of $2.40 gives a target price of $37.3 for the end of 2023. This price target implies a 24.6% upside from the December 30 closing price. The following table shows the sensitivity of the target price to the P/E ratio.
| P/E Multiple | 13.5x | 14.5x | 15.5x | 16.5x | 17.5x |
| EPS 2023 ($) | 2.40 | 2.40 | 2.40 | 2.40 | 2.40 |
| Target Price ($) | 32.5 | 34.9 | 37.3 | 39.7 | 42.1 |
| Market Price ($) | 29.9 | 29.9 | 29.9 | 29.9 | 29.9 |
| Upside/(Downside) | 8.6% | 16.6% | 24.6% | 32.6% | 40.7% |
| Source: Author’s Estimates |
Equally weighting the target prices from the two valuation methods gives a combined target price of $32.5, which implies an 8.8% upside from the current market price. Adding the forward dividend yield gives a total expected return of 10.6%. Hence, I’m adopting a hold rating on Berkshire Hills Bancorp.
Be the first to comment