

Baris-Ozer
Intro
If we pull up a long-term chart of Benchmark Electronics, Inc. (NYSE:BHE), we can see that shares are most likely in the process of registering a breakout to the upside. We wrote about Benchmark in May of this year when we clearly stated our bullish bias. Shares have returned over 14% since we penned that piece and now may be on the verge of a significant move to the upside.
We state this because as we can see below on the chart, buyers have consistently stepped in when we have had similar setups in Benchmark in the past. Remember, trends in Benchmark that have happened up to now were based on human psychology, which tends not to change.
Suffice it to say, the very best times to begin to enter long positions are when the technicals and fundamentals are in alignment. The fundamentals always revolve around the same areas. Is profitability improving? How well does management look after its shareholders? Is the stock undervalued? Many times, though, trends in the above three areas may look ultra-bullish but the technicals (which is essentially the market) for whatever reason can remain disinterested for a sustained period of time. This means, that fundamentally driven value investors can many times undergo significant opportunity cost in their positions as they wait for their beaten-down plays to finally come good. Having capital tied up while we wait for our plays to come good is not how we want to play our respective stocks. On the contrary, it is all about putting capital to work and then riding a significant trend soon thereafter.
Therefore, for us, it is all about finding stocks where the fundamentals and technicals are in sync with each other which we may have in Benchmark as we see below.
History Repeating In Benchmark Electronics (Stockcharts.com)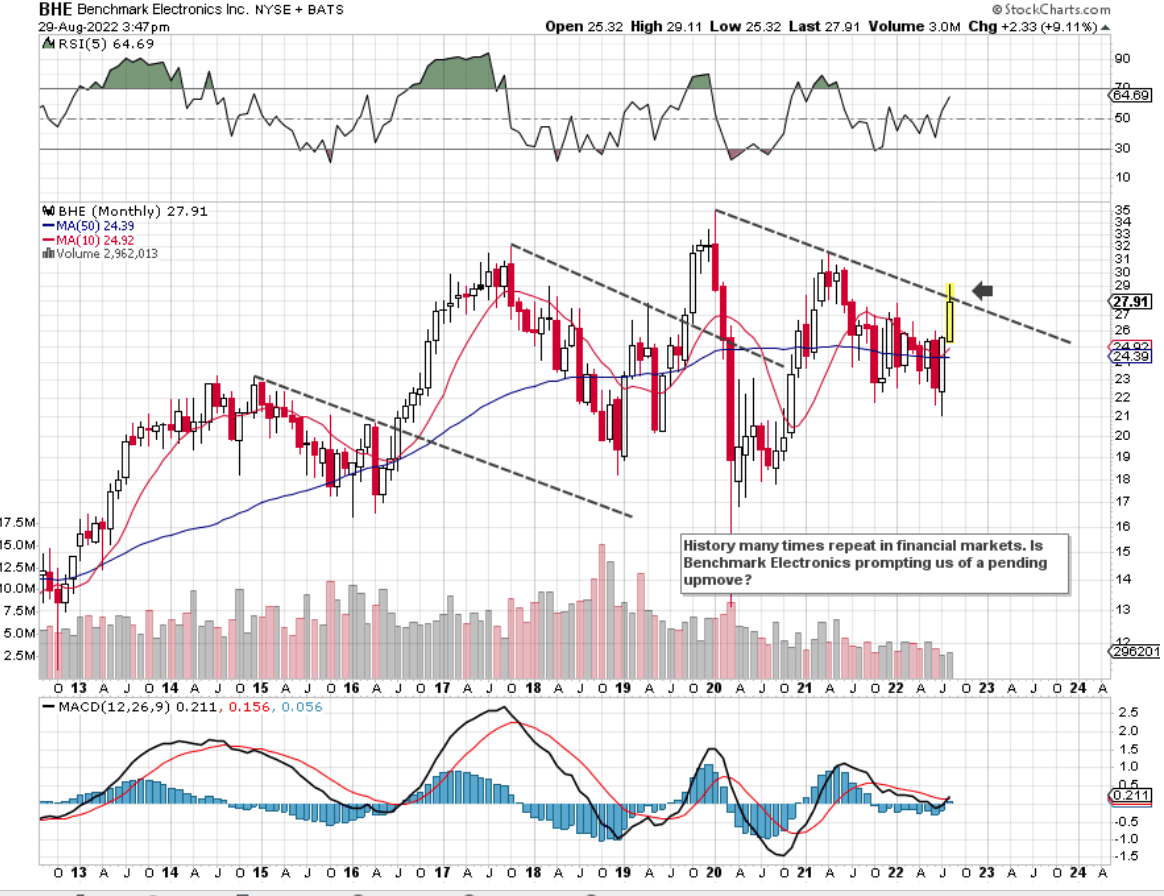
Profitability
Probably the most defining area which has been holding back Benchmark in recent times has been its probability or lack thereof to put it more succinctly. Benchmark for example at present reports a trailing 12-month operating margin of 3.17% and a trailing net income margin of 1.89% both of which trail the sector averages by quite some distance. Margin strength is particularly important in inflationary environments as higher costs can easily tilt a company into negative profitability in a very short period of time.
However, when one looks at the steep acceleration of forward-looking earnings estimates, it becomes evident that Benchmark’s profitability is destined to improve significantly in upcoming quarters. Suffice it to say, instead of looking through the rearview mirror where profitability looks dull, forward-looking numbers look very encouraging and will boost those above-mentioned margins significantly going forward in the company.
Benchmark Electronics EPS Revisions (Seekingalpha.com)
Valuation
Suffice it to say, even with earnings projections on the rise, Benchmark is working off a very low assets and sales base. Benchmark’s forward price-to-sales ratio now comes in at 0.34 and price to book ratio comes in at 1. The forward earnings yield now surpasses 6.4% which is much higher than what the sector is yielding in general (4.47%). Therefore, we would expect based on Benchmark’s profitability trends that its valuation multiples would start to trend back up towards their historic averages. This in the long run should mean only one thing. A higher share price over time.
Dividend
The dividend payout ratio is the single most important metric which demonstrates the viability of the payout. At present, the trailing GAAP earnings payout comes in well below 50% so this number should fall going forward all things remaining equal. Furthermore, Benchmark’s low debt-to-equity ratio of 0.27 in earnest protects future growth as a high-interest coverage ratio enables more of the company’s sales to drop to the bottom line.
Benchmark Electronics Short-Term Chart
As we can see below, shares of Benchmark have lost their 10-day moving average which means we need to be patient as we wait for an entry. Although what we have discussed above concerning Benchmark’s long-term chart and its associated breakout, long-term charts are not suitable for timing entries. Suffice it to say, we will remain watchful for another thrust here above resistance on strong volume on the short-term chart.
Benchmark Electronics Chart (Stockcharts.com)
Conclusion
Shares of Benchmark Electronics at present look to attempting to break out above a multi-year trend-line that dates back to January 2020. The company’s earnings expectations have increased significantly in recent months and seem to be fueling the present up move. Let’s see if we can time an attractive entry. We look forward to continued coverage.
Be the first to comment