

Joe Raedle/Getty Images News
I still remember the day back in early 2021 when my hockey teammate told me I should check out Bed Bath & Beyond (NASDAQ:BBBY) because it was the next GameStop (GME). I just dismissed him to watch it run up roughly 180% in less than a month. I never took a position that lasted more than a few hours on either side of the trade. Mostly just watched in awe as this company that sold bed stuff was flying. Fast forward to today, and the stock is down 90% from the highs, and the company appears to be in trouble. It is burning cash, piling on debt, and in a spot where it is diluting shares by trying to raise cash. I didn’t take a position in 2021, and I wouldn’t take one now. I think the end could be near for Bed Bath & Beyond.
What’s The Issue?
The main issue can be summed up with two charts. Cash Flow, and Net Debt. It’s no secret that 2022 has been a tough year for retailers due to the sharp rise in the cost of living and increased interest rates. We have seen big box retailers fall, and a lot of this is thanks to the rise in E-commerce over the last couple of years. I think this was inevitable but boosted by COVID where we saw multiple closures of stores for various periods depending on where you lived.
To remain competitive, Bed Bath & Beyond has been forced to cut margins to try and maintain business. This works if you see an uptick in volume, but without that, it can mean it’s the beginning of the end. Looking below we can get an idea of what’s been happening.
YCharts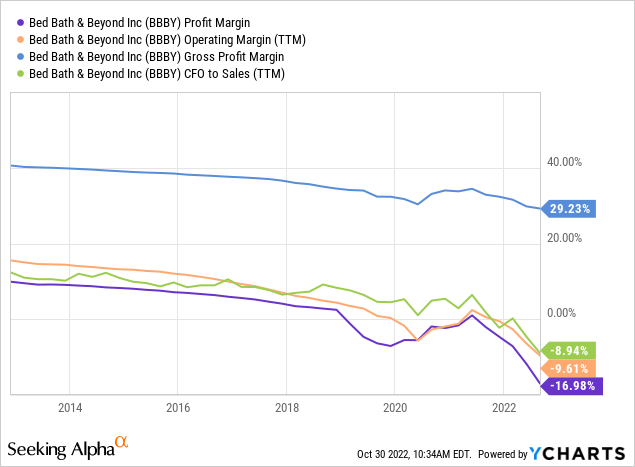
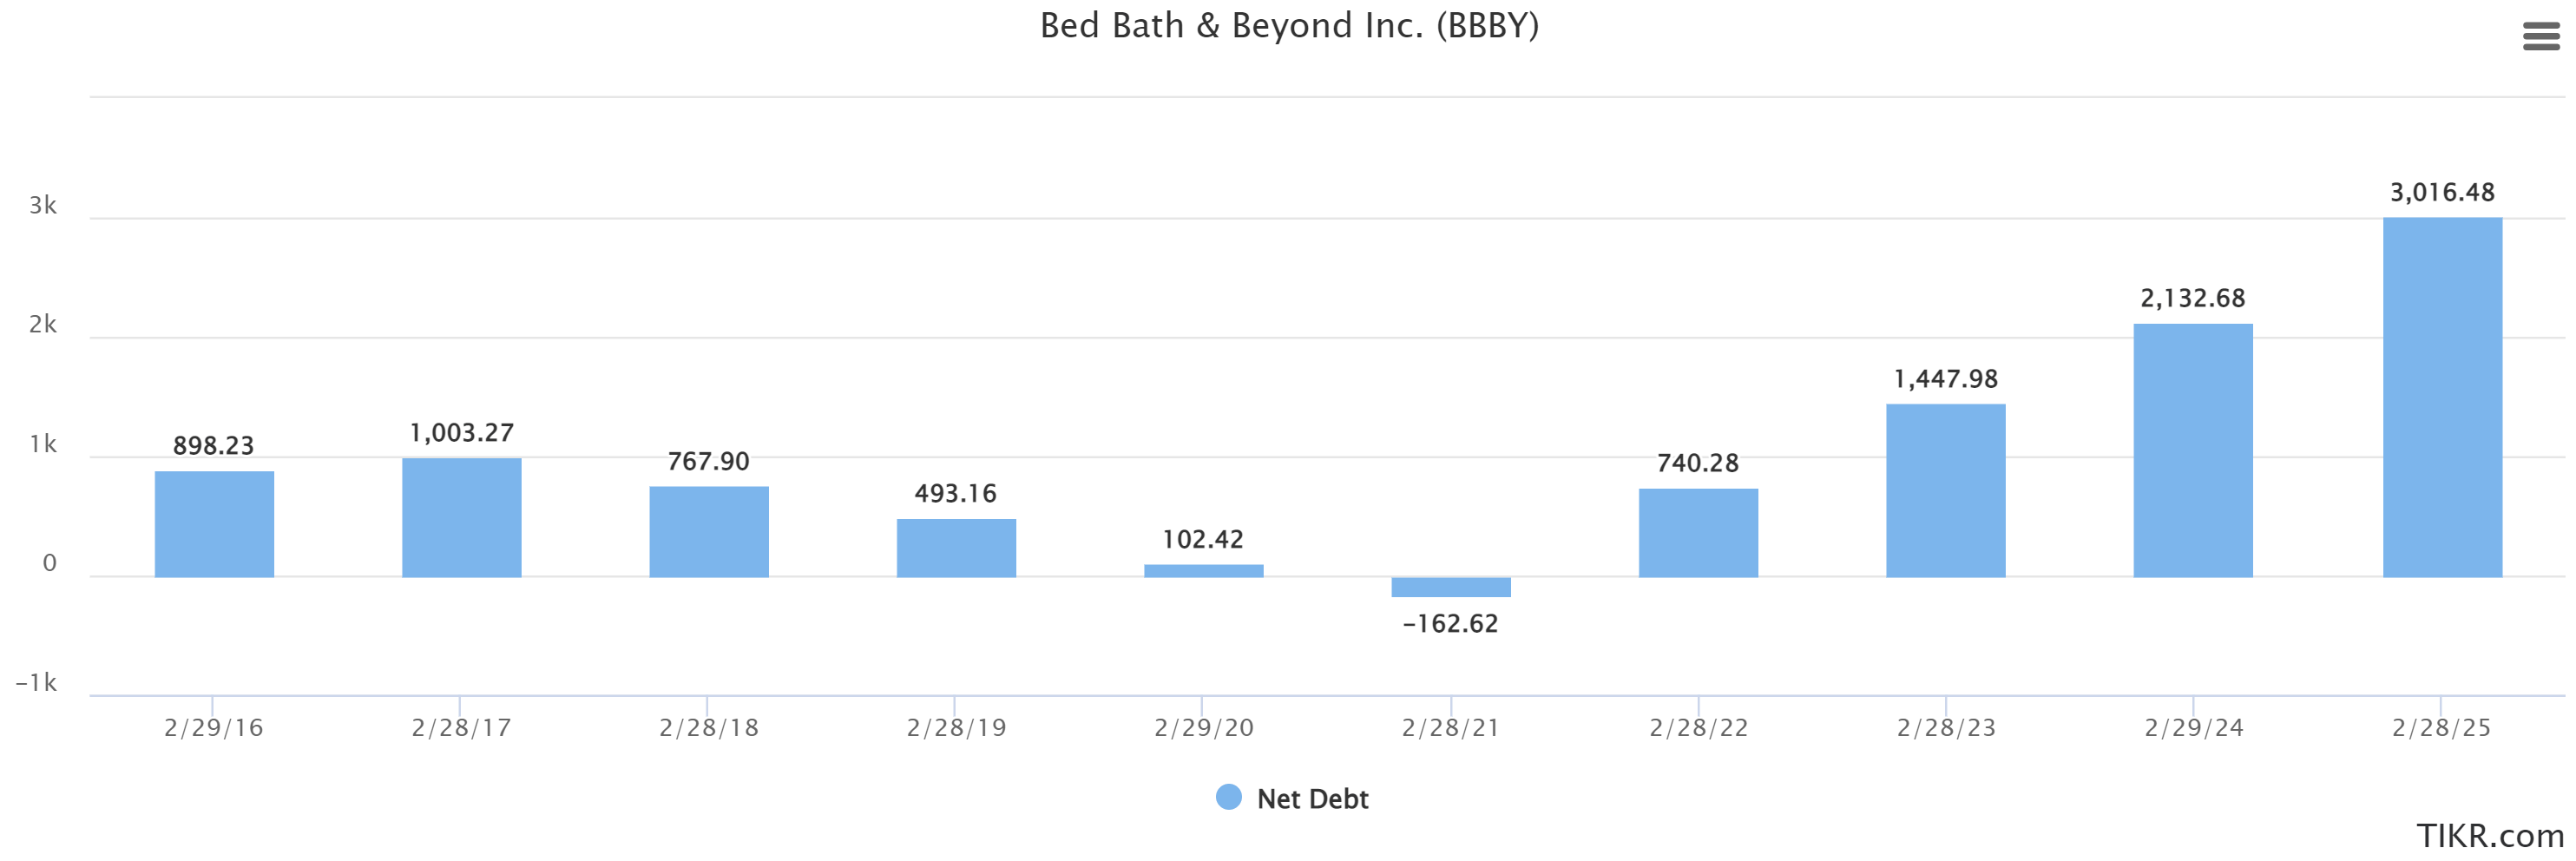
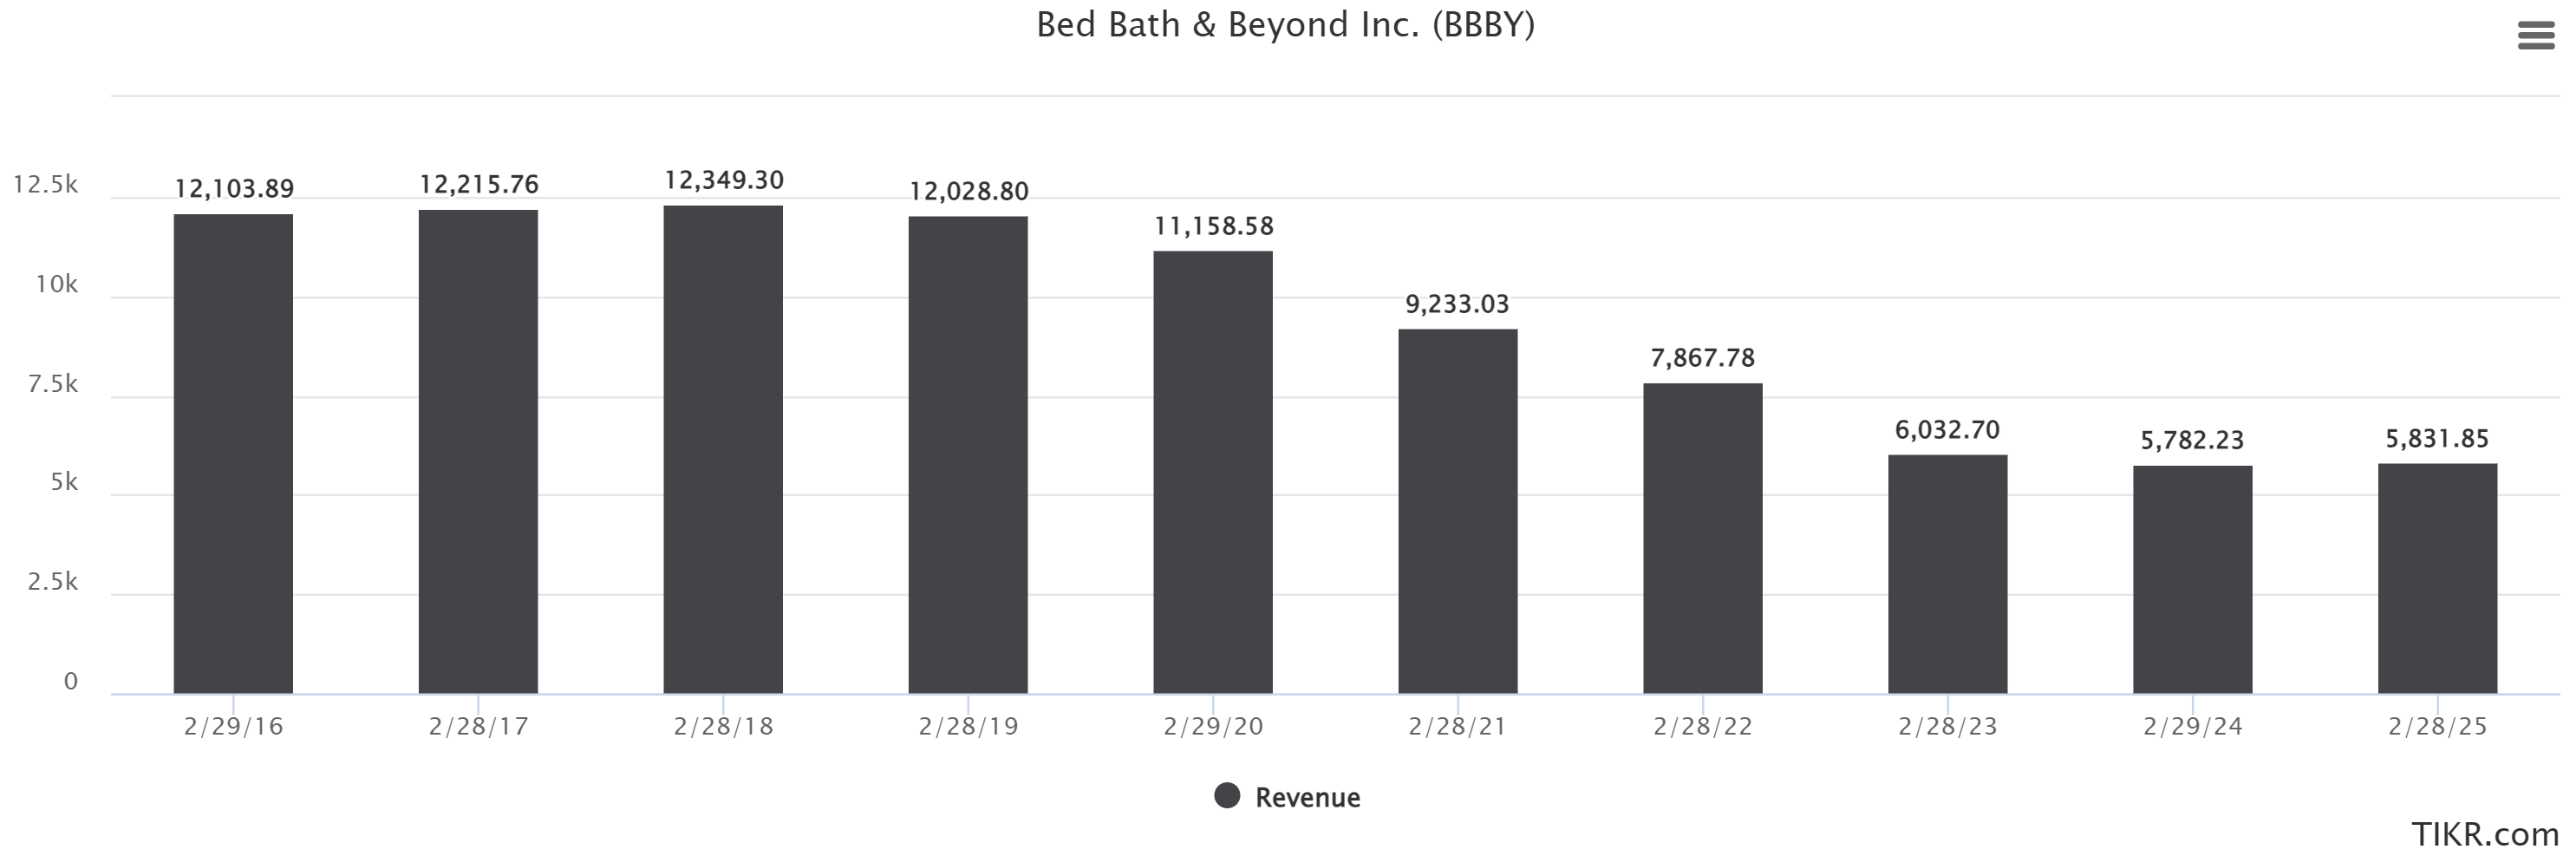
The above has direct impacts on cash flows and debt, which is what the next two charts below will outline. The trends are pretty clear. We see negative cash flows and drastic increases in net debt. This is a nasty combination for a retailer. After burning $336 million in cash in 2021, the writing is on the wall. In the current state of the world where we see rates increasing, the cost of debt will continue to climb, which is bad news for a company burning through cash. While they are trying to cut costs quickly by closing stores, the issue of increasing sales remains. If the company continues to burn cash at this rate, it will find itself buried in debt, and quickly. With revenues expected to fall over the next two years, I find it hard to believe this company is still around in its current state 12 months from now.
TIKR.com TIKR.com TIKR.com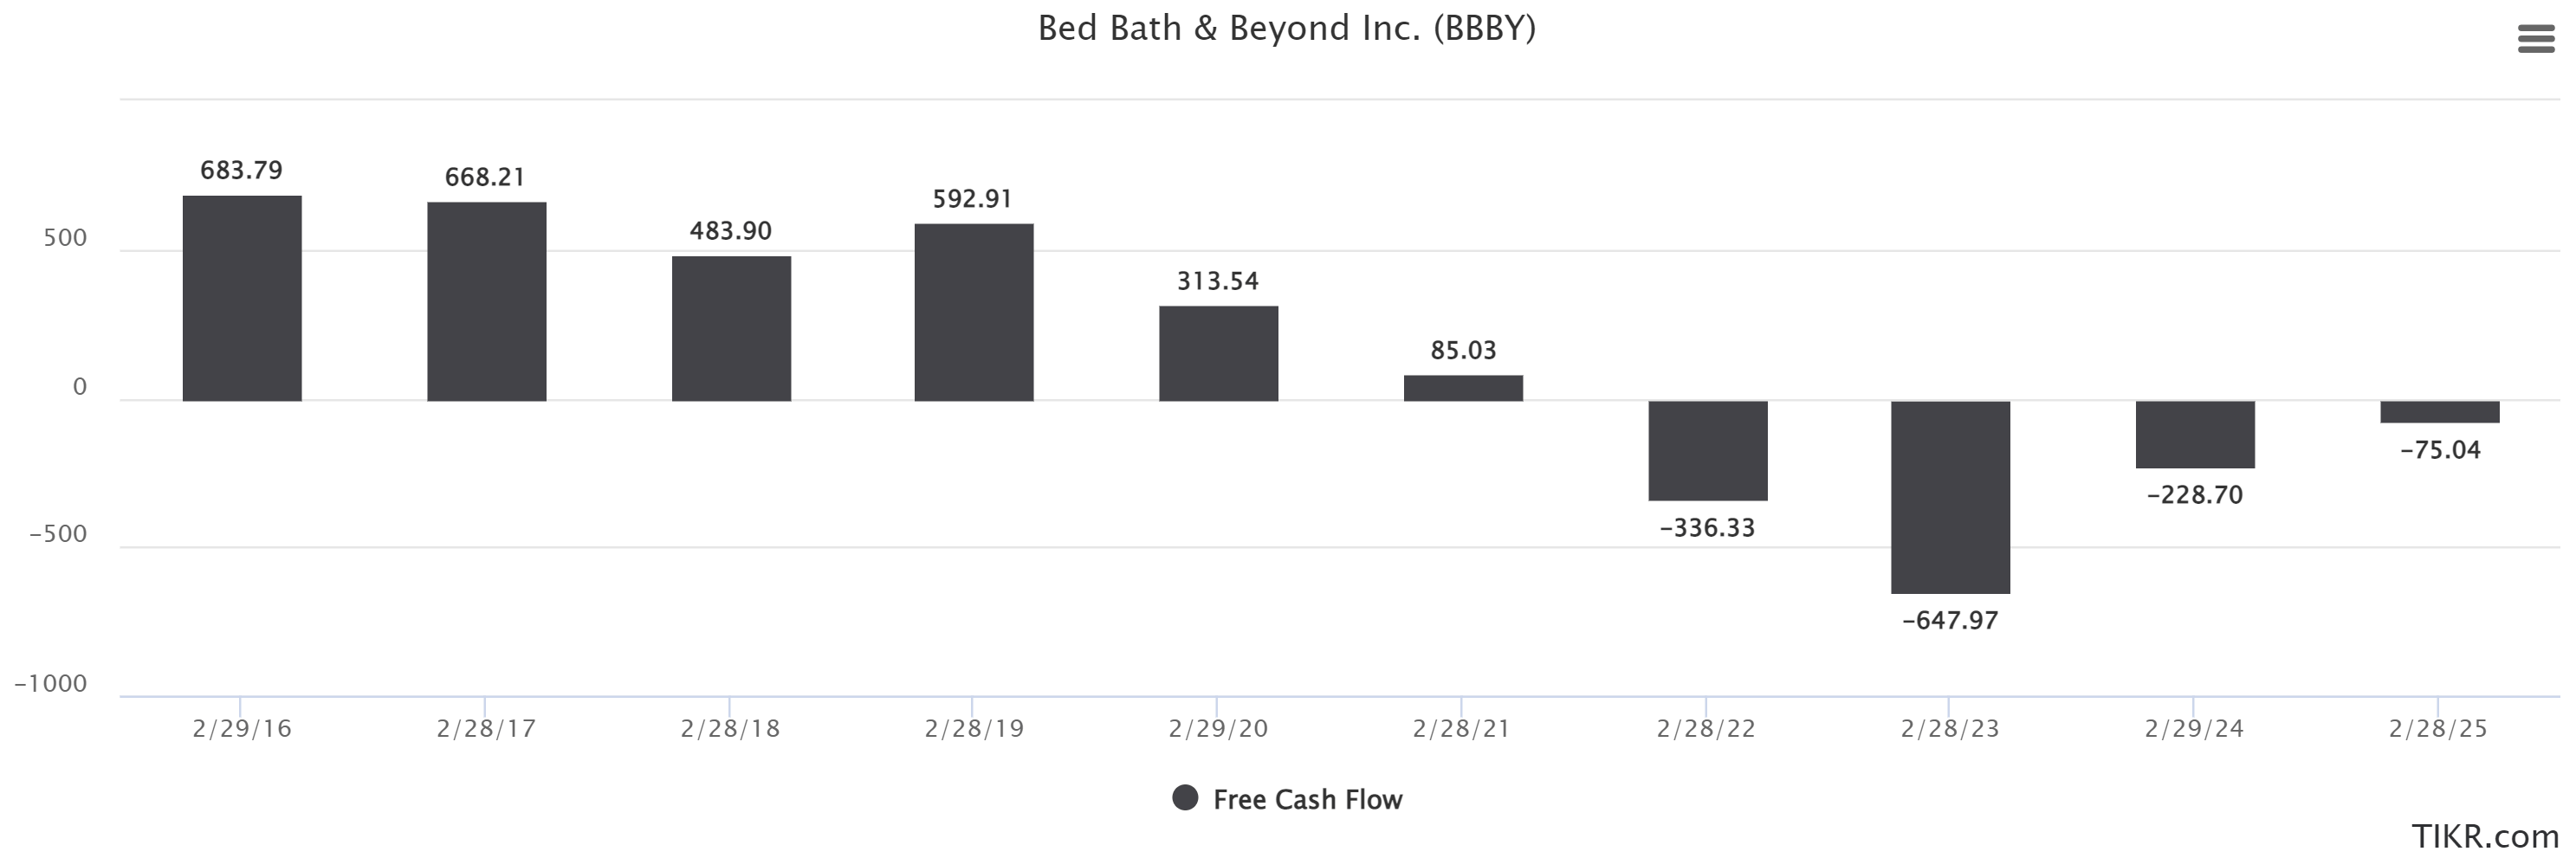
In my opinion, the make-or-break for Bed Bath & Beyond is going to be the holiday season. If we see consumers rush out in the numbers we have seen in previous years, it may buy them some time. That said, it’s not off to a great start after supply issues arose before Black Friday. While we could see further cash rises through equity sales, this would only damage the already low value of the share price. The only way in which I see this being a good idea is if we see yet another short squeeze on the stock and they can sell shares at an elevated price. Otherwise, we will see nothing but further dilutions which would likely have the opposite effect that they would hope for. I don’t often write “sell” articles but given the massive retail following, this company has, hopefully, this helps drive some awareness around what’s currently happening with this stock. The fundamental picture is a dark one as we stand today.
What Are The Insiders Doing?
One of the telling signs of the state of a beaten-up company is looking at what insiders are doing concerning the buying/selling of shares. What’s interesting here is that the “important buyers” (Executives, and Board Members) were actively picking up shares in the June/July crash. The only one selling was Ryan Cohen (Chairman at GameStop) who was an Activist investor in Bed Bath & Beyond. Looks like he timed his buying and selling fairly well.
Simplywall.st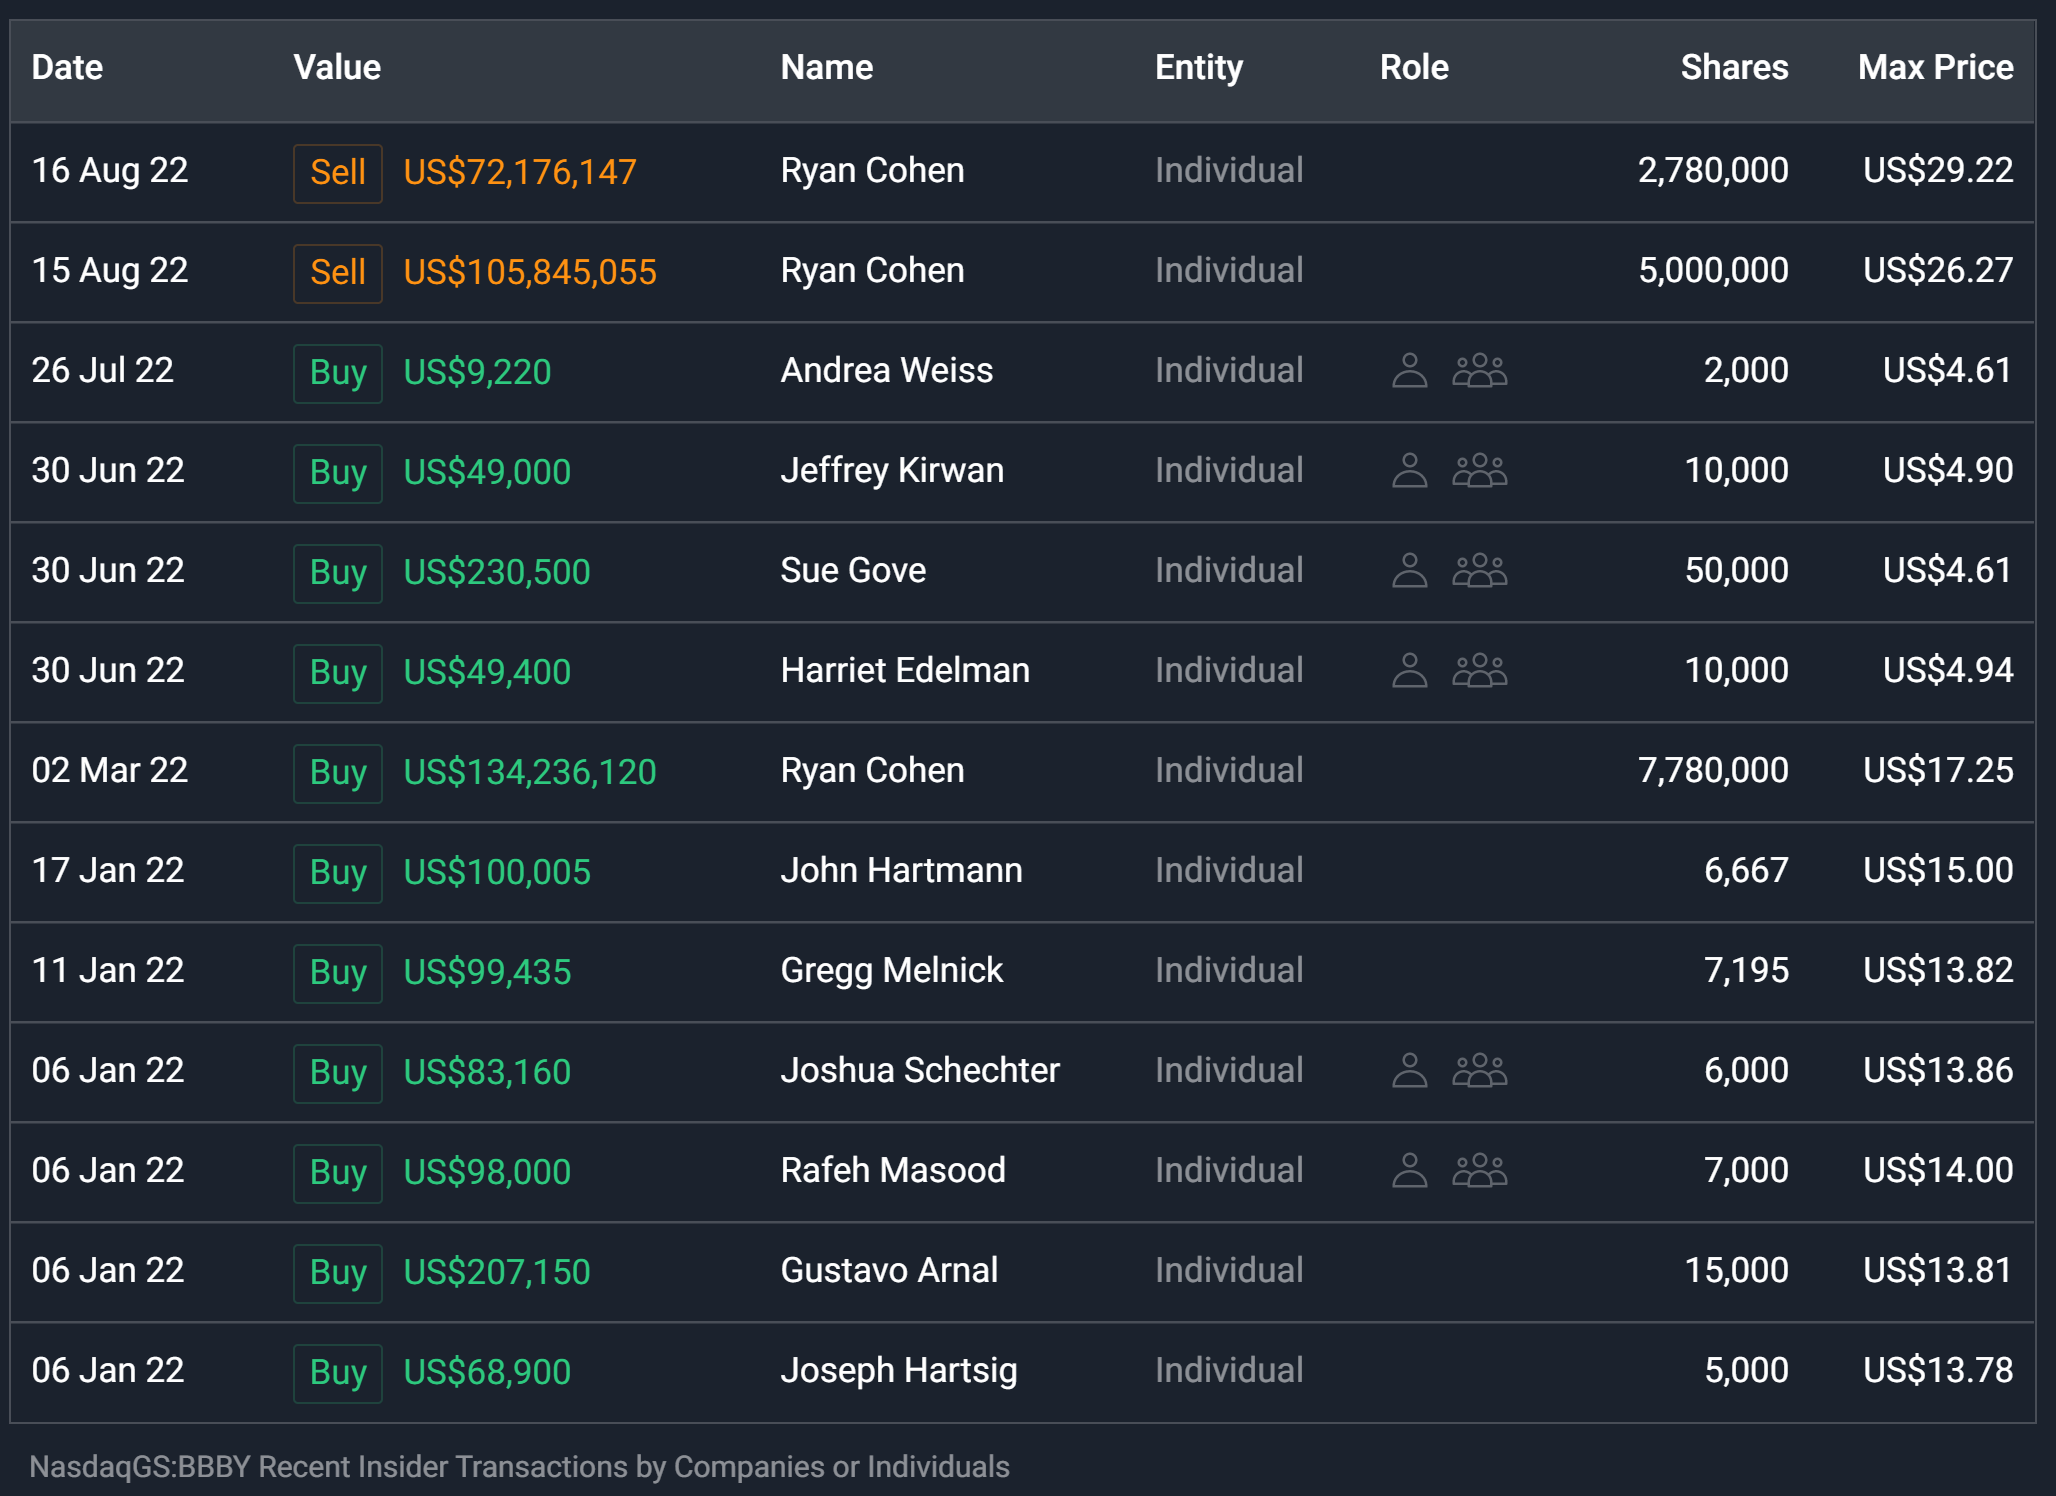
So, how do we read this? It means those at the wheel still believe in the company. Now the volumes aren’t massive by any means, but it is encouraging that they are holding on, at least for now. I would feel a lot better if the volumes were larger, but it’s better than I expected to see when diving into the recent insider action. I will be watching closely to see if there is any further action in the next couple of weeks.
What Does The Price Say?
Fundamentally it appears to be a bit of a disaster, how do the technicals look? Not much better. One of the first things I look for in a company that has been beaten up is a bottom or hopes of a rebound (technically speaking). And that starts with the 200-day moving average. Looking below, we can see that traced by the orange line. We can see that this moving average has provided both support and resistance over the years. But right now, it is nothing but resistance. I have circled the two spikes over top of it in the last year, but as soon as we had re-tests, they failed and the stock crashed to the levels we find it at today. If there were legs here, the crash would look more like what we saw in early 2021 where the moving average acted as support and the stock reacted positively as it approved the moving average.
TC2000.com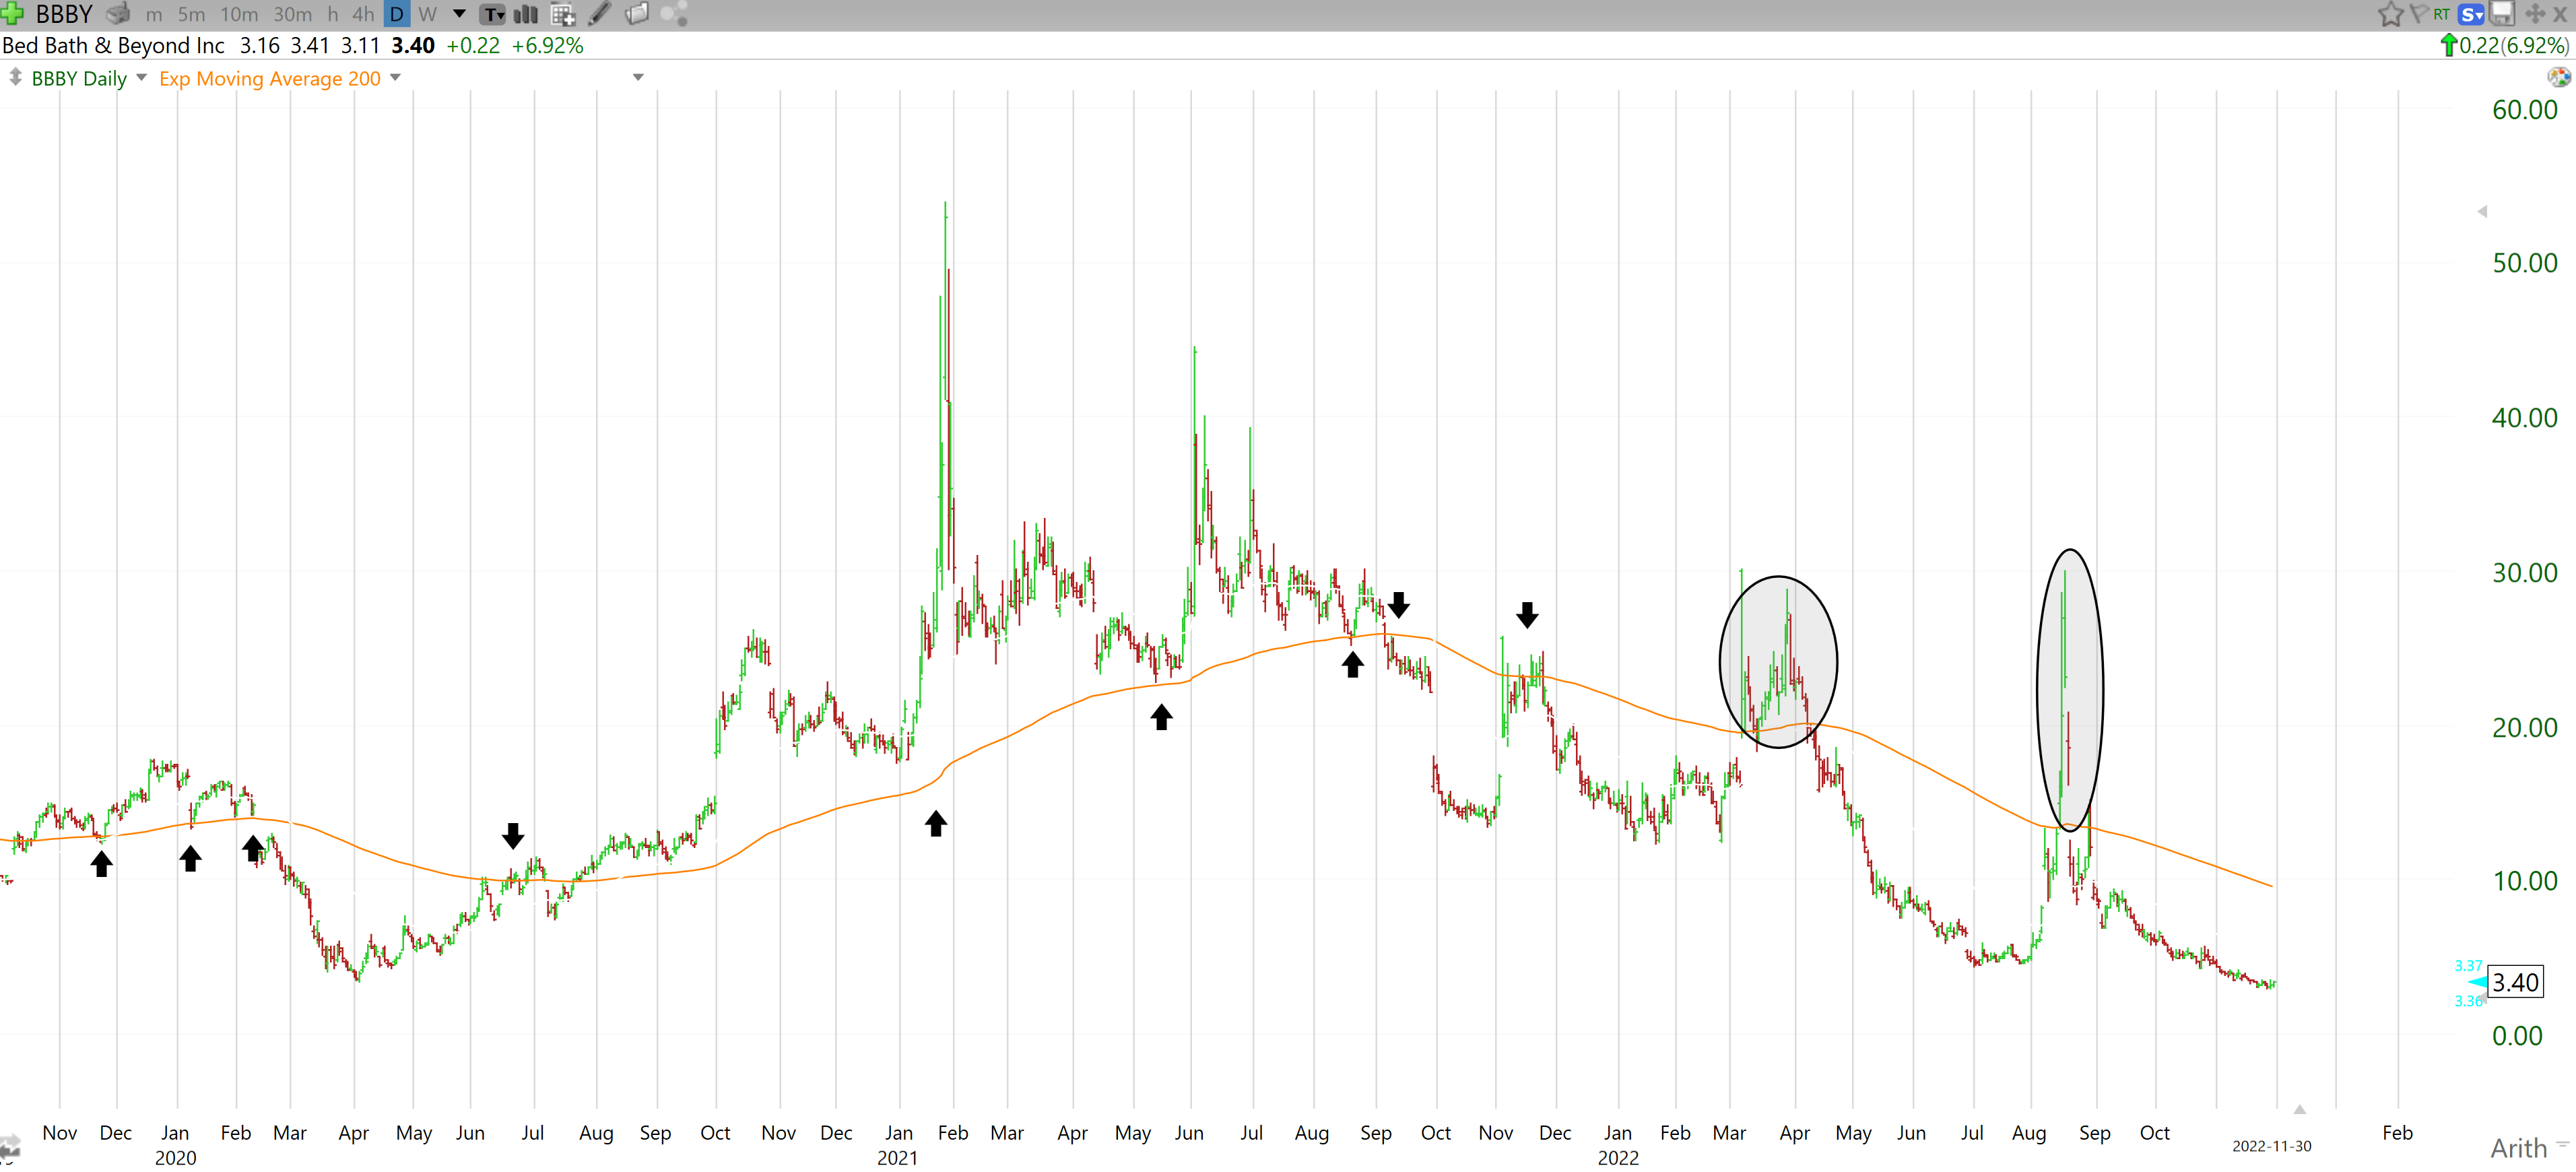
This means it will be tough for the stock to get back above the moving average and maintain any momentum (outside of crazy good news). It would take 180% for the stock to re-test, and I don’t expect to see news of that caliber anytime soon.
The next thing I want to see is that we have price support. Looking below we can see that doesn’t exist, at least not in the last 28 years. We broke through the 2020 low ($3.43) last Friday and even with a 4% rally today (Wednesday) we still closed below that mark. The risk here is that the $3.43 mark has proven to be useless with respect to support. If we would have bounced hard off of that level, I would have some faith. But without that, we are really guessing.
TC2000.com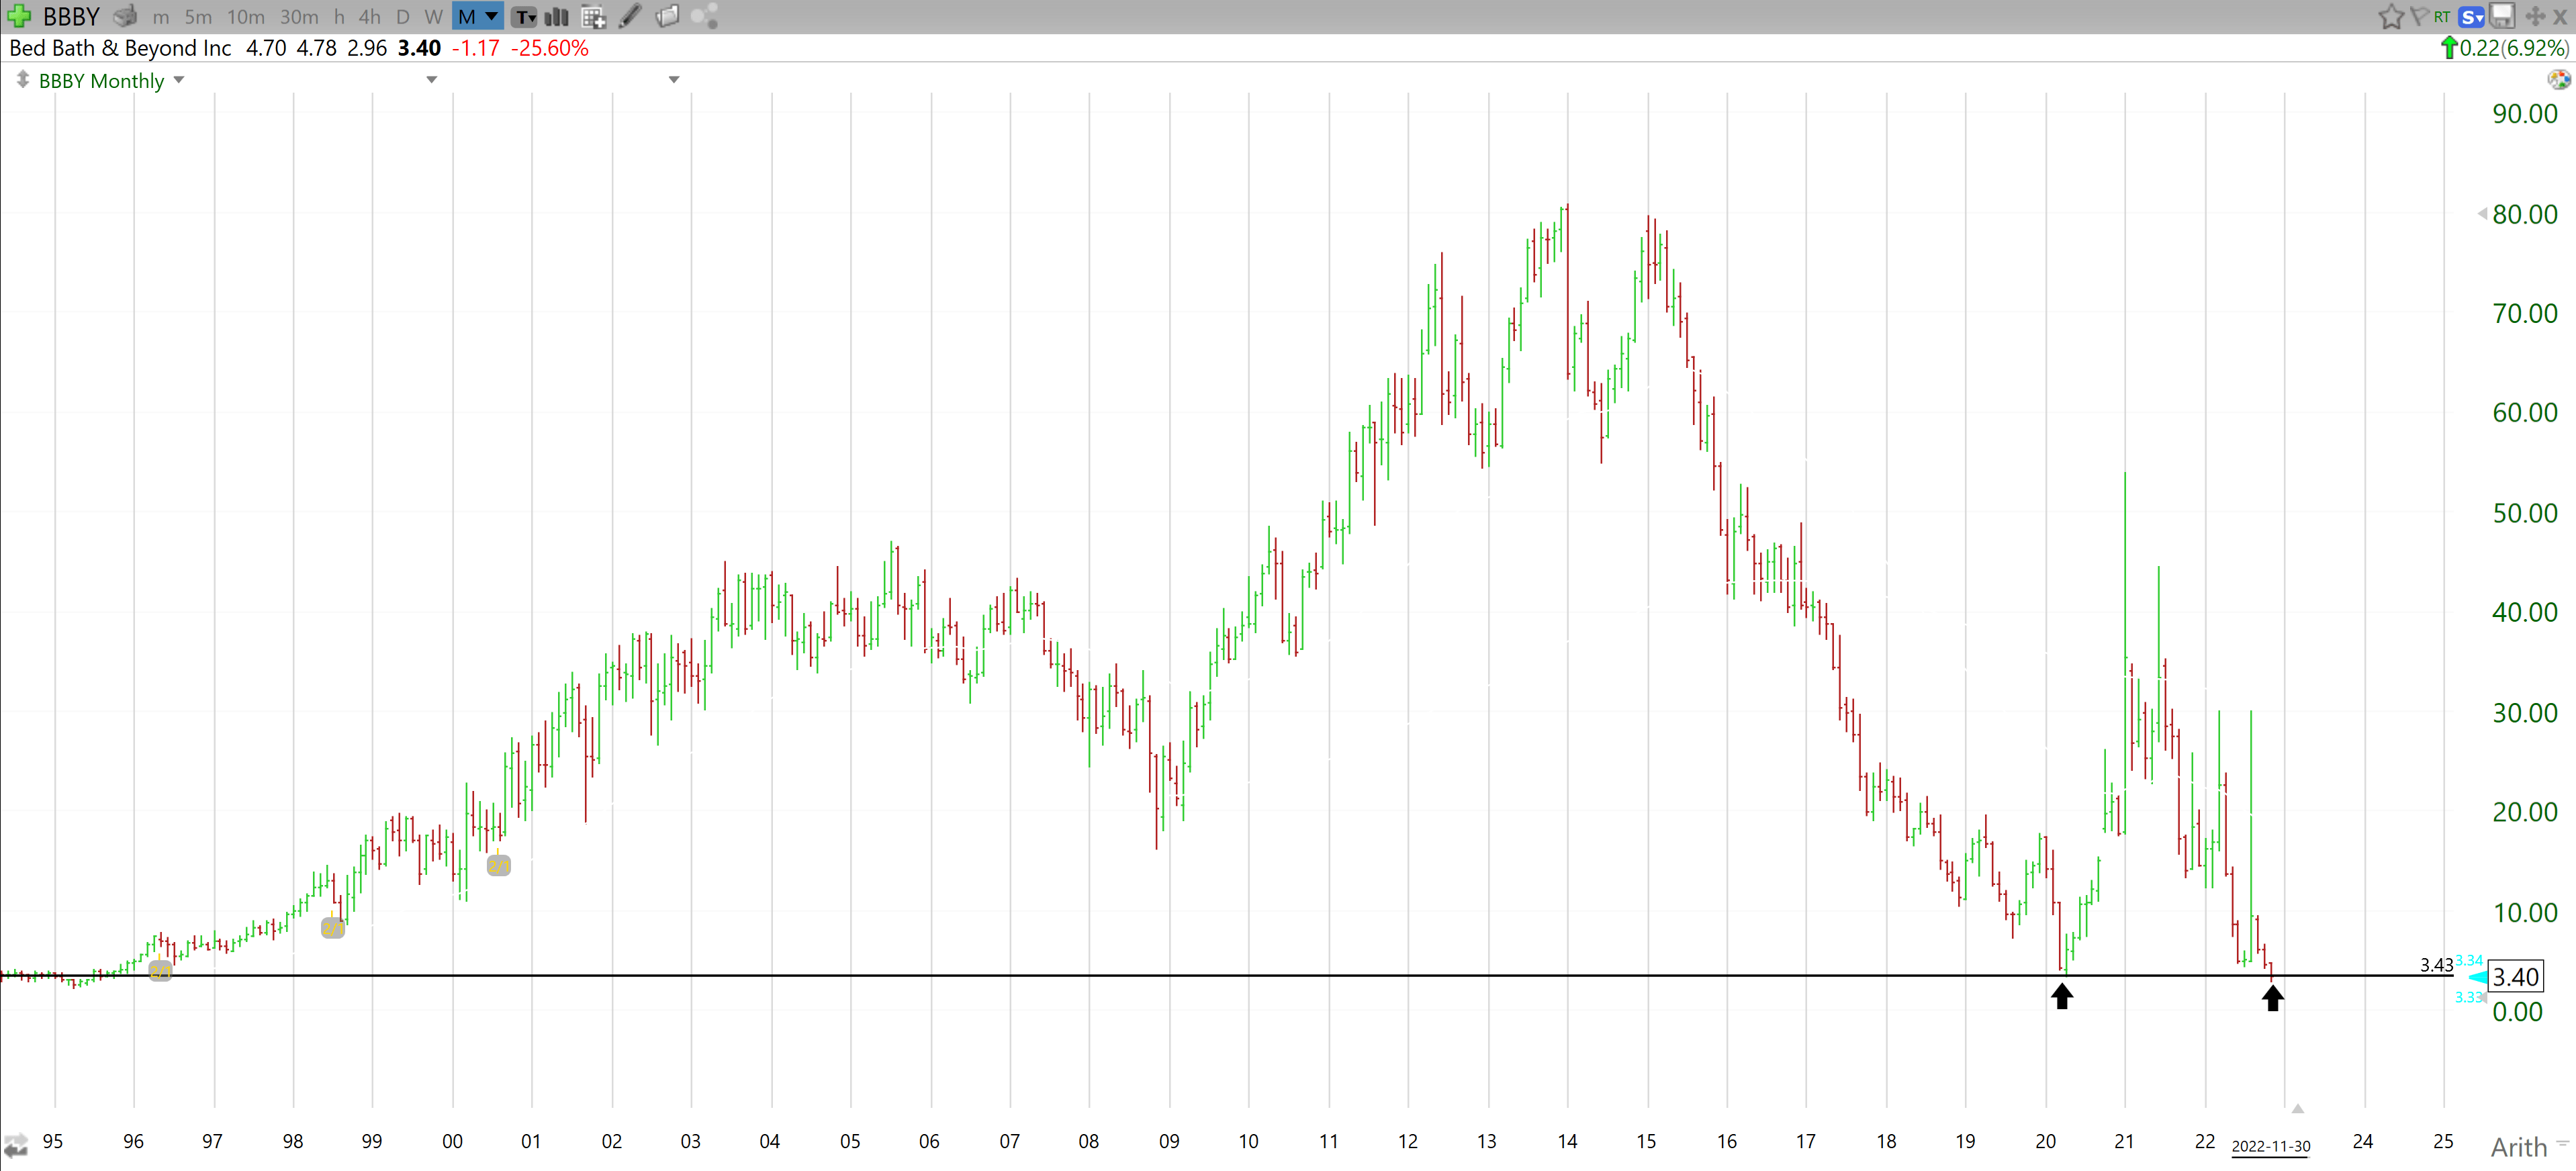
“But the bottom is IN!” Ok, let’s pretend I subscribe to that thesis (I don’t). Let me look at what could happen and give you an investment plan. First and most importantly, the stop. I would have a hard stop-in at $2.94. Looking below, we can see that the current low is $2.96, so this gives a bit of wiggle room. Considering the stock is at $3.40 as I write this, it leaves you exposed to a ~12% hit. Which isn’t too bad assuming you size appropriately. What would the target be? I’d be looking at $5.80 from a technical view. We can see multiple levels of support there in the last 6 months. This would be a 70% return. Not bad!
TC2000.com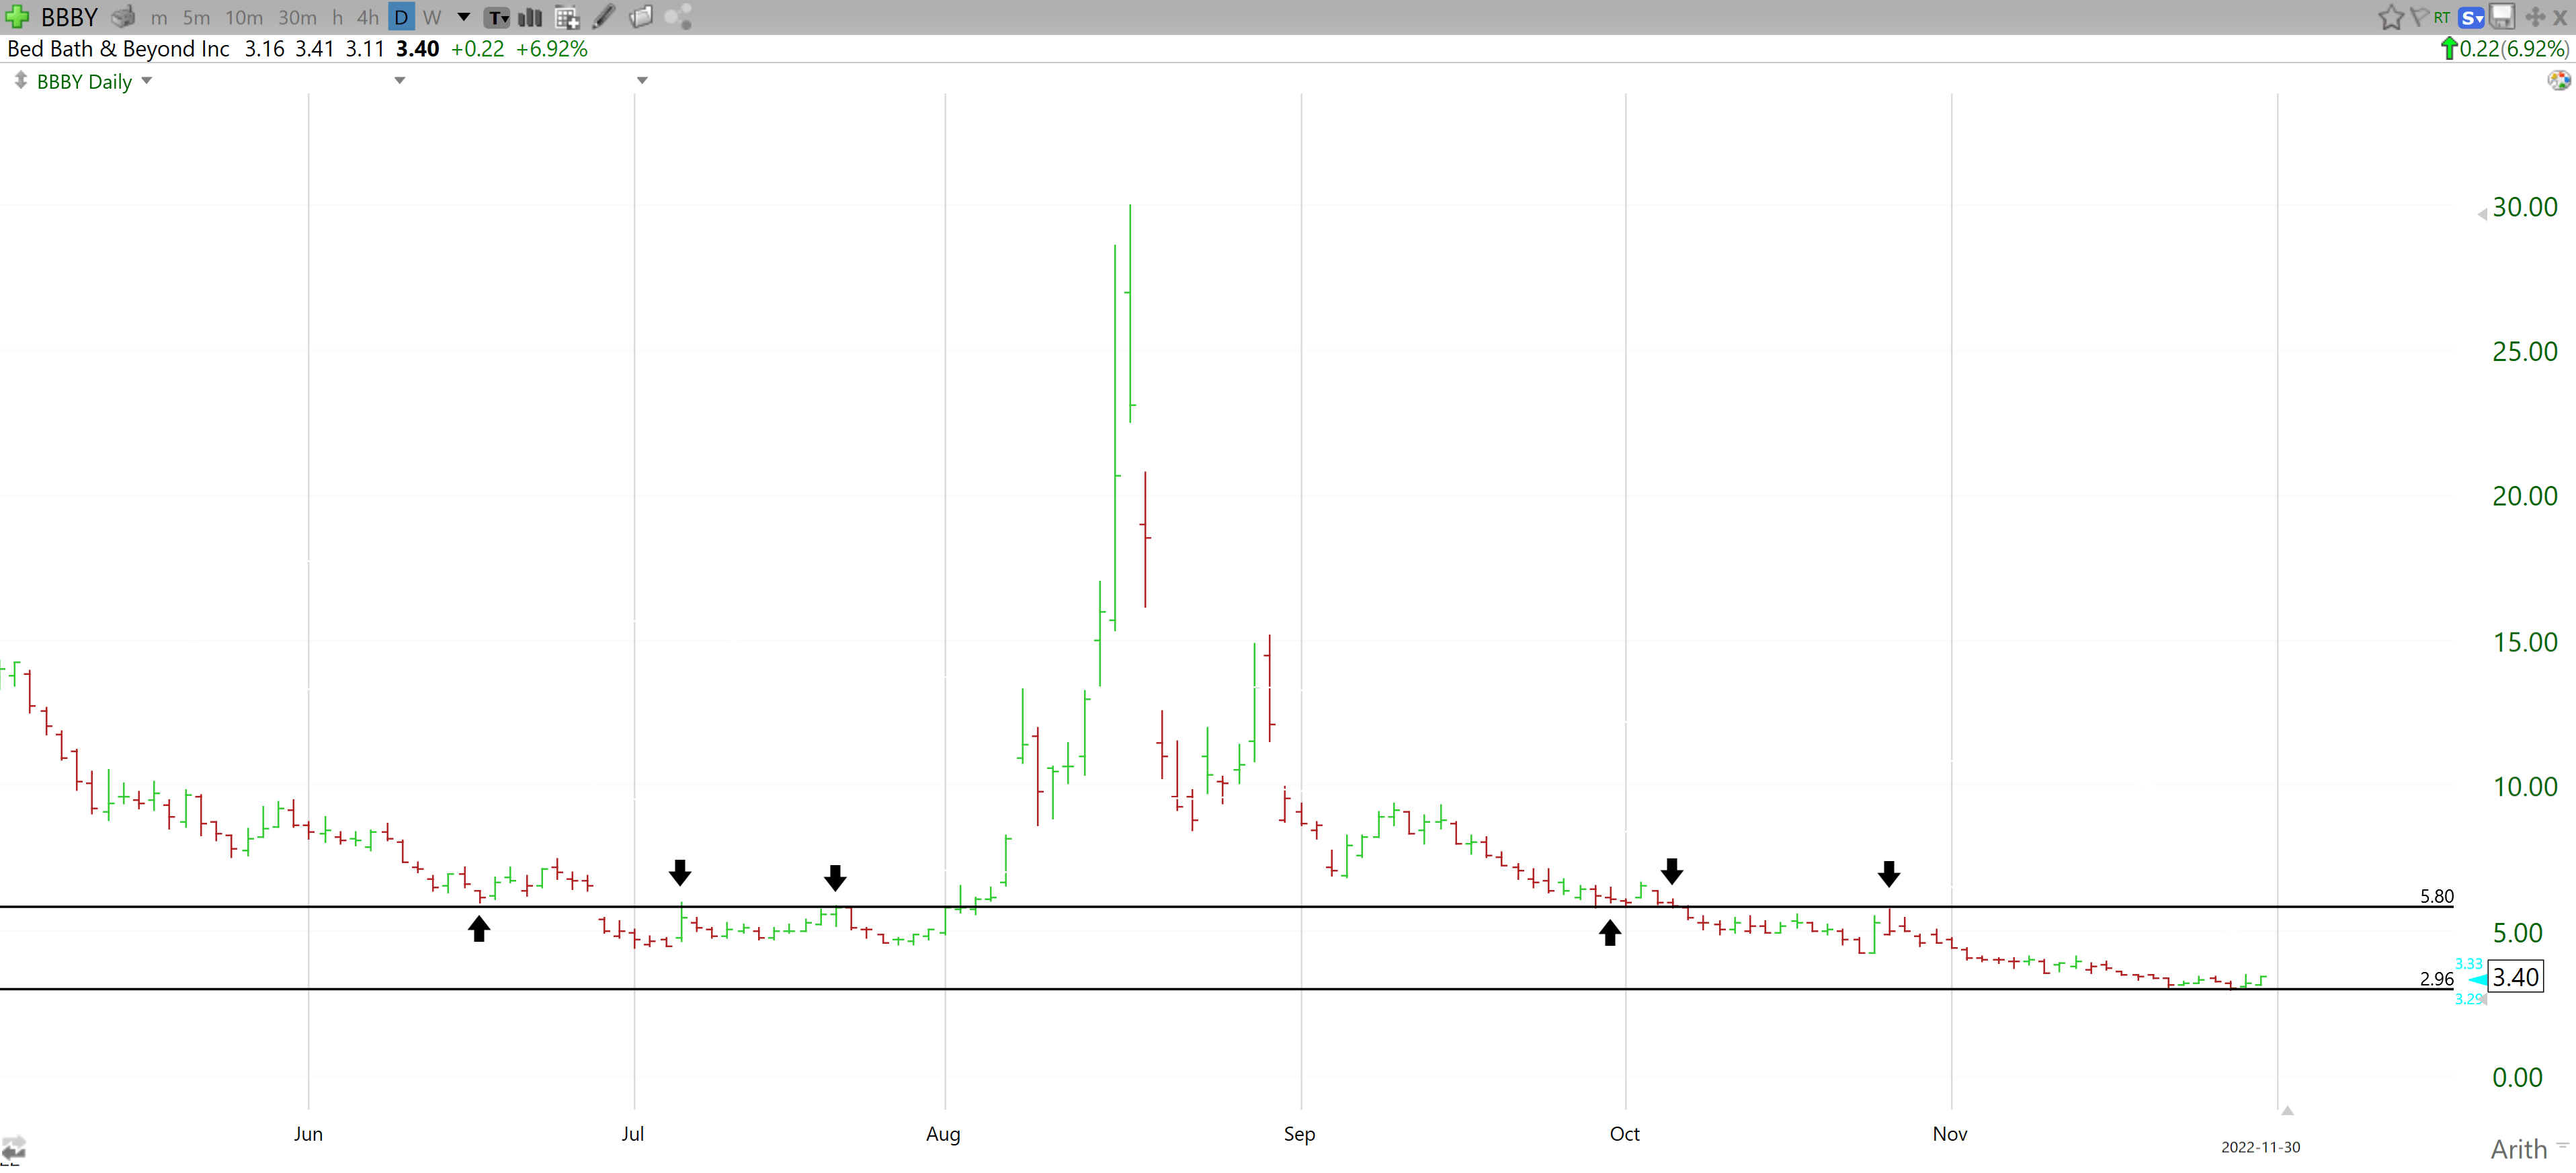
“So you just hate money don’t you!” No. The stock is well below the 200-day moving average, and there isn’t proven support below current levels. Therefore, I am out. This could very well turn around, but I would rather put my money into a turnaround story that has quality fundamentals behind it. There are better choices than the current state of Bed Bath & Beyond. Tread carefully.
Wrap-Up
As you can see, the insiders still have belief and there are multiple retail investors (57% owned by the general public) who think this stock is bouncing back. However, I believe the stock is headed the other way. Based on the state of the balance sheet and the technical picture, I do not think Bed Bath & Beyond will be around this time next year. I hope I am wrong because of the people that will be impacted, but I fear the writing is on the wall. Unless there is another short squeeze and Bed Bath & Beyond is able to raise capital at a premium, it’s not looking pretty. If you see value here, be cautious and use tight stops to protect capital. I will be watching this one from the sidelines.
Be the first to comment