

chonticha wat/iStock via Getty Images
Investment thesis
Gold (GLD) is the best hedge against inflation. It has proven so over time and is doing so today. Gold stocks can provide additional leverage to gold and are most rewarding in a high inflationary environment spurred by strong gold prices.
Inflation now and then
The inflationary period we are facing today is pretty much the same as the 1970s to early 1980s. You probably saw many headlines about this and the fact the inflation rate is the highest in 40 years, going back to this period. The 1970s inflation was mostly triggered by the Arab oil embargo which caused energy prices to rise significantly. Prices were already rising because the US reached peak oil production and was relying heavily on oil imports. Oil went from under $5 per barrel to over $35 so the percentage increase was huge and energy prices feed through the entire economy, so it pushed all prices higher. You can find more detail at Wikipedia here and is the source of this chart.
Wikipedia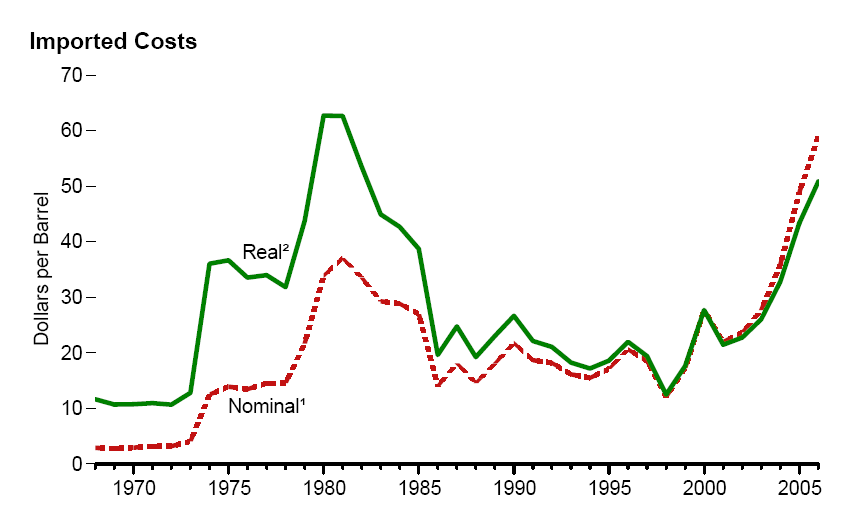
I got out of college in 1974, so all my real world early learning was in a high inflation period. I remember it very vividly. Back in the day, as my children would say, you spent money as fast as you could and even borrowed to do so. Prices would only be higher if you waited. The interest rate increases were way behind the inflation rate and this is even more so today. The last US inflation figure came in at 8.5% and the 10-year US treasury has just gone over 2.5%, which means rates are still negative by -6%. Today, at current inflation rates, the interest rate would have to be real by at least 2% to slow inflation. That means 10.5% interest rates to slow inflation. I expect rates will not even get to 3% or 4% before the economy blows up.
Today the inflation is caused by supply shortages just like the 1970s. However, this time it is not just oil but widespread shortages in many goods resulting from supply chain issues caused by Covid-19 lock down policies. This has been further exaggerated by the sanctions over the Ukraine war. When the war is resolved, sanctions will probably persist and the world will struggle for years to get supply chains functioning better. Today, China is back to lock downs, disrupting the supply of many goods.
tradingeconomics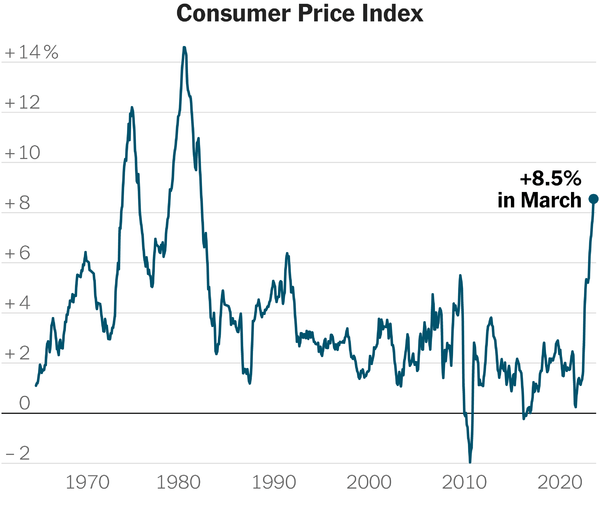
Actually, the Fed is helpless, because the current inflation wave is driven by lack of supply and the Fed has no control over that. Nevertheless, the Fed and/or market will force rates higher and eventually the demand will be brought down to meet the level of supply chain disaster.
Another important point is the actual inflation rate is much higher than reported and probably already at the 1980 peak. This is because they have considerably changed the way they measure inflation since the 1970s and 1980s. Federal social program payout increases are tied to the yearly inflation rate so it benefits them if reported rates are lower. Some major changes since the 70s/80s are:
-
Rental prices are used instead of housing prices;
-
Since late 1980s, hedonistic quality adjustments are used to lower price increases. For example, a new model year for a car and its price is higher, but the quality has improved, say anti-lock brakes, than the price increase would be calculated lower. Computers drop every year because of this;
-
Substitution is an attempt to predict consumers. If oranges rise too much in price, they will replace them with lower priced apples, claiming consumers will change buying habits. You will buy ground beef instead of steak as well;
-
Weighting, they are constantly changing what percent items have on the index. Probably to lower the inflation number;
-
In Canada, not sure in the US, but if the size of packaged items are reduced, that is not adjusted in the inflation number for that item. We have all witnessed this in many food items.
Just because the inflation number is reported lower, it does not change reality. Consumers will have to pay the real higher prices. These real prices are what effects the economy, not some number the government makes up.
Let’s compare gold price performance today to the 1970s. This historic chart from the 1970s shows gold rising about 1,000% in that high inflation period.
goldchartsrus.com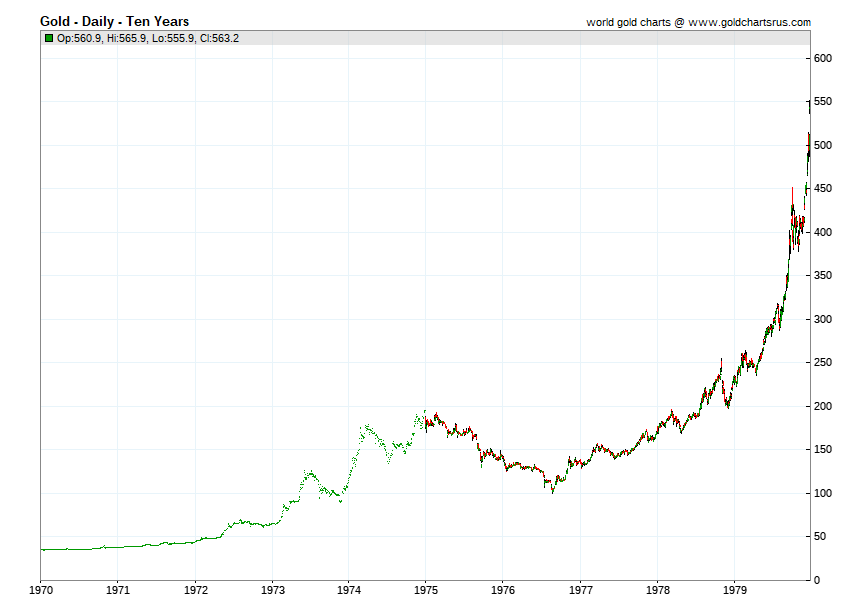
Now that was about 10 years of inflation in the 1970s, and currently we have only witnessed about 6 months of high inflation. Inflation began to rise in spring of 2021, but the Fed convinced markets it was transitory. That never fooled me for a minute, but nevertheless, markets bought into the transitory theory.
ycharts.com
The perfect way to gauge the markets is to look at the response in the 10-year treasury yield on this chart from macrotrends. Yields started to rise form the November 2021 lows and markets started to throw out the transitory theory around that time as shown by the steep rise in the 10-year treasury yield.
macrotrends.net
This evidence convinced me to measure the performance of inflation hedges since the November/December 2021 period, so let’s look at gold prices. So far gold has performed as it has historically with a considerable gain from around $1800 to $2060. It has only been 6 months of this high inflation period and we can expect considerably more gains down the road. If gold were to gain 1,000% like the 1970s we are looking at $18,000 gold and why not, Bitcoin went to almost $80,000.
barcharts.com
I believe silver is also a good inflation hedge and it is up about 20% in 2022. Of course, gold and silver stocks will do well and I also think oil & gas stocks are good inflation hedges because a lot of the current inflation will be driven by higher energy prices. I have heard a lot of commentary that cryptocurrencies are good inflation hedges, especially from millennials. This holds no water and actually the exact opposite is true.
First off, crypto has not been around long so has no historic precedence. I believe they are actually just speculative bubble money that has done well because of the easy monetary policies. Just look at this chart below and how the number of cryptocurrencies has ballooned since the easy money at the start of the pandemic. This alone should prove to you that it is just a speculative bubble.
statistica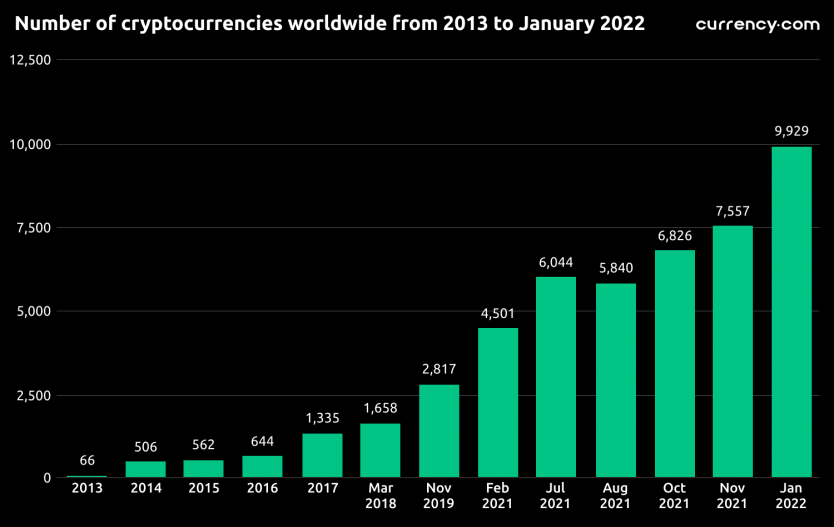
If cryptocurrencies are good inflation hedges, which ones of the 9,000 do you buy? To look at this as fairly as possible, have a look at the most established one, Bitcoin. Since the inflationary period began, Bitcoin has come down from its peak near $80,000 to around $40,000, losing about half of its value. It is simply speculative easy money unwinding and cryptocurrencies are in a bear market, just like the bond market and probably stock markets that will soon follow.
coinbase.com
Gold is the best inflation hedge and besides owning physical gold, a good gold stock can give more leverage. I have been following a very unique gold stock that is not normally something you come across often. New Found Gold Corp. (NYSE:NFGC) is in a new gold belt in Newfoundland Canada that has not had much exploration. They have made a very high grade discovery that is looking very large with no end in sight yet to this vein system.
The company has been public for less than two years and some investors might not even know of them yet. Eric Sprott is a major shareholder. Mr. Sprott said in an interview: “I do believe it is special. It’s going to prove to be maybe the greatest gold discovery in the history of Canada, if not in the world. So that’s what makes it so easy for me to put that additional money in it.”
New Found Gold trades most volume in Canada under TSXV:NFG
Shares outstanding 164.2 million Fully diluted 178.8 million. Add another 15 million shares outstanding for Eric Sprott’s recent financing. Major Shareholders are:
- Eric Sprott 31.4% (post financing);
- Palisades Gold 31%;
- Management/Insiders 3%.
We are in a new gold bull market. NFG has a strong financial position of $106 million working capital and Eric Sprott’s investment of another $125 million means no further dilution for quite some time. We have a break out on the chart and the high grade drill hits keep coming and will do so for the foreseeable future. This sums up why I see the timing to buy now as perfect.
As a refresher or if you are new to the Newfoundland gold play, this graphic from New Found Gold’s presentation highlights the area they are in and the faults that control mineralization in this belt.
New Found Gold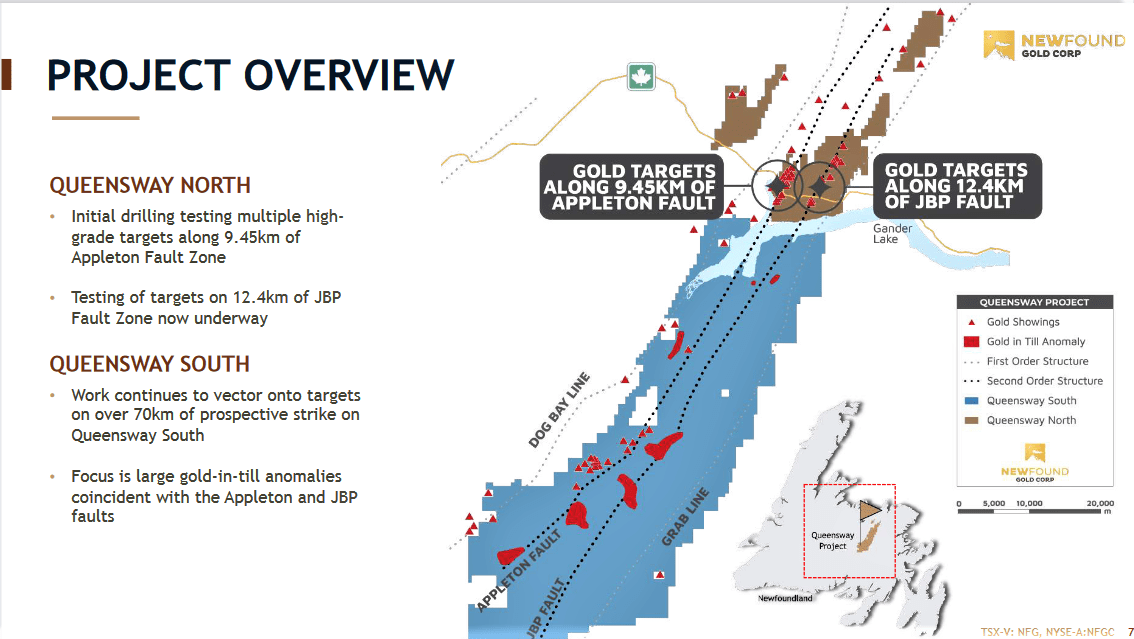
The Queensway Project is comprised of 86 mineral licenses, including 6,041 claims comprising 151,030 hectares of land located near Gander, Newfoundland. The Queensway Project is accessible by main access roads including the Trans-Canada Highway (“TCH”) that passes through the southern portion of the project and has high voltage electric transmission lines running through the project area.
On August 17, 2020, the Company announced it had initiated a 100,000m HQ size diamond drilling program at the Queensway Project. The company further announced on January 6, 2021, that it increased the drilling program started in 2020 to a total of 200,000m. This program was further expanded on October 15, 2021, to 400,000m. The company has a huge 400,000 meter drill program underway with 11 drill rigs, increasing up to 14, currently focused on 2.7 kilometers of strike over the Keats, Golden Joint and Lotto zones. They have multiple additional targets along an approximate 20 km strike length. There are many graphics in their year end December 2021 MDA. This one just shows the numerous drill holes in the Keats zone.
New Found Gold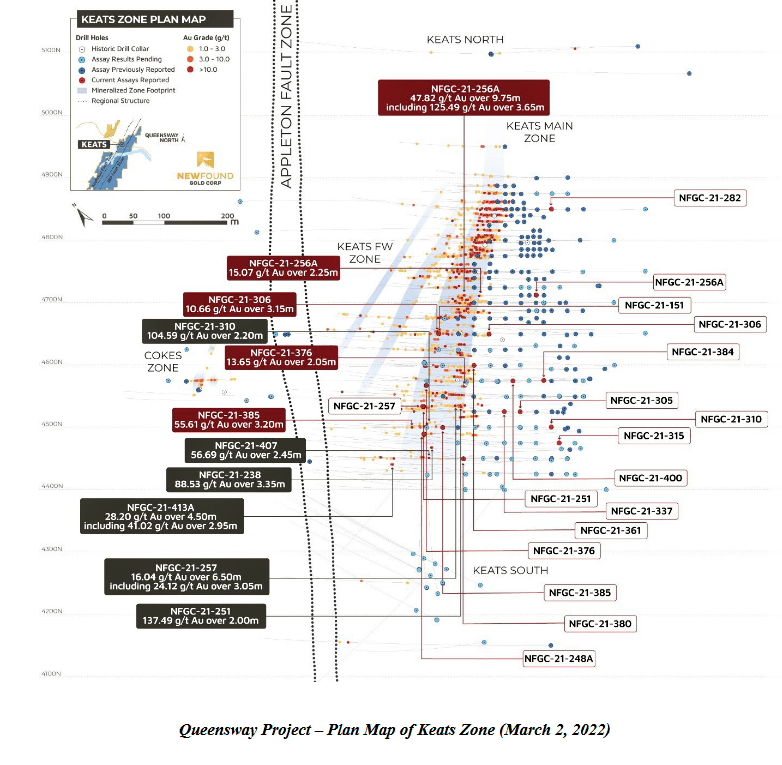
There has been so much drilling and so many very high grade results it is not easy to summarize. It is probably best to show these drill highlights from their presentation and you can relate to the map of the gold zones that follow.
New Found Gold
New Found Gold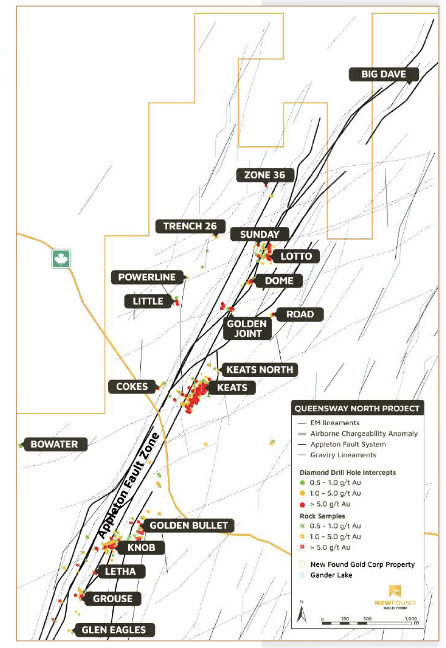
On April 13, New Found Gold announced a new high-grade gold discovery between the Keats and Golden Joint zones, located approximately 440 meters north of the Keats zone. NFGC-22-515 was the first hole drilled as part of a planned systematic program to drill test along the Appleton fault zone (AFZ) and returned 9.21 grams per tonne over 2.15 m and 43.9 g/t over 3.85 m. This hole is located in the Keats North area and this discovery has been named the 515 zone.
Approximately 40 per cent of the planned 400,000 m program at Queensway has been drilled to date with approximately 19,120 m of the core with pending assay results. Eleven core rigs are currently operating and New Found is targeting an increase in the drill count to 14 rigs.
Financial
NFG is in a strong financial position with $106 million in working capital and an additional $125.9 million on its way from an additional Eric Sprott investment. The first tranche of the Sprott transaction is expected to close occur on or about April 27, 2022, for 8.25 million shares at $8.35 per share for consideration of $68,887,500. A second tranche closing is expected to occur on or about Aug. 5, 2022, for 6.75 million shares at $8.45 per share for consideration of $57,037,500, for a total consideration of $125,925,000 for 15 million shares.
Risks
The most obvious risk is a plunge in gold prices and the whole sector. I see that as small given the inflationary outlook and an exploration stock can move independent of the gold price. The stock has some sort of premium priced in because the deposit is expected to grow. If the drilling starts to come up with bad holes, meaning the limit of the deposit is reached, the stock could sell off. I don’t see that happening this year. They have a lot of assay results in backlog that hit veins with visible gold. Because this is an advanced project, high grade, in a friendly mining district and well financed a lot of risks for a junior explorer are eliminated.
Conclusion and valuation
Gold is the best inflation hedge and a good gold stock gives more leverage. New Found Gold is unique and something probably not witnessed for decades. They are in a new under-explored gold belt in a mining friendly jurisdiction and are producing exceptionally high grade drill intersects. There is no limit in sight yet for this vein system, so there is at least another year of high grade drill results that will be reported. These facts warrant a higher valuation than most gold discoveries.
They have a very strong balance sheet and strong shareholder base. New Found Gold has a C$1.5 billion market cap and the best comparable I know of is Great Bear Resources that was bought by Kinross for C$1.8 billion this past December. Interesting and I hope a good sign, I bought into Great Bear around the same price New Found Gold is today. Great Bear was advancing a high grade project in the Red Lake district of Ontario and there is no 43-101 resource yet, just like New Found Gold. It appears to me that New Found Gold has higher grades and looks to be a bigger deposit. And the gold price is much higher than the time Great Bear was bought by Kinross.
New Found Gold could end up selling for north of C$2 or C$3 billion, especially if gold prices go higher. Agnico Eagle valued Kirkland Lake Gold at C$11 billion with their merger. The big prize was Kirkland Lake’s Fosterville South mine that is the highest grade mine in the world. New Found Gold has a way to go to prove this, but my point is that assets like this can reap a large premium. The break out on the C$ priced chart is signaling a move higher.
stockwatch
Be the first to comment