

New Zealand Dollar Talking Points
NZD/USD struggles to hold its ground following the kneejerk reaction to China’s Purchase Managers Index (PMI), and the recent rebound in the exchange rate may unravel over the coming days as a bear flag formation unfolds.
NZD/USD Rate Forecast: Bear Flag Formation Unfolds in April
NZD/USD pares the rebound from the yearly low (0.5469) even though the Federal Reserve unveils “a temporary repurchase agreement facility for foreign and international monetary authorities (FIMA Repo Facility) to help support the smooth functioning of financial markets,” and the exchange rate exhibit a more bearish behavior as it initiates a series of lower highs and lows.
It seems as though the unprecedented efforts by monetary as well as fiscal authorities have helped to curb the huge swings across the currency market as the Reserve Bank of New Zealand (RBNZ)establishes a credit facility that “will provide liquidity in exchange for eligible Corporate and Asset-Backed securities,” and the central bank may take additional steps to combat the weakening outlook for growth as Finance Minister Grant Robertson anticipates a “very significant increase” in unemployment, with the economy expected to contract at least 10% in the second quarter of 2020.
In response, the RBNZ may continue to utilize its unconventional tools as the official cash rate (OCR) sits at a record low of 0.25%, but it remains to be seen if Governor Adrian Orr and Co. will implement more non-standard measures over the coming months as the central bank pledges to support the New Zealand economy “either by increasing the size of the LSAP (Large Scale Asset Programme) programme, or through the use of other instruments.”
With that said, the RBNZ may merely attempt to buy time at the next policy meeting on May 13 as the central bank plans to “monitor the effectiveness of the programme and make adjustments and additions if needed,” but the dovish forward guidance may continue to drag on the New Zealand Dollar as the central bank pushes monetary policy into uncharted territory.
In turn, NZD/USD may exhibit a more bearish behavior as it initiates a series of lower highs and lows, and the rebound from the yearly low (0.5469) may continue to unravel as a bear flag formation unfolds.

Recommended by David Song
Forex for Beginners
Sign up and join DailyFX Currency Strategist David Song LIVE for an opportunity to discuss potential trade setups.
NZD/USD Rate Daily Chart
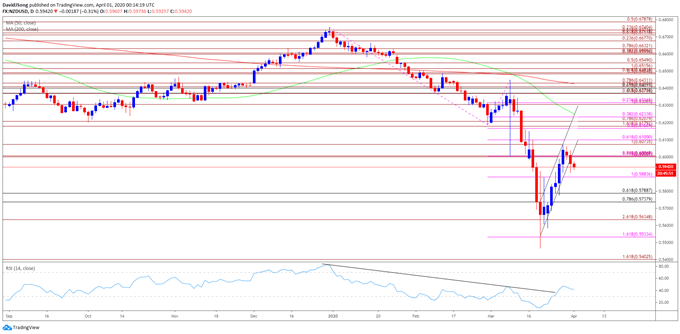
Source: Trading View
- Keep in mind, NZD/USD has failed to retain the range from the second half of 2019 as the decline from earlier this year produced a break of the October low (0.6204), with a ‘death cross’ taking shape in March as the 50-Day SMA (0.6250) crosses below the 200-Day SMA (0.6427).
- Recent developments in the Relative Strength Index (RSI) warn of a potential shift in NZD/USD behavior as the oscillator breaks out of the downward trend from earlier this year, but the recent rebound in the exchange rate may unravel over the coming days as a bear flag formation unfolds.
- NZD/USD initiates a series of lower highs and lows following the string of failed attempts to break/close above the Fibonacci overlap around 0.6070 (100% expansion) to 0.6100 (61.8% expansion), with a move below 0.5880 (100% expansion) opening up the 0.5740 (78.6% retracement) to 0.5790 (61.8% retracement) region.
- Next area of interest comes in around 0.5640 (261.8% expansion) followed by the 0.5530 (161.8% expansion) region.

Recommended by David Song
Traits of Successful Traders
— Written by David Song, Currency Strategist
Follow me on Twitter at @DavidJSong
Be the first to comment