Try to buy assets at a discount rather than earnings. Earnings can change dramatically in a short time. Usually, assets change slowly. One has to know much more about a company if one buys earnings.– Walter Schloss
Introduction
Looking in the mirror some people see their reflection, and others see what they want to see. This expression made me think of all the articles written on investors following Warren Buffett and Berkshire Hathaway (BRK.A), (BRK.B) into energy, where Buffett and Berkshire have famously accumulated large stakes in Chevron (CVX) and Occidental Petroleum (OXY). Despite knowing exactly what Buffett is buying, and speculating actively about what this means, many of these authors conclude their articles by recommending a yield-oriented energy play, like Enbridge (ENB), Enterprise Products Partners (EPD), or Energy Transfer (ET) to name three of the more popular choices that I have come across in my reading.
As a former co-manager of a private label MLP fund from 2006-2009, an ardent student of market history, and an owner of many of these names in income-oriented accounts, I can understand the appeal of pipeline-focused energy firms, with their attractive yields today. After all, Chevron’s yield of 3.9%, and Occidental Petroleum’s yield of 0.8%, pale in comparison, even though we know these yields will rise and do not take into account stock buybacks in the shareholder return formula.
Building on this narrative, Enbridge’s yield of 7.2%, Enterprise Products Partners yield of 8.0%, and Enterprise Transfer’s yield of 8.3%, which are the yields right now as I write this article Monday morning, October 3rd, are indeed superior relative yields. Additionally, investors in the energy sector with a history over the last two decades remember the epic bull market in these pipeline companies from 2000 to roughly 2015, and probably subconsciously believe that another similar bull market is possible.
While you would be hard-pressed to find an investment analyst more bullish on the energy sector than myself the last couple of years, we have to make the distinction between secular sector tailwinds, and valuing individual companies across the spectrum of the choices available in the energy sector.
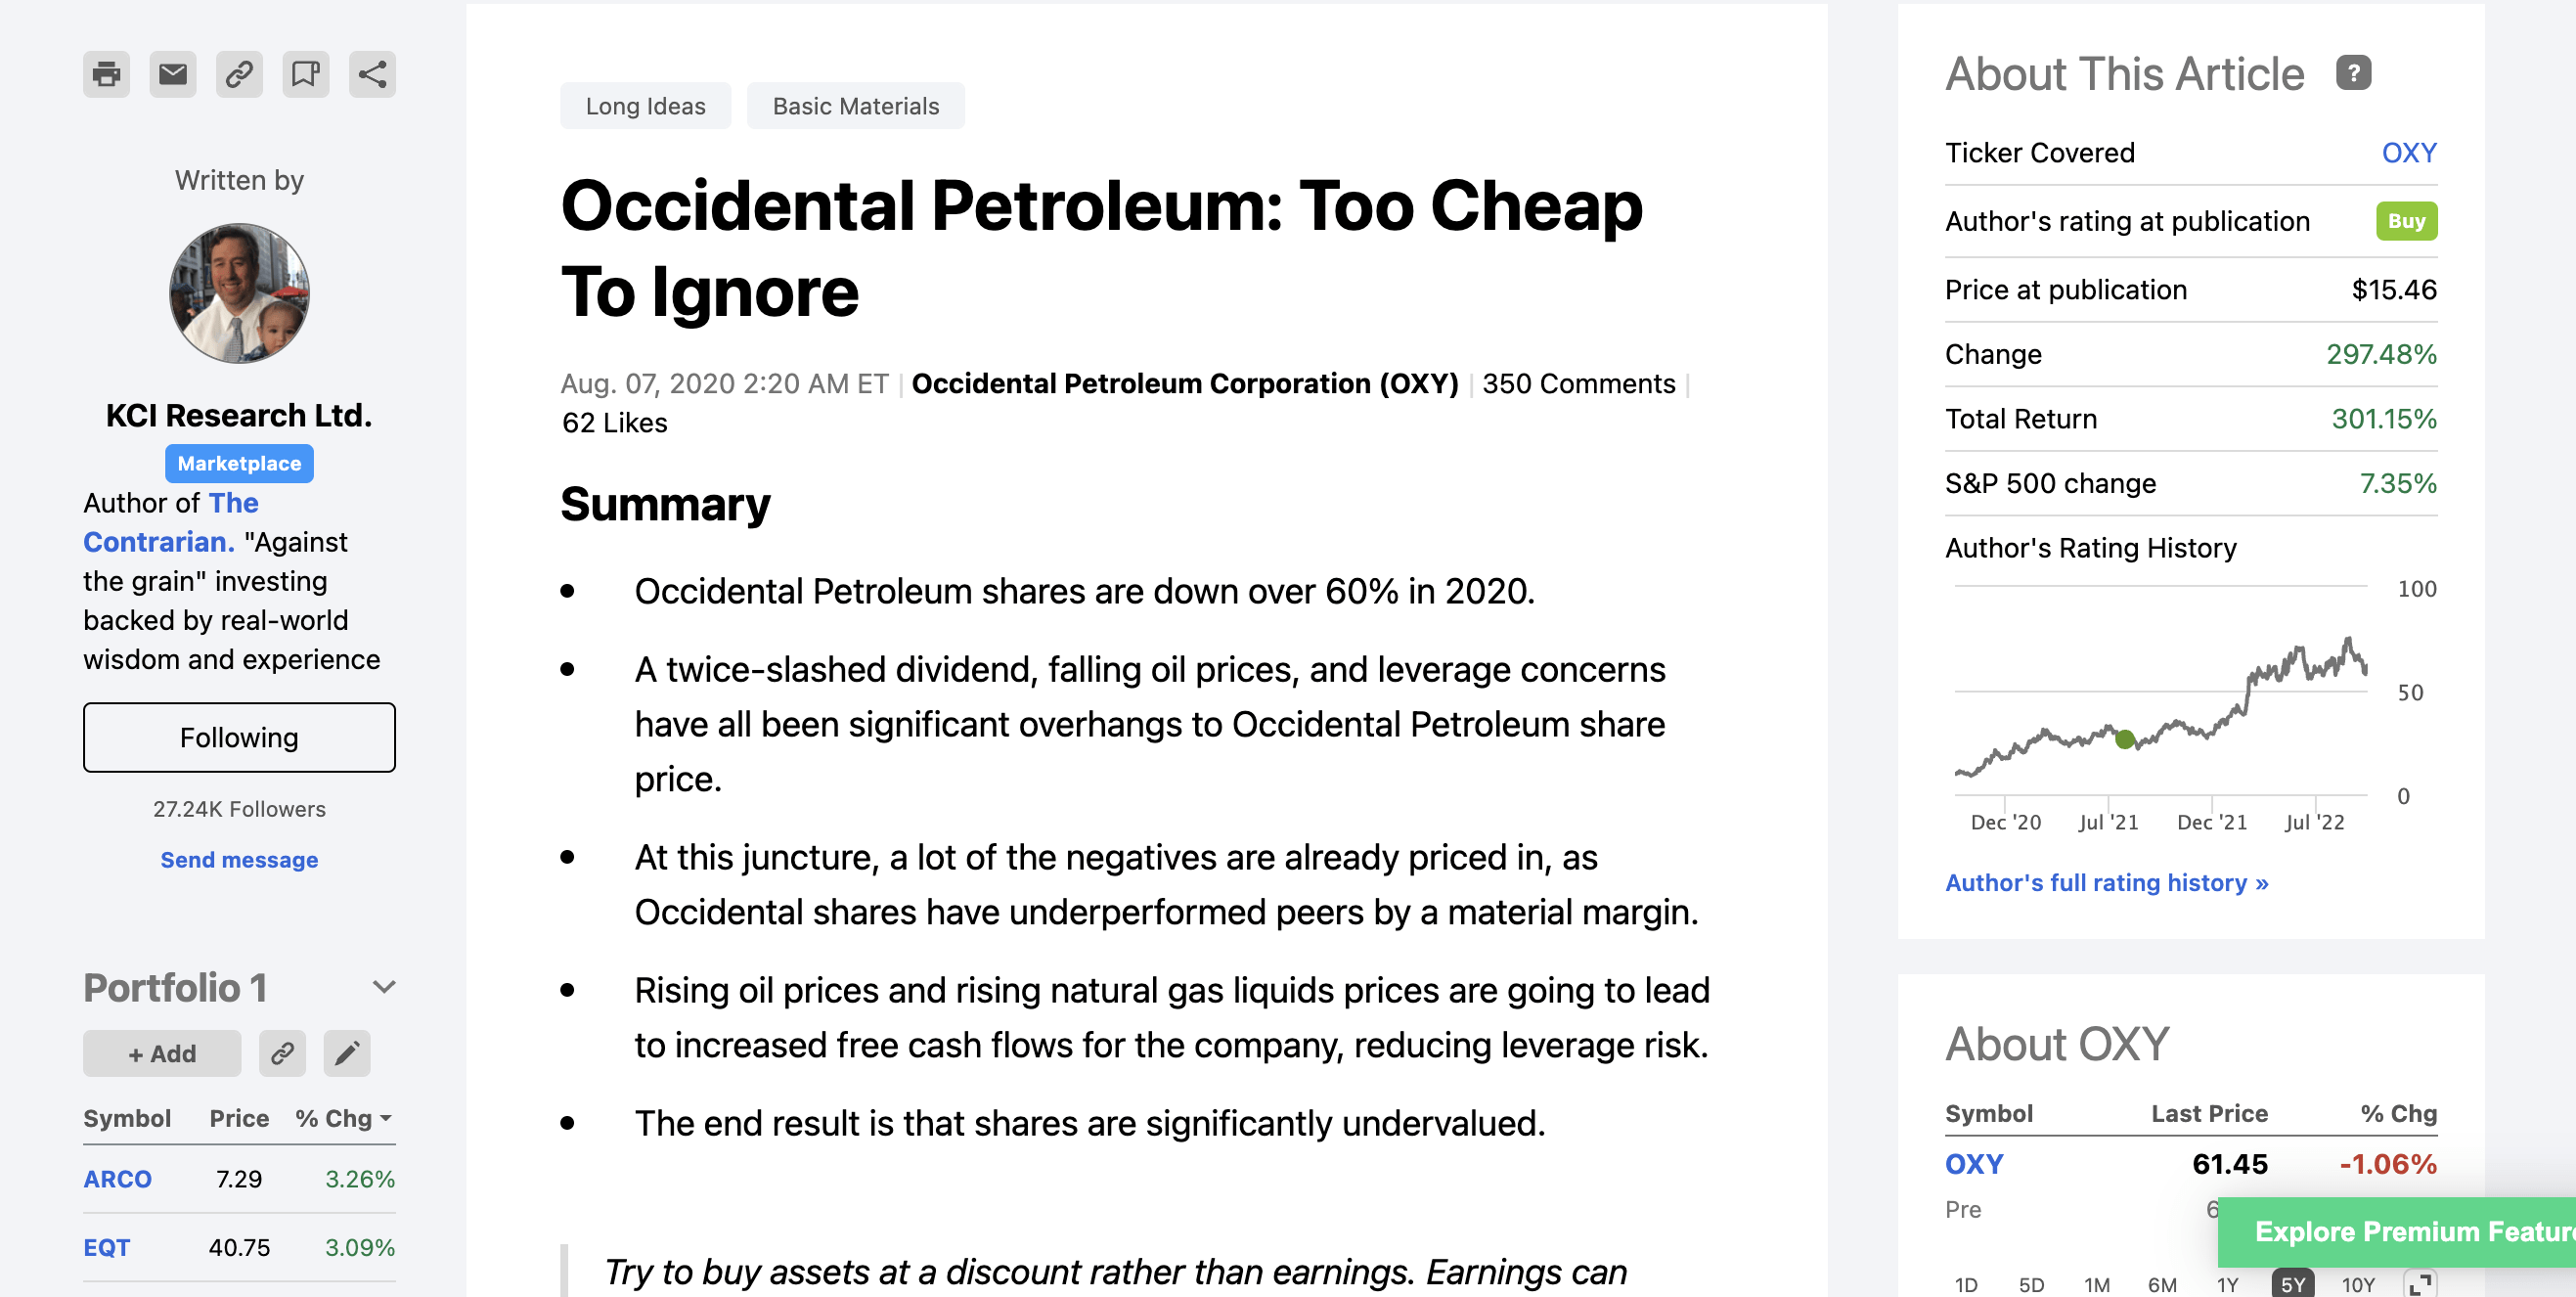
Specific to individual company calls in the energy sector that stand out, the pounding-the-table articles on Antero Resources (AR), which I labeled a generational buy on three occasions are at the top of the list, the sector-wide breakdown of what Exxon Mobil’s (XOM) exit from the Dow Jones Industrial Average (DJI) meant in 2020 was a personal favorite, and being ahead of the curve on Occidental Petroleum with the August 7th, 2020 article titled, “Occidental Petroleum: Too Cheap To Ignore“, have all been gratifying.
Screenshot Of Author’s August 7th, 2020 Article. (Author, Seeking Alpha)
Notably, Antero Resources and Occidental Petroleum are both exploration and production companies, and Exxon Mobil is primarily an exploration and production company too, though it is an integrated major. While all of these have, or have had stakes in pipelines and midstream companies, think Antero’s roughly 29% ownership in Antero Midstream (AM), the larger pure play pipeline companies have one major headwind, that is going to partially offset the secular tailwinds of an energy bull market.
Drilling deeper, pun intended, the larger pipeline companies are going to be held back by their absolute and relative debt levels, as these almost all carry very large debt loads. Thus, rising interest rates, and rising yield spreads are going to increase interest expenses, cost of capital, etc., and that is one reason, specifically the balance sheet, that I think Buffet has focused on the exploration and production companies in the energy sector. Investors would be wise to follow Buffett and Berkshire directly here, in my opinion, as I do think the gains in the energy sector are still going to be tilted on a relative basis towards production and exploration companies.
Long-Term Charts CVX, OXY, ENB, EPD, & ET
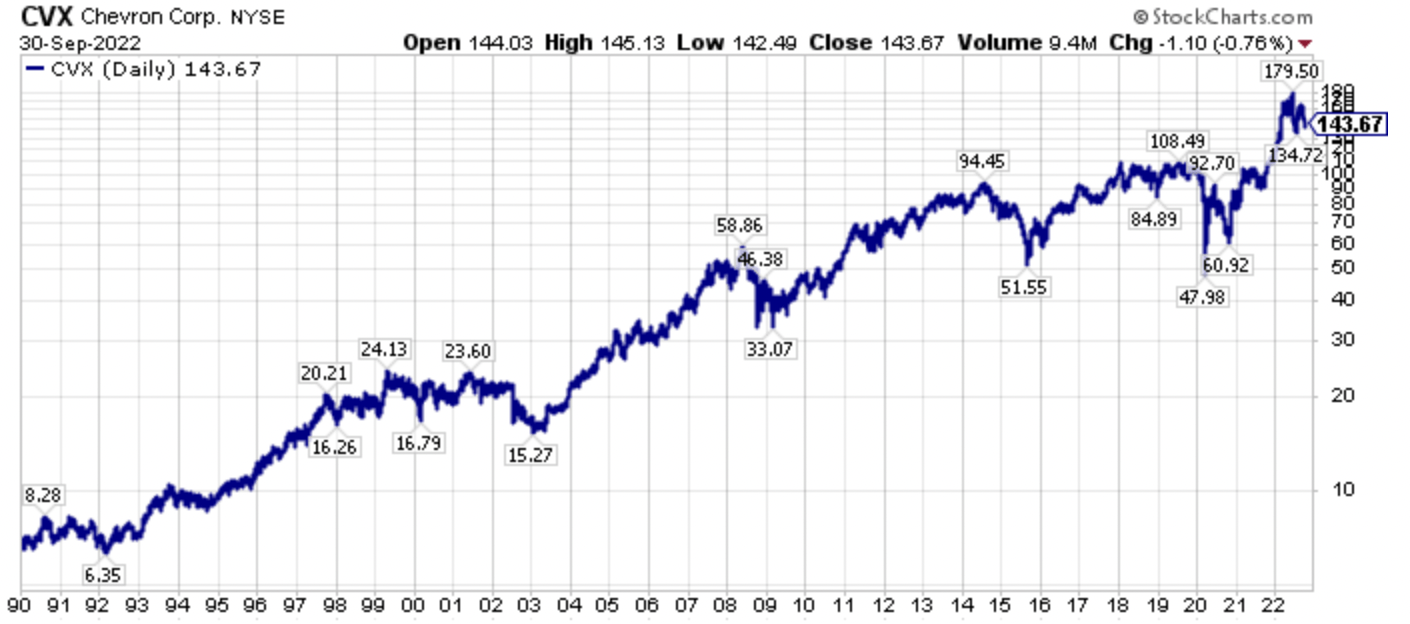
Long-term charts provide a nice perspective of where a stock has been, and where it could be going. The following are the 30-plus year charts of Chevron, Occidental Petroleum, Enbridge, Enterprise Products Partners, and Energy Transfer.
CVX Long-Term Price Chart (Author, StockCharts)
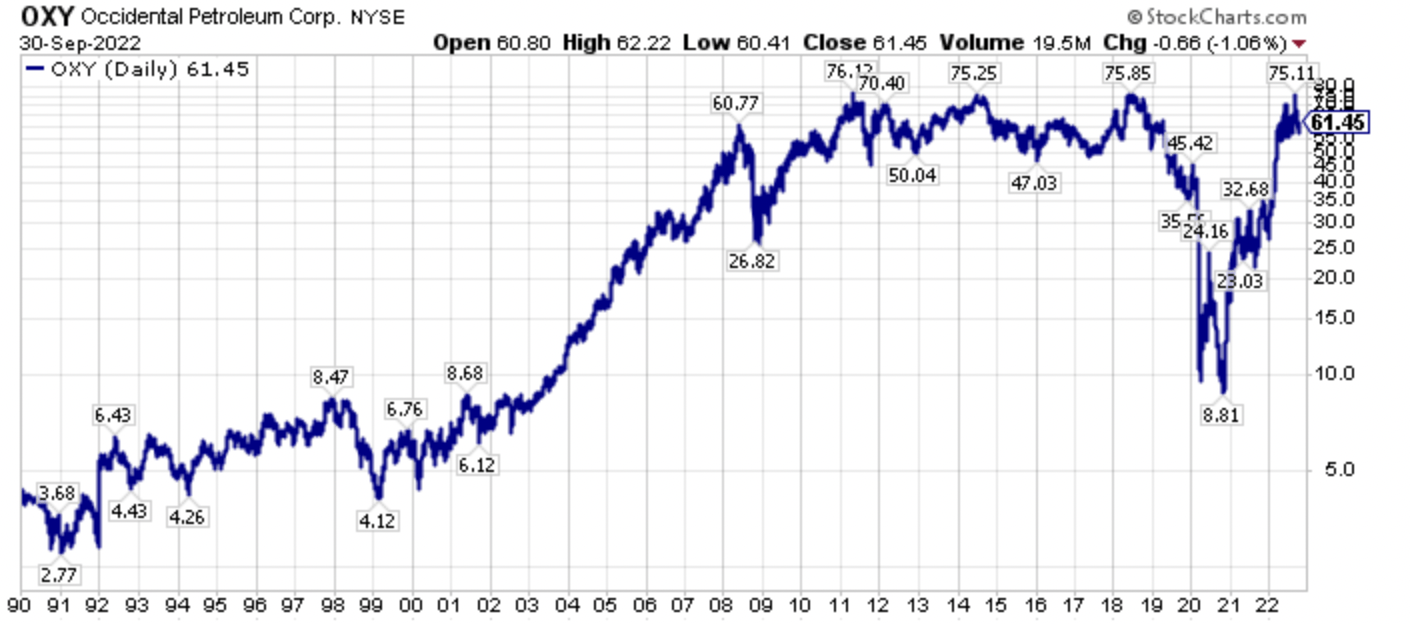
OXY Long-Term Price Chart (Author, StockCharts)
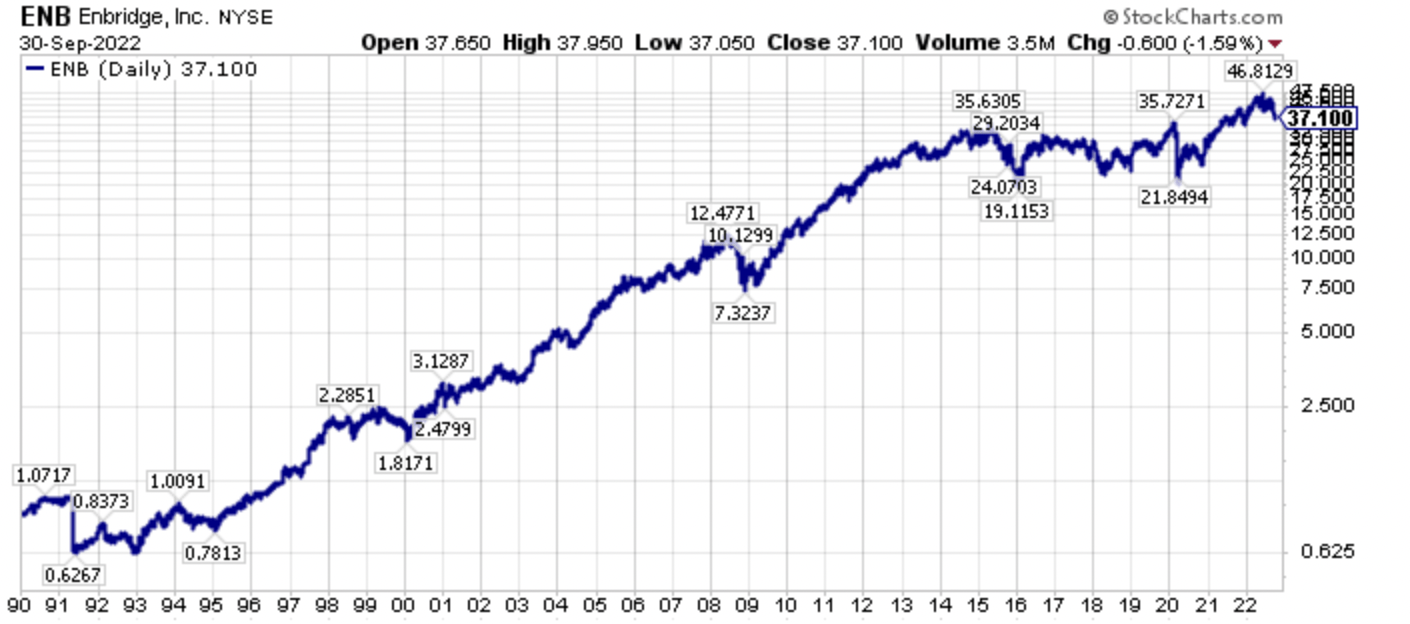
ENB Long-Term Price Chart (Author, Seeking Alpha)
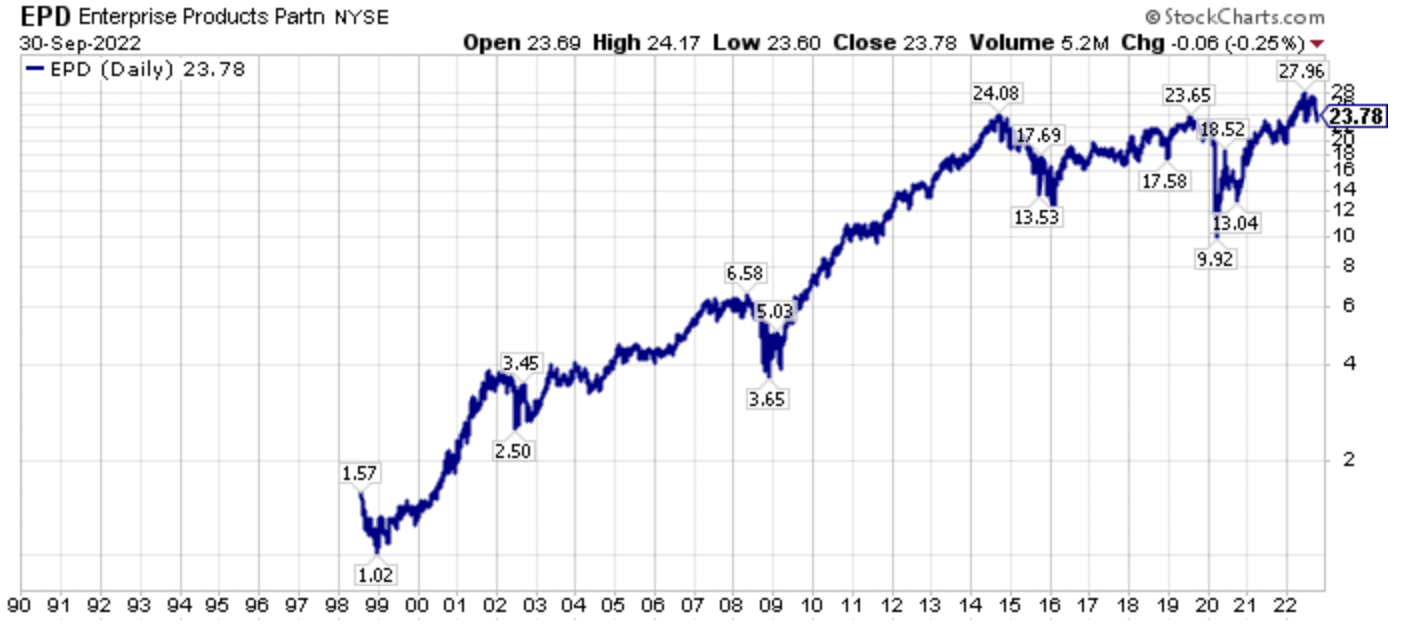
EPD Long-Term Price Chart (Author, StockCharts)
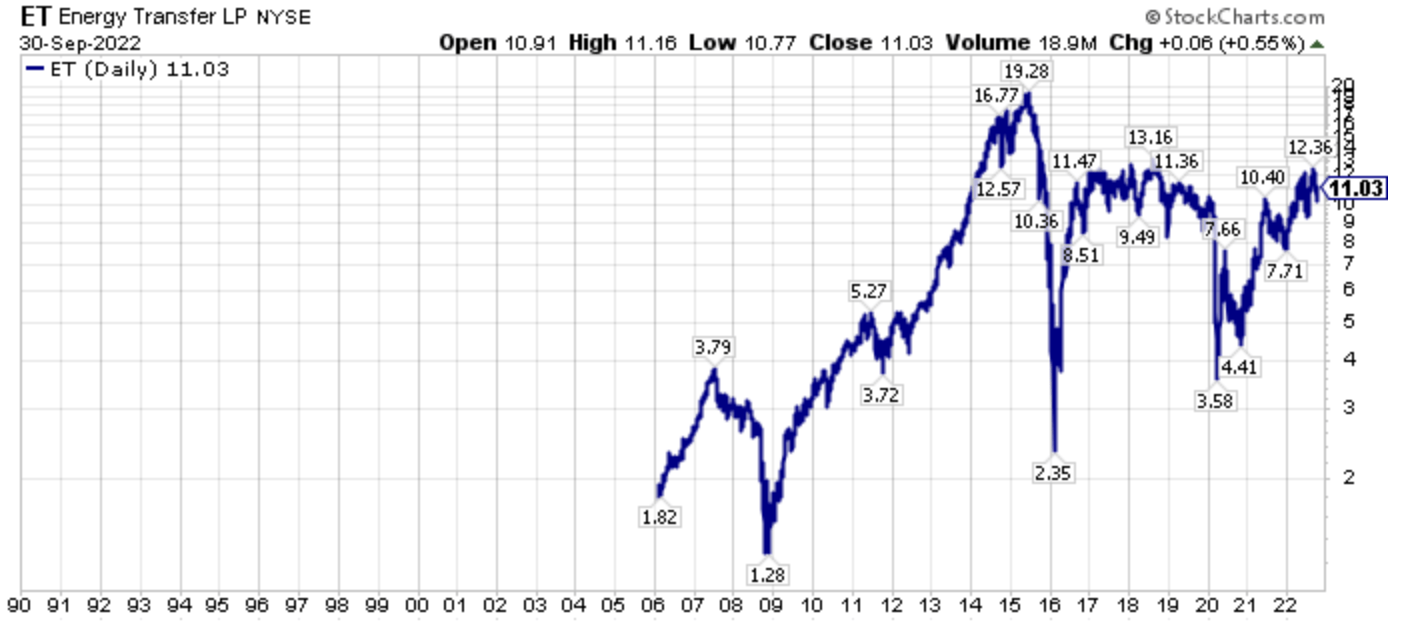
ET Long-Term Price Chart (Author, Seeking Alpha)
If you have had a long-term investment in CVX, OXY, ENB, EPD, or ET, they have done well over the past 15, 20, and 30-year plus time frames. Additionally, they all had peaks circa 2015 or so, and all have gone roughly side-ways on a total return basis since then, albeit with extreme volatility in both 2015-2016 and 2020-2022.
Short Term Charts CVX, OXY, ENB, EPD, & ET
The past year’s price action is also instructive, and is shown below for Chevron, Occidental Petroleum, Enbridge, Enterprise Products Partners, and Energy Transfer.
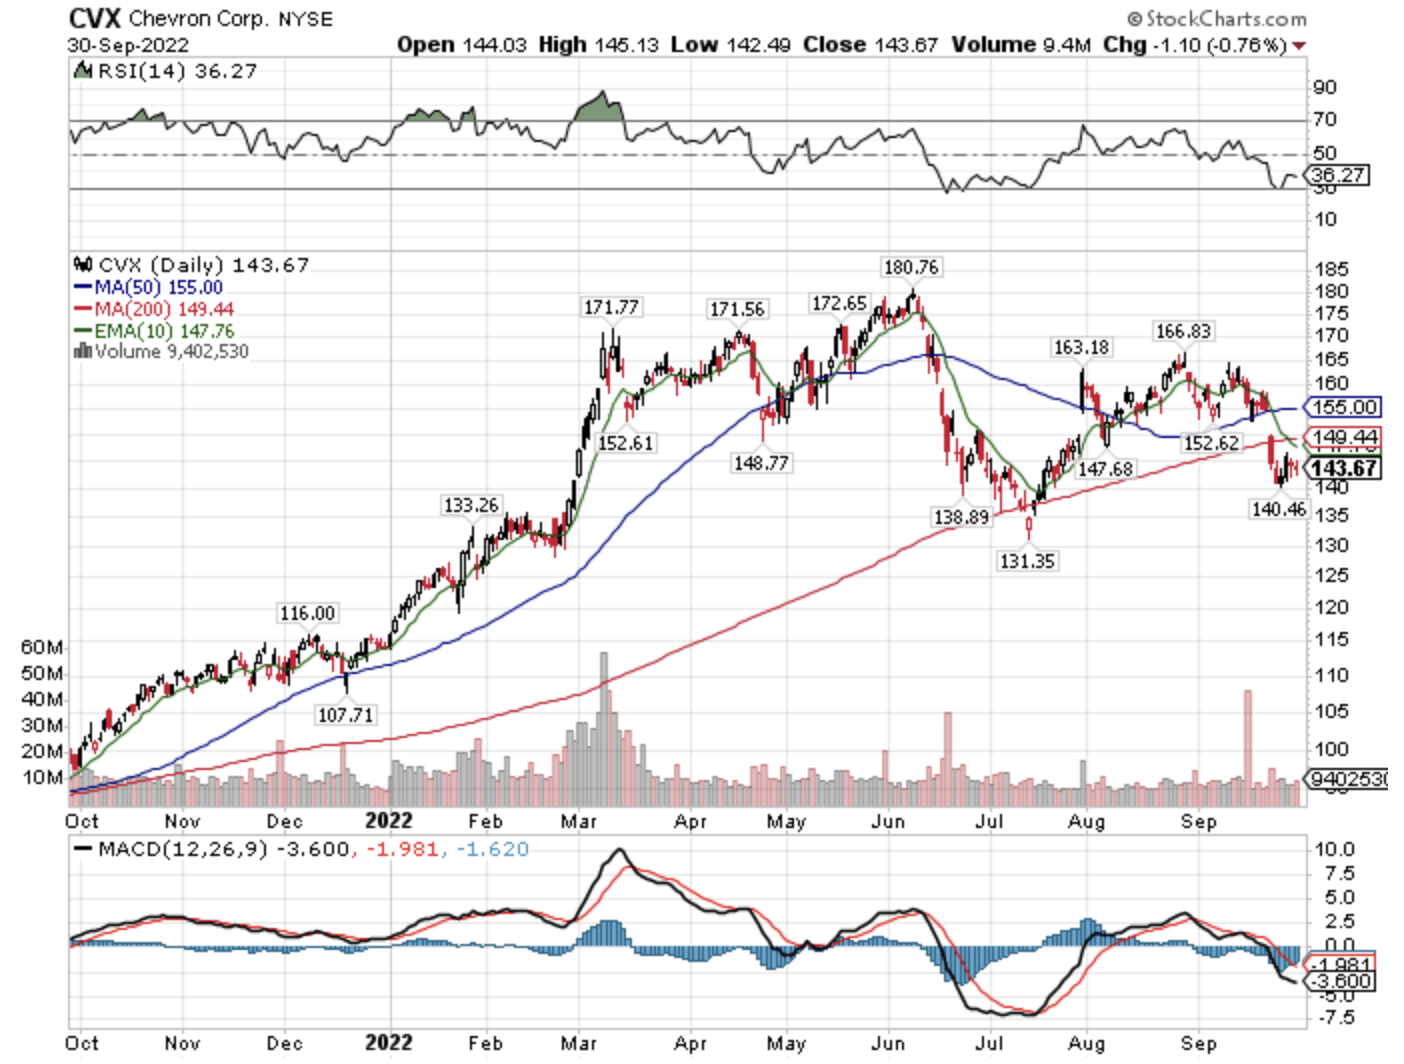
CVX One-Year Chart (Author, StockCharts)
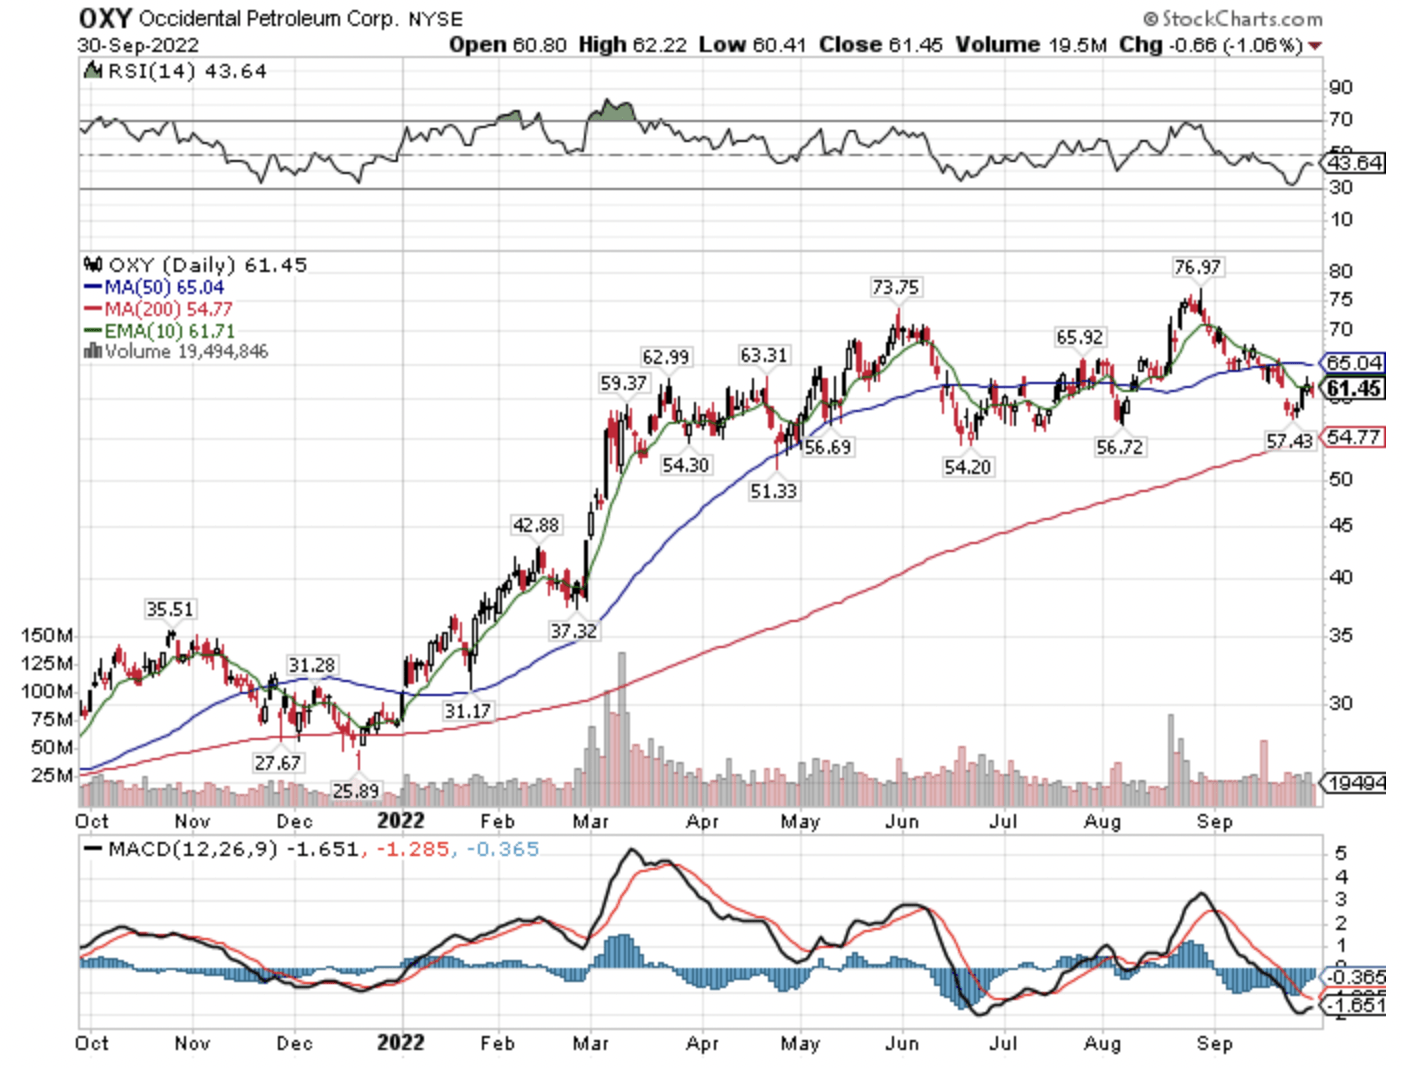
OXY One-Year Chart (Author, StockCharts)
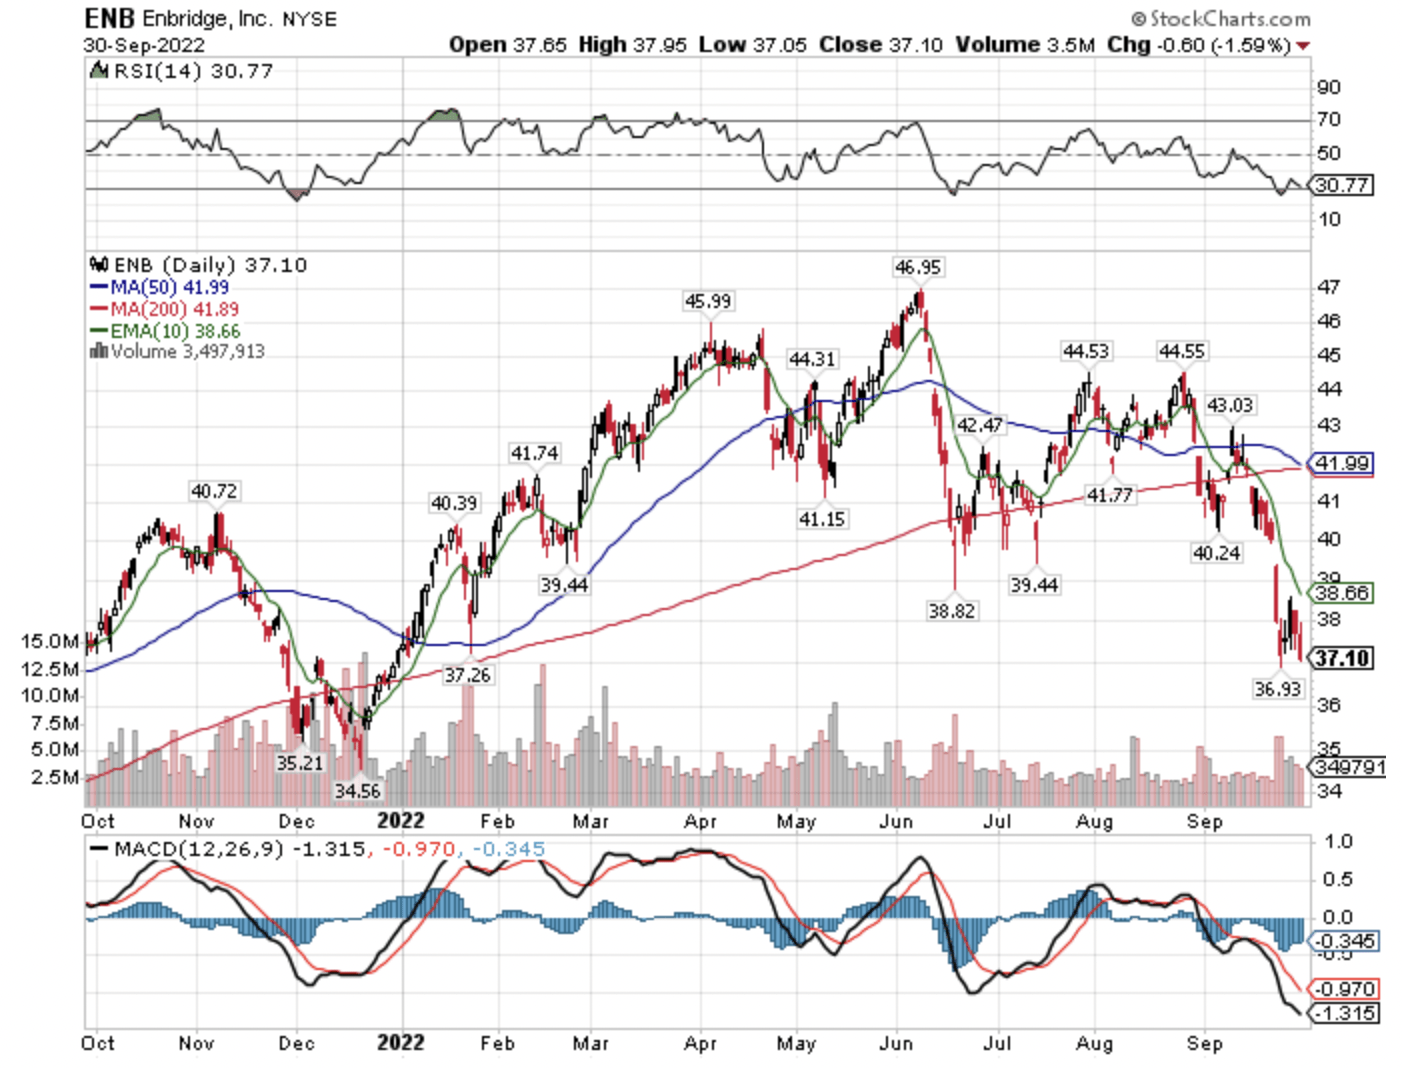
ENB One-Year Chart (Author, StockCharts)
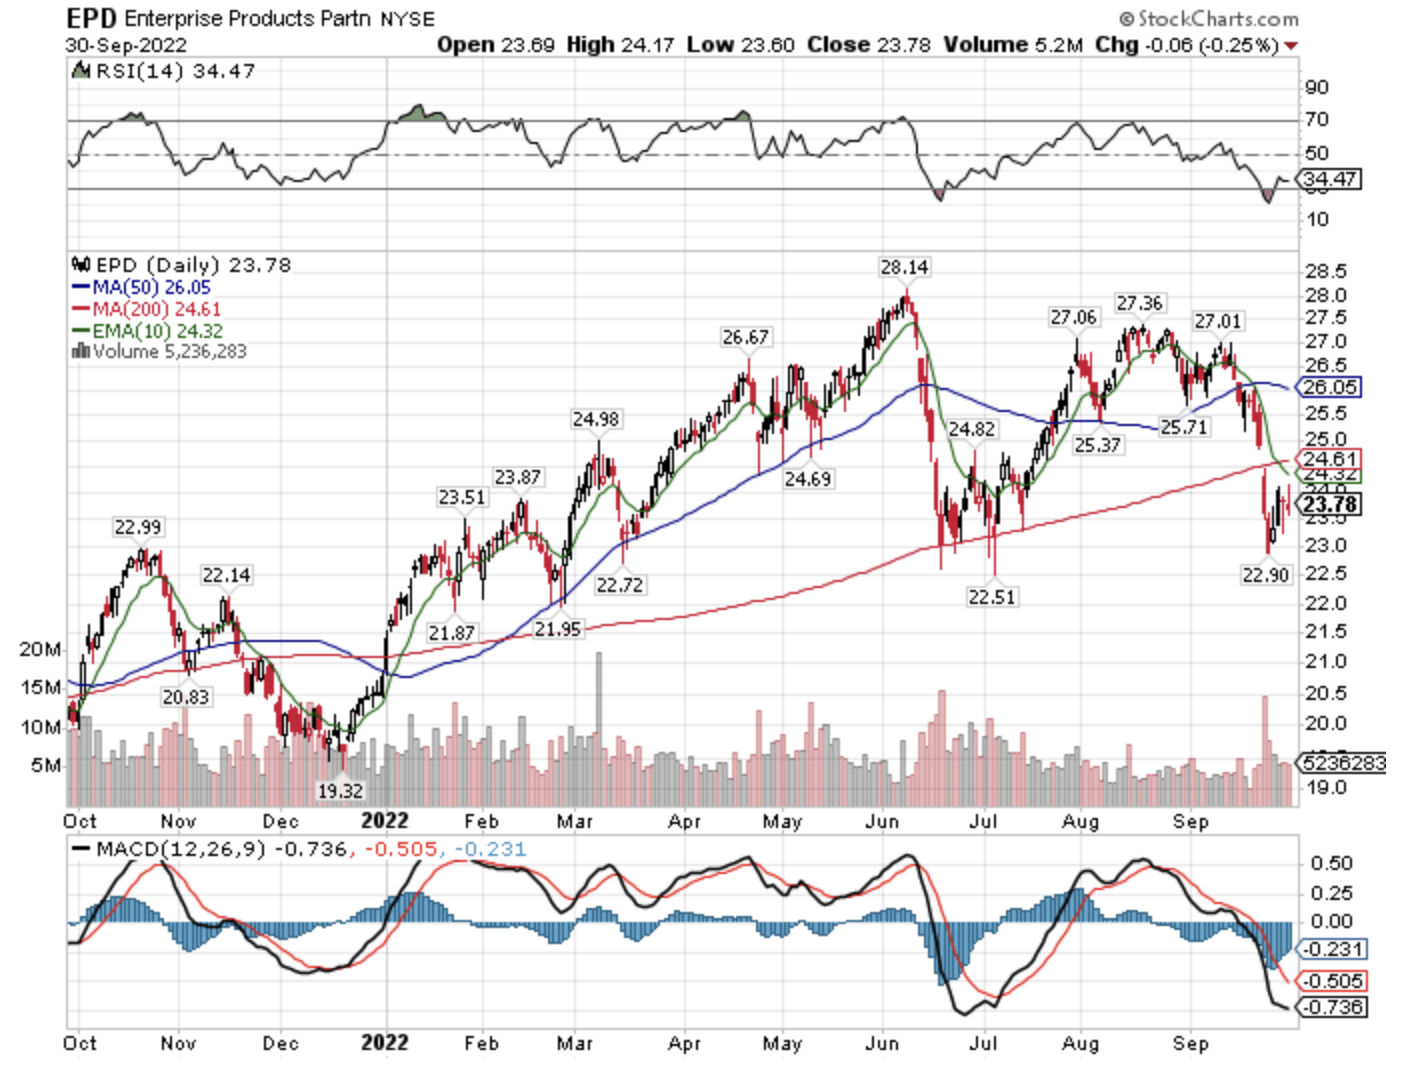
EPD One-Year Chart (Author, StockCharts)
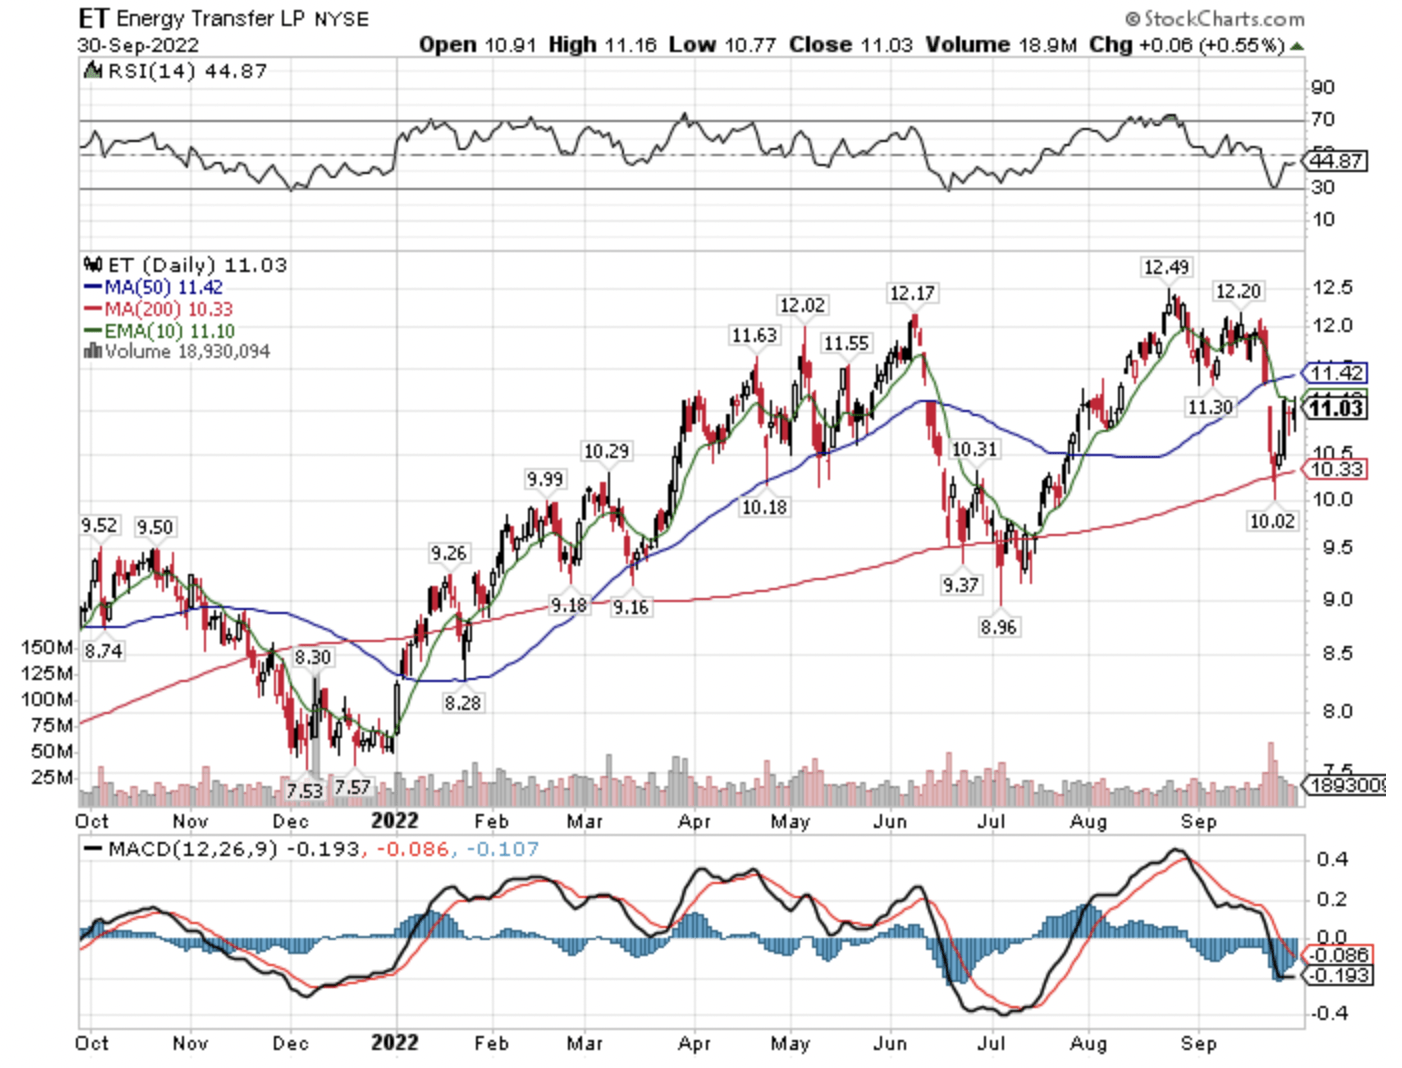
ET One-Year Chart (Author, StockCharts)
Looking at the two higher quality pipeline firms, specifically Enbridge, a dividend aristocrat, and Enterprise Products Partners, it is clear that the E&P’s, meaning Chevron, and Occidental Petroleum, have outperformed over the past year. Energy Transfer has been a bit of a turnaround story, and as its distribution has been raised (after being cut earlier), it has regained some of its momentum, however, again absolute and relative debt levels could be cumbersome going forward. This is particularly true if interest rates remain sticky, and if interest rate spreads remain sticky too, at or near today’s levels.
Debt Levels Absolute and Relative Will Be A Headwind
Here is quick overview of the five firms, with data as of Friday, September 30th’s closing price. Look what absolute and relative debt levels stand out.
Chevron – $281 billion market capitalization, $31 billion total debt, $25 billion net debt, $24 billion in free cash flow the trailing-twelve-months.
Occidental Petroleum – $57 billion market capitalization, $30 billion total debt, $26 billion net debt, $11 billion free cash flow the trailing-twelve months.
Enbridge – $76 billion market capitalization, $76 billion total debt, $75 billion net debt, $0.5 billion in free cash flow the trailing-twelve months.
Enterprise Products Partners – $52 billion market capitalization, $30 billion total debt, $27 billion net debt, $5 billion in free cash flow the trailing-twelve months.
Energy Transfer – $34 billion market capitalization, $51 billion total debt, $49 billion net debt, $3 billion in free cash flow the trailing-twelve months.
Looking at the above debt levels and free cash flow levels, it should be clear why Buffett and Berkshire are focusing on exploration and production companies for their inflation hedge instead of pipeline companies.
AM Versus ET
When I wrote my February 20th, 2020 article on Antero Midstream (AM) titled, “Antero Midstream Shares Are Significantly Undervalued Too“, there was a focus on absolute and relative debt levels. More specifically, within that article there was a direct comparison between the debt levels of Antero Midstream and Energy Transfer.
Snapshot Of Author’s February 20th, 2020 Article On AM (Author, Seeking Alpha)
Here was an excerpt from that early 2020 article.
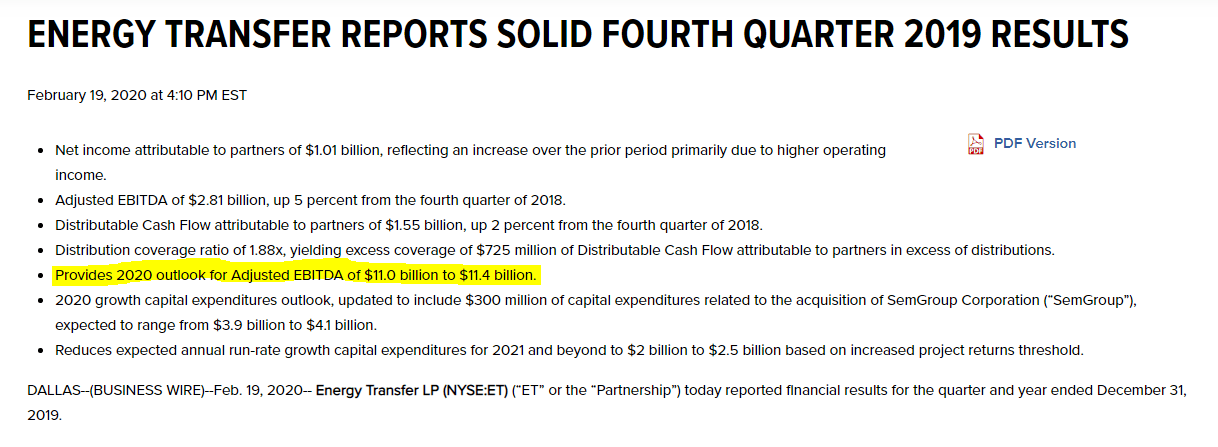
Specific to Energy Transfer, which I personally think is attractive as a yield-oriented investment and as a total return investment, I was satisfied with the Q4 2019 and full-year results. However, I think the 2020 outlook was underwhelming versus expectations, with the midpoint forecast for 2020 adjusted EBITDA, a range of $11.0 billion to $11.4 billion, essentially flat with 2019 adjusted EBITDA, which came in ahead of expectations at $11.2 billion.
Looking out to 2020, on a net debt to trailing twelve months pro forma adjusted EBITDA ratio, Energy Transfer is going to come in closer to 5.0, than 4.5, IMO, as the following snapshots from their earnings report and financial statements illustrate.
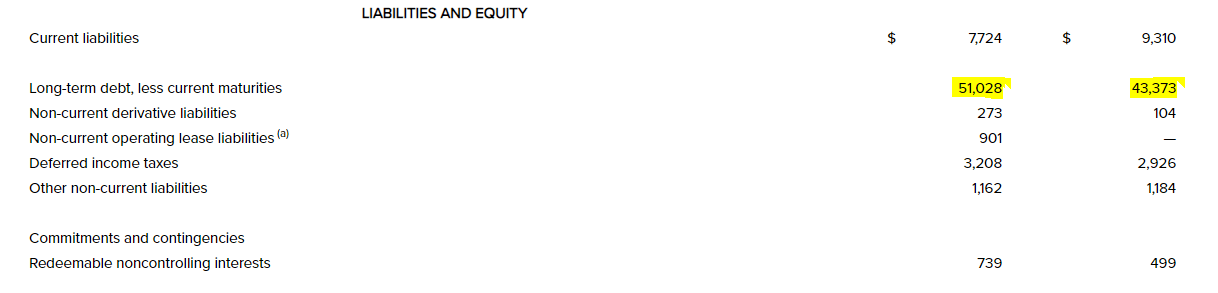
Energy Transfer Fourth Quarter 2019 Results Press Release
Energy Transfer Fourth Quarter 2019 Results Press Release
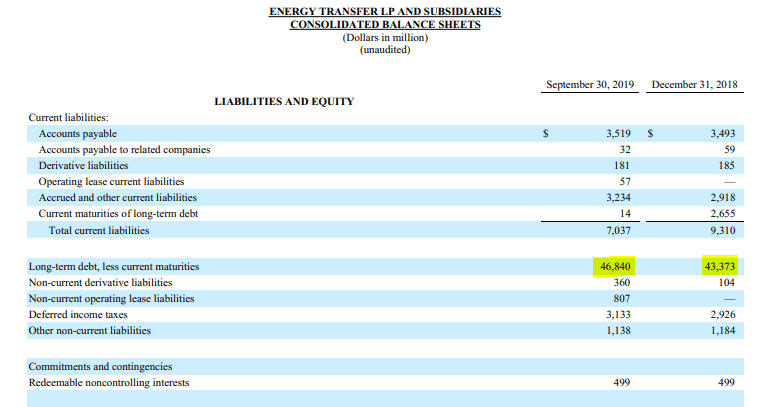
Looking at the above, long-term debt jumped to above $51 billion, increasing from $43.4 billion at the end of 2018, and from $46.8 billion at the end of September 30th, 2019.
The acquisition of SemGroup boosted debt, and it added important assets, however as the Q3 2019 10-Q shows above, ET’s long-term debt was already on the rise throughout 2019. With this projected to continue in 2020, the net debt to trailing twelve months pro forma adjusted EBITDA ratio could easily approach 5, especially if ET’s adjusted EBITDA comes in at the lower end of the projected range ($11.0 billion to $11.4 billion).
Conversely, Antero Midstream had a net debt to trailing twelve months pro forma adjusted EBITDA ratio of 3.5 at year-end 2019. For reference, Antero’s 2019 adjusted EBITDA was $830 million, highlighting the much smaller size compared to Energy Transfer, and this is forecast to grow in 2020, with an estimated range of $850 to $900 million.
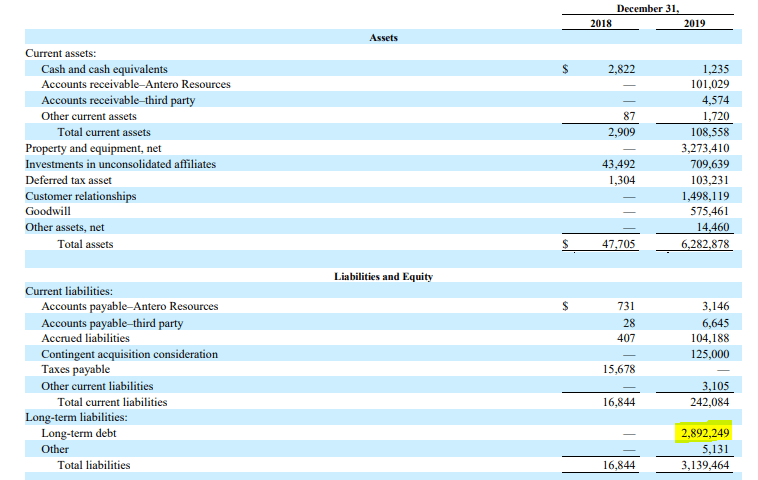
Antero Midstream Q4 & Full Year Results Press Release
With long-term debt projected to grow by $250 million in 2020, from a starting point of roughly $2.9 billion (my calculations) year-end 2020 debt at AM should total somewhere around $3.15 billion.
Antero Midstream Q4 & Full Year Results Press Release
With an adjusted EBITDA projected to range from $850 to $900 million (shown above), using the midpoint of the range, the projected 2020 net debt to trailing twelve months pro forma adjusted EBITDA ratio is 3.6 at year-end 2020. This is slightly higher than year-end 2019, however, it is still over a full turn below ET’s projected ratio, even in a best case scenario for ET for 2020.
In short, material advantage to AM over ET on the net debt ratios.
Obviously at the time I wrote that article in February of 2020, which was before the pandemic really got into a crescendo of fear, my premise was that Antero Midstream would outperform Energy Transfer because of the relative debt levels, the absolute debt levels, and for other reasons, like the underlying basin exposure.
With the benefit of hindsight that has indeed been true, as the following performance price chart of Antero Midstream, Energy Transfer, and the SPDR S&P 500 ETF (SPY) illustrates, from February 20th, 2020 through Friday, September 30th’s close.
Price Performance AM Versus ET Since February 20th, 2020 (Author, StockCharts)
Keep in mind that Antero Midstream’s shares were trading at $4.88 when I wrote this piece in late February, and they plunged in the aftermath of the pandemic hysteria, all the way to a low of $1.40.
Ultimately, the broader equity market, as measured by the SPDR S&P 500 ETF, made its lows on March 23rd, 2020, and then the rebound began. Since the February 20th, 2020 article, which again was prior to the real pandemic fear, SPY is only up 10.2% cumulatively, ET is up 10.2% too, and AM is higher by 165.9%, so clearly there has been significant outperformance in AM shares. A big part of this, in my opinion, is the better relative balance sheet, and ironically, that is still the case today.
Now, having said that, some of our biggest winners historically at The Contrarian have been when firms transfer enterprise value to equity from debt through debt pay-downs from organic free cash flow generation. For some of the midstream companies, however, it is hard to see how they will make significant progress on debt if their interest expense rises materially. This progress of debt reduction is something that will bear watching carefully in the years ahead. Obviously, if Energy Transfer can make headway in this regard, there is significant room for enterprise value to be transferred from debt to equity.
Closing Thoughts: If You Truly Want To Follow Buffett Into Energy, Buy The E&P’s
Many investors today follow in the footsteps of Warren Buffett, and when he buys a company like Coca Cola (KO) or Apple (AAPL), which I think is the last shoe to drop in this bear market, they follow verbatim into these names, and hold forever, or until Mr. Buffett exits. With the energy sector, many investors are aware that Buffett is buying exploration and production companies, however instead of following directly in his footsteps with Chevron, Occidental, or even in a related company like Exxon Mobil, or a smaller E&P, investors are trying to extrapolate Buffett’s focus on the energy sector into yield-oriented names, specifically the pipeline companies.
We think there is selective opportunity in the pipeline companies, however, the more attractive relative opportunity, in our opinion, is in the exploration and production companies, primarily because of their free cash flow generation, and their superior balance sheets. While many of these exploration and production companies have been discarded, including Exxon Mobil famously being removed from the Dow Jones Industrial average in August of 2020, which I have chronicled in a series of articles on Exxon, there has indeed been significant relative and absolute share price performance.
This is true particularly over the last two years, including Exxon, for example, significantly outperforming Salesforce (CRM), the company which replaced Exxon in the DJIA, and Exxon outperforming the SPDR S&P 500 ETF. Less discussed is the fact that Exxon has strongly outperformed both Enbridge, and Enterprise Product Partners over this time frame too, as the chart below illustrates.
XOM CRM SPY ENB EPD Price Performance Since August Of 2020. (Author, StockCharts)
This relative outperformance of exploration and production companies, represented by Exxon Mobil in the chart above, both versus the broader market, and versus the energy pipeline companies is likely to continue going forward. Superior free cash flow generation for the exploration and production companies will lead to accretive stock buybacks and dividend raises, attracting investors, and creating a virtuous loop of secular stock price outperformance.
Wrapping up, quietly at first, and now more rapidly as the capital rotation has broadened in scope, we have seen a passing of the baton of market leadership. Once the last safe-haven equities succumb to the broader bear market selling pressures, perhaps this passing of the baton will be clearer, however market phase changes like this take a long time, meaning years in the process. Will there be ebbs and flows to this process? Unequivocally yes, meaning expect relative pullbacks as investors reposition, and investors of all stripes try to re-orientate around the inflection point that is occurring real time.
At this juncture, most investors are simply just becoming aware of the ongoing bear market and the leadership transition that has been taking place since the broader equity markets bottomed in March of 2020, though relative and absolute price action this year in 2022 has certainly opened more eyes.
Recognizing this changing backdrop after years of study, including being too early, I have been pounding the table on the extremely out-of-favor commodity equities for several years now, and I still think we’re in the early innings of what will be a longer-term secular bull market, albeit with significant volatility. Personally, I think we will supersede the capital rotation that took place from growth-to-value during 2000-2007, which also coincided with the last secular commodity bull market which ran from 2000-2008.
Investors skittish of commodity equities should research cast aside financials as they also will benefit from a renewed steepening of the yield curve, which is probably forthcoming following the eventual Fed pause and pivot, whenever it occurs, which could even be a year out at this juncture.
Understanding the bigger picture, then having an understanding of the bottoms-up fundamentals has been the key to outperformance, and this is a path that has not been easy with those participating confirming this reality. However, the road less taken is sometimes the better one, and I firmly believe that today, as traditional stocks, bonds, and real estate continue to offer very poor starting valuations, though they’re better than at the start of this year where I opined it was better to be in cash for the next seven years, and very poor projected future real returns from today’s price levels. More specifically, the out-of-favor assets and asset classes, including commodities and commodity equities and out-of-favor specific securities, are where the historic opportunity has been, and that’s where it still stands, from my perspective.
Please note that foreign exchange and other leveraged trading involves significant risk of loss. It is not suitable for all investors and you should make sure you understand the risks involved, seeking independent advice if necessary.


Be the first to comment