

Darren415
This article was first released to Systematic Income subscribers and free trials on July 23.
Welcome to another installment of our BDC Market Weekly Review, where we discuss market activity in the Business Development Company (“BDC”) sector from both the bottom-up – highlighting individual news and events – as well as the top-down – providing an overview of the broader market.
We also try to add some historical context as well as relevant themes that look to be driving the market or that investors ought to be mindful of. This update covers the period through the third week of July.
Be sure to check out our other Weeklies – covering the CEF as well as the preferreds/baby bond markets for perspectives across the broader income space. Also, have a look at our primer of the BDC sector, with a focus on how it compares to credit CEFs.
Market Action
It was a great week for the BDC sector with an average gain of about 2.5%. Only two BDCs – BXSL and FCRD – fell, though BXSL was down only marginally. Over July, the sector is up around 4.5%.
Systematic Income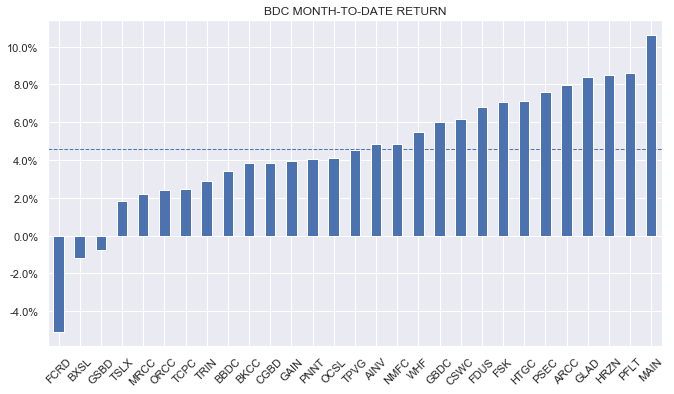
A look at year-to-date performance tells us that underperformers this year form a kind of barbell – strong historic performers whose valuation in 2021 ran ahead of their ability to generate value (TPVG, CSWC, HRZN) as well as poorly performing value traps (FCRD, MRCC). BXSL is, arguably, a special case which has been under pressure from lock-up expiries.
Systematic Income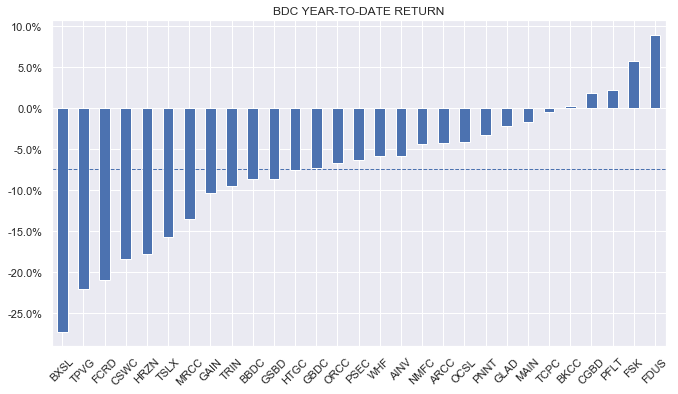
The chart below shows that BXSL volume has correlated with the occurrence of lock-up expirations. Volume has recently subsided, suggesting the supply / demand picture is relatively clean for the stock going forward.
Systematic Income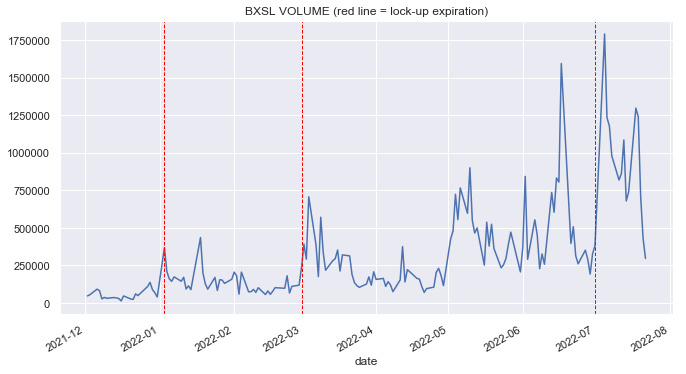
The sector has continued to dig itself out of its hole and is about a third of the way there from this year’s drawdown trough. We don’t expect a full recovery very soon, however, as NAVs should move lower and valuations are likely to remain subdued on the back of the expectation in corporate margin compression, increase in costs, a more subdued aggregate demand picture and a rise in non-accruals.
Systematic Income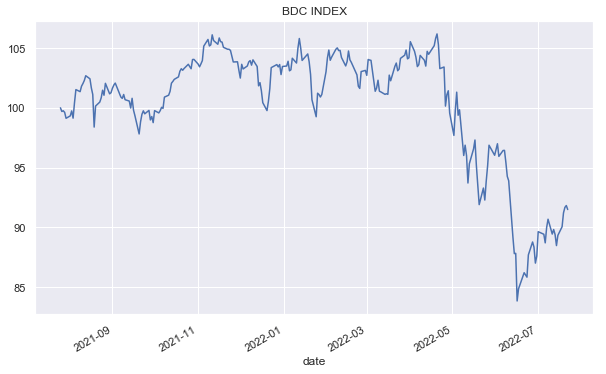
The sector valuation remains below its longer-term average. Part of this valuation gap will be closed by the very likely drop in Q2 NAVs.
Systematic Income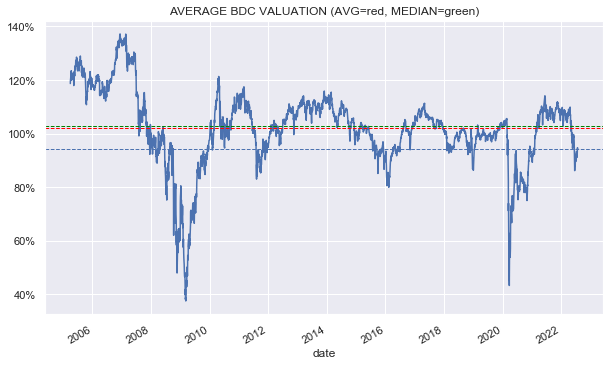
Market Themes
Investors are keenly anticipating Q2 earnings from the BDC sector. A key metric investors are looking forward to is the change in book value or NAV of individual BDCs as well as the trend across the broader sector.
In addition to portfolio quality, non-accruals, changes in income and others, a key driver of NAV is the broader valuation of loan assets, particularly, as observed in the publicly traded market. We know this is a key driver of NAVs because management themselves allude to it when discussing NAV.
One very interesting pattern of the traded market is that while high-yield corporate bond credit spreads over Q1 were very well contained, they widened significantly over Q2. Specifically, Q1 saw spreads move from 3.1% to 3.43% while Q2 saw spreads move from 3.43% to 5.87%.
If we look at the chart below marking out the boundaries of Q2 we can see that Q1 got pretty lucky with spreads which retraced much of their earlier widening shortly before the end of Q1. At the same time Q2 got unlucky at both ends – as spreads were momentarily tight at the end of Q1 and very wide at the end of Q2. Specifically, credit spreads have retraced a full 1% since the end of Q2.
FRED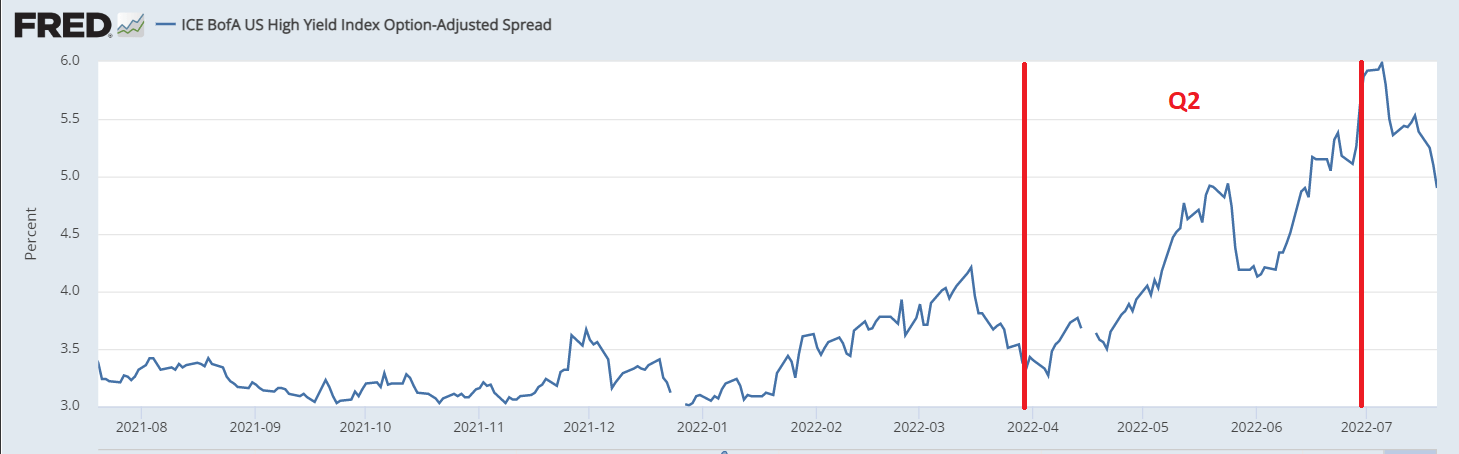
What this suggests is that Q2 NAVs and NAV changes will arguably be “worse than they are” because they reflect this bad timing luck at both ends of the quarter. Relative to today’s credit spreads, Q2 NAVs will be marginally lower than if they were marked-to-market today because of the significant rally in credit since the end of the quarter. Similarly, today’s “marked-to-market” valuations (i.e. price / NAV ratios) are also marginally lower than those based on Q2 numbers (because market-to-market valuations should be higher). Investors should take this timing impact into account if they target valuations in their entry / exit levels.
Market Commentary
BDC Trinity Capital (TRIN) is issuing an additional $50m of their 7% 2025 bonds a bit below par. Apparently this is to repay their KeyBank credit facility. Both the timing and the decision to switch out of a credit facility is a bit odd.
First, the company’s credit facility outstanding amount is already low in the sector relative to their bonds outstanding at about 26% as of Q1 and this will obviously move even lower. In other words, the proportion of bonds in the TRIN capital structure is already high by sector standards and will move even higher.
Secondly, the bond carries a higher interest rate. TRIN pays 1M Libor + 2.85-3.25% on the credit facility versus a bit over 7% yield on the tap. 1M Libor is currently around 2.2% but will likely peak at around 3.5% if the Fed Funds forecast consensus is correct. This would leave the credit facility still cheaper than the bond at the likely Fed Funds peak though not by much.
Interestingly, the bond was originally issued in early 2020 so the company, in effect, entirely missed the chance to lock in a low level of interest by doing nothing between Q2-2020 and the end of 2021. Many other BDCs termed out their bonds in 2021 when it was advantageous to do it.
A potential saving grace is that the bond is callable (without make-whole) in early 2023. However, it seems unlikely we get significantly lower yields from here on (which would make it economic to refinance the bond) since it would require both a drop in Treasury yields as well as credit spreads. This goldilocks scenario would require both inflation to start subsiding earlier than expected and for recession to be off the table – a big ask.
An important factor not to be overlooked is that in a flat yield curve environment, credit facilities do not offer as much savings in interest expense versus bonds as they would in a “normal” i.e. upward-sloping yield curve environment. TRIN may just be looking at the balance of additional covenants on the credit facility and weighing it up against a slightly smaller interest expense and judging that they would rather pay a slightly higher interest rate without having to worry about additional covenants, particularly in a period where the economy may be entering a recession.
There was a question about CION Investment Corp. (CION) on the service given its large discount. The first thing to mention is it’s hard to have a lot of conviction in the CION team as their track record is not super clear. They were sub-advised by Apollo for a while and then they bought a CS BDC. Hard to know how much value the CION team itself adds or subtracts.
Two, their NAV is about 3% below their 2019 level whereas most BDCs are above their 2019 levels which suggests some weakness in going over the COVID period and if that’s true then they might struggle over the coming recession as well. Their 3Y total NAV return (very approximate as it doesn’t include compounding) seems to be on the order of 4% or so which is less than half of the BDC sector so the performance here is not amazing. If that’s correct the discount is not large enough at current levels.
Stance And Takeaways
After adding to our allocation on the way lower we haven’t chased the recent rally in BDCs for a couple of reasons. First, we expect the upcoming earnings season, and particularly the very likely falls in NAVs, to lead to additional volatility. And two, we expect a marginal deterioration in portfolio quality and a rise in non-accruals due to a slowdown in aggregate demand and pressure on corporate margins. According to Q1 management commentary a decent chunk of BDC portfolio companies will see their interest coverage move below 1x over the coming months, making it more challenging to service debt.
That said, for investors who have been on the sidelines for most of the year we like the Golub BDC (GBDC) trading at a 8.73% dividend yield and a 90% valuation on Q1 NAV as well as the Oaktree Specialty Lending Corp (OCSL) trading at a 9.7% dividend yield and a 94% valuation on Q1 NAV. These BDCs carry higher-quality / lower-equity portfolios which we expect to be more resilient in the medium term.
Be the first to comment