

rlesyk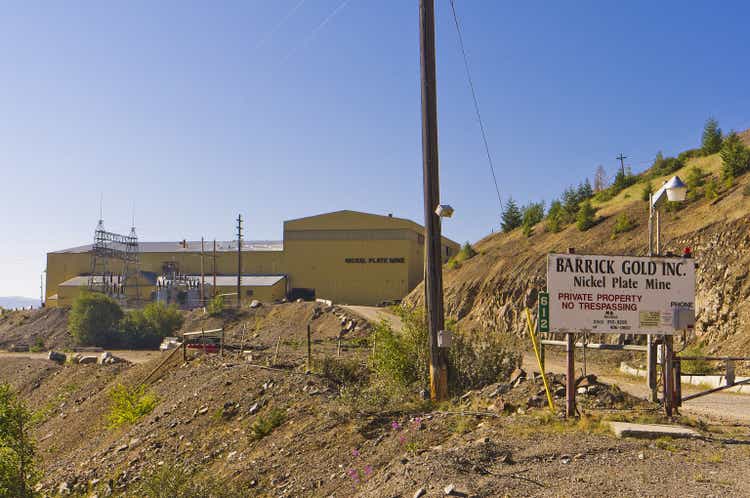
Introduction
Barrick Gold Corporation is one of the most prominent gold players in the world, based out of Toronto, Canada. As 90% of Barrick’s revenue is based on the play of gold, they operate various mines worldwide.
It has ownership interests in producing gold mines in Argentina, Canada, Côte d’Ivoire, the Democratic Republic of Congo, the Dominican Republic, Mali, Tanzania, and the United States. The company also has ownership interests in producing copper mines in Chile, Saudi Arabia, Zambia and various other projects throughout the Americas and Africa.
Fundamentals are somewhat historically weak.
Some say ESG outperforms the average, but Barrick Gold is rated to beat, but this stock is still underweight compared to the standard metric of the S&P 500.
Warnings:
No consistent historical earnings per share
NOT consistently high return on equity
NOT consistently high return on assets
Technical Analysis Shows Unpredictable Moves
ReverseMACD
The entire month of September has been sideways with false positives and potential unprofitable orders. It is tough to say how long this condition will stay in place, but the value of gold has declined since March. While the stock markets are struggling this year, the value of gold should be skyrocketing theoretically as the global economy weakens. Over the years, there has been a proven indirect relationship between the value of gold and the S&P 500 stock market.
Prices in recent years show this relationship has been distorted for various macroeconomic reasons, including Western countries’ booming national debt.
reverse MACD GOLD (trading platform)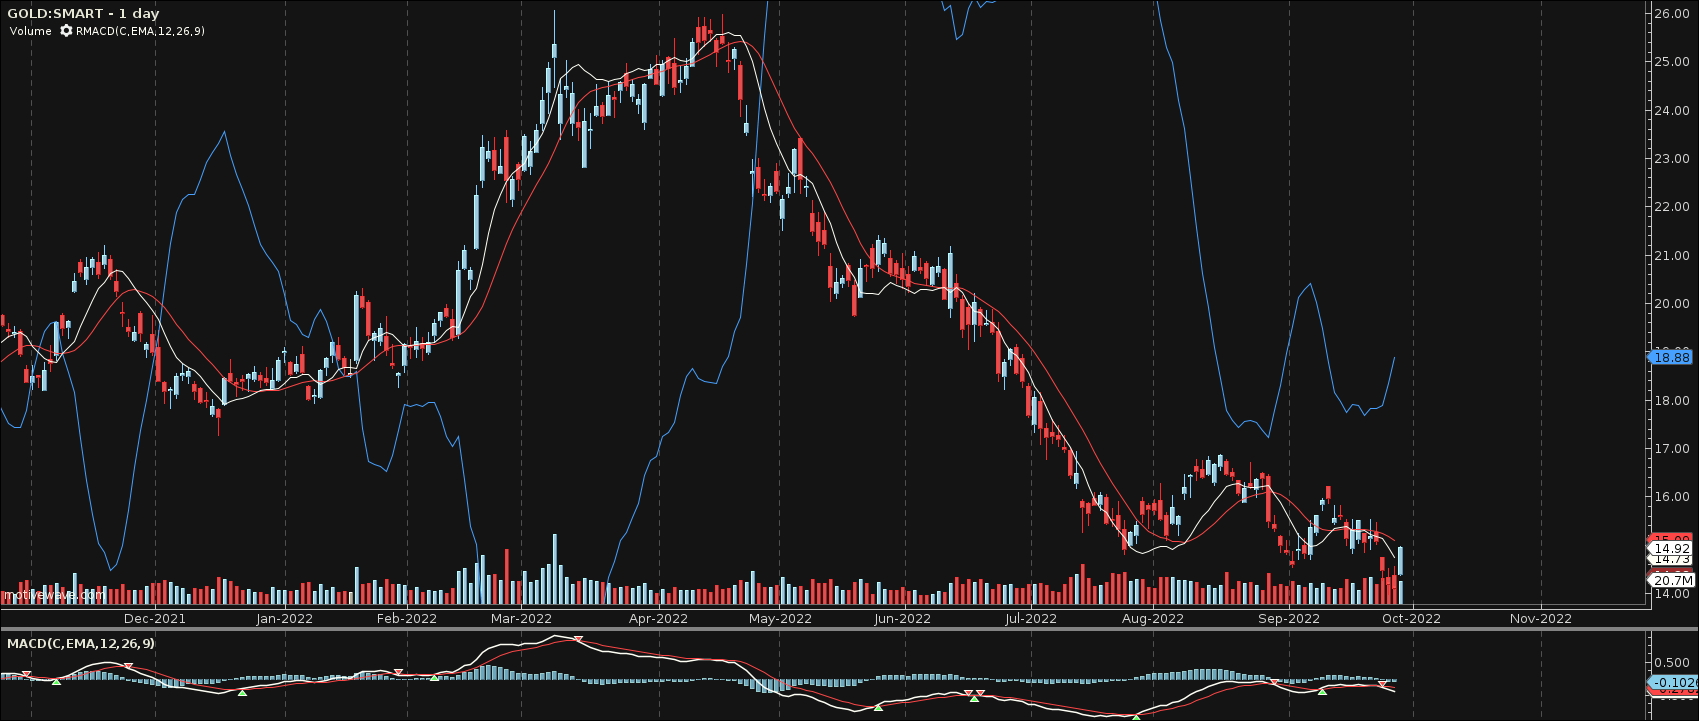
Reverse MACD (from a trading platform)
Ichimoku Cloud
This indicator shows that GOLD’s price (Barrick) could continue to drop in the near term.
GOLD Ichimoku cloud (trading platform)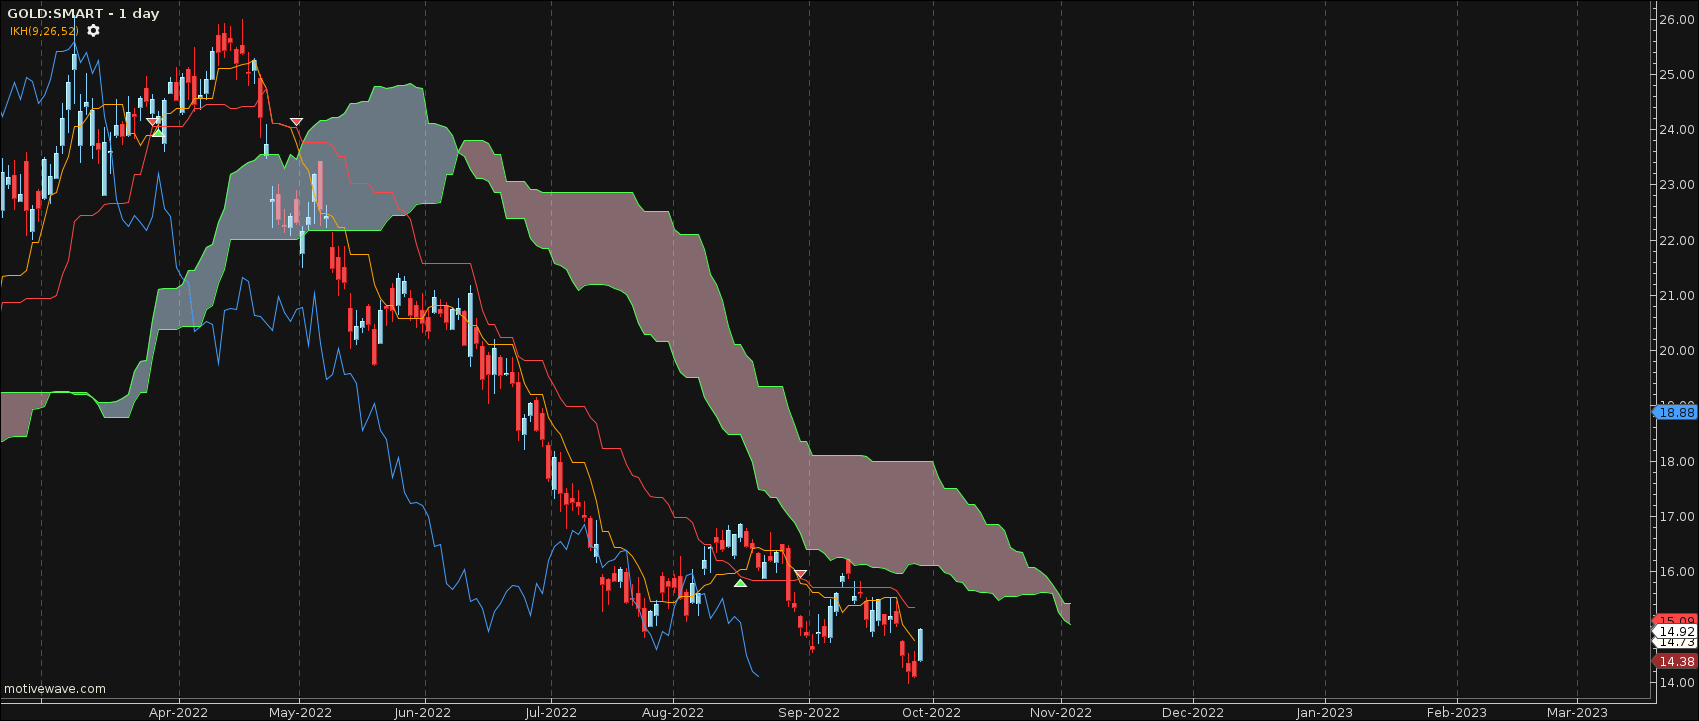
Ichimoku cloud (from a platform)
What does Hurst Cycle reveal?
The Cyan line shows that the end of the cycle is near, but the price is flat. GOLD could spike a little but will most likely continue with a decline, as hinted by the Ichimoku cloud. The only condition preventing this is if there is a significant negative catalyst in the market which could crash it. If so, the value of gold can finally prove itself as a safe-haven asset as world markets drastically decline.
GOLD Hurst Cycle (Trading platform)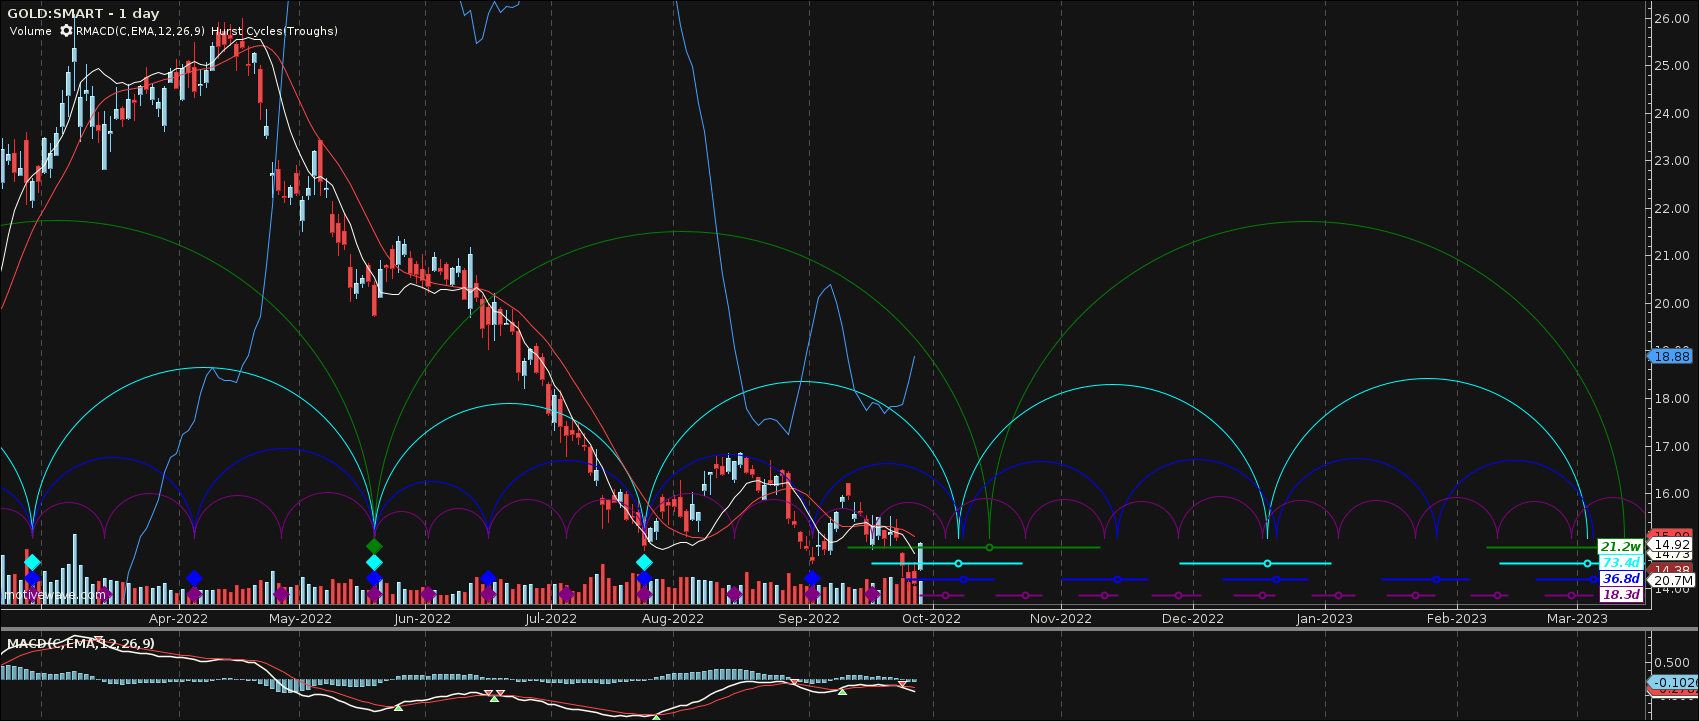
Hurst cycle (from a platform)
Risks Show Others Have Underweight on GOLD
As hinted, the current price is half its yearly high back in March. This article re-affirms this.
This was the stock’s second consecutive day of losses. Barrick Gold Corp. closed C$13.84 below its 52-week high (C$33.50), which the company achieved on March 8th.
Barrick Gold Corp. stock falls Friday, underperforms market – MarketWatch.
This article explains that the value of gold is undervalued as the Federal Reserve has been hiking interest rates recently.
90% of Barrick’s revenue remains the stock price’s primary lever. Gold appears to be out of favor as an investment avenue, with prices down by almost 7% year-to-date and by about 16% from recent highs seen in March, trading at about $1,670 per ounce. Central banks worldwide have been raising interest rates amid a need to fight soaring inflation.
Soaring Yields Hit Barrick Gold Stock. Is This An Opportunity To Buy? (forbes.com)
I can somewhat agree with this quoted view above. It seems the value of gold could be unpredictable over the next month, but downward pressure could continue as significant stock indices push down. Western debt and higher interest rates are not helping. I stick with what the Ichimoku Cloud is forecasting, as hinted above.
One factor not mentioned is the indirect relationship between the US DXY index and the value of gold. This also impacts the cost of Barrick as well. Therefore, the performance of gold and Barrick might improve when the price of the USA dollar index starts to decline.
gold vs DXY from MacroTrends (MacroTrends)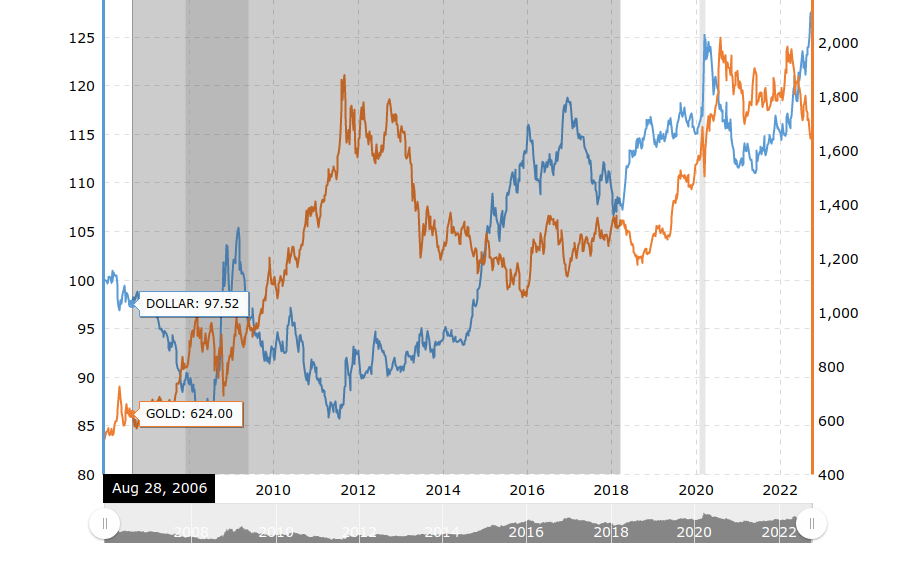
Blue is the price of the dollar index; orange is the value of gold.
Conclusion
It is hard to set a call for GOLD, but it seems for now that higher probability shows a continuous decline of Barrick’s share price. One must closely watch the US dollar index price, as the indirect relationship in the past chart shows. As for now, it seems that technical indicators are pointing down to make GOLD a sell based on the substantial declines since the Federal Reserve has been aggressively raising interest rates. Predictably, this will strengthen the US dollar, killing the value of gold.
Be the first to comment