

Karina Caverdos – Chernenko/iStock via Getty Images
In turbulent periods for stocks, like the last six months, equity investing can feel intimidating. The combination of unexpected volatility, falling sentiment, and deteriorating economic indicators, on top of political and geopolitical instability, can produce confusing signals; and many may seek to shift their investments to safer assets while the storms pass. For seasoned investors, this intimidating feeling is not new – periods of market declines have happened many times in the past.
For those who started investing in public equities in the past decade, the bear market of 2022 is the first prolonged decline they have experienced. Regardless of investment experience, equity bear markets are never easy to stomach, not just due to losses, but also because every time a bear market occurs there is a feeling that “this time it is different” and there is no sight or certainty of recovery. And then, of course, every subsequent bull run seems so obvious, but only in hindsight. And, based on history, a new bull market will inevitably happen after the current bear market ends.
After several years of exceptional performance, many of the Baron Funds have underperformed so far this year. We are growth investors, and growth stocks have fallen steeply out of favor in recent months, as we will discuss in detail in this letter. But we are also long-term investors, with a multi-year horizon, and, throughout the 40-year history of our business, we have learned that exceptional long-term returns cannot be achieved without going through painful periods of losses from time to time.
Of course, we wish we could foresee and potentially avoid such periods, but we know that market timing is a futile effort, and we don’t engage in it. If history is any guide, we can expect that the stock market will eventually recover and reach new highs. Although the U.S. economy is facing some challenges today, we firmly believe that it will continue to grow and prosper over the long term, which gives us confidence and optimism in the long-term outlook for our investments.
After reaching an all-time high on the first trading day of 2022, the S&P 500 Index declined 20.5% by the end of the first half of the year. As many commentators remarked, this is the worst performance for the index in any calendar year’s first half since 1970. This six-month period is one of few such periods that have occurred since 1926, as the chart below shows.
The S&P 500 Index Has Rarely Declined So Significantly During Historical Six-Month Periods
S&P 500 Index – Rolling Six Month Total Returns (1/31/1926 – 6/30/2022, monthly data)
Sources: FactSet, Morningstar Direct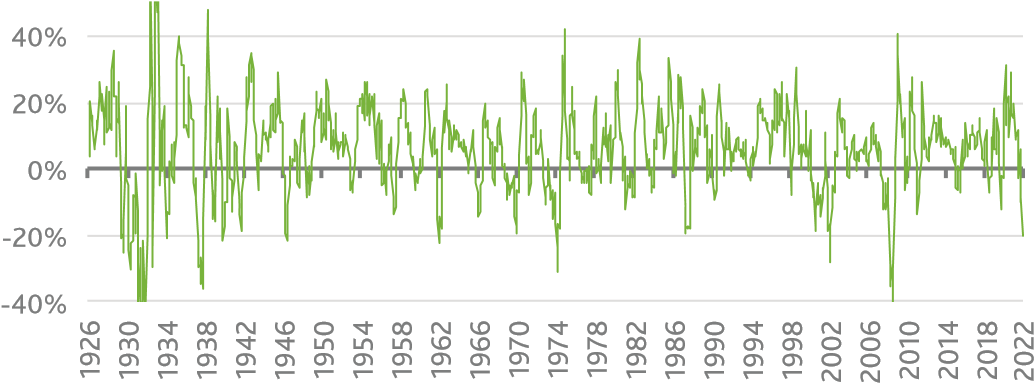
| Notes: Prior to 12/31/1987, the total return data was calculated using the Ibbotson® U.S. Large Stock Index due to lack of total return data for the S&P 500 Index. Past performance is not indicative of future results. The index is unmanaged. Index performance is not Fund performance; one cannot invest directly into an index. |
The last time equities declined so steeply and so rapidly was during the financial crisis of 2007/08, a period marked by a rare systemic collapse, financial institutions failures, and extreme levels of fear, panic, and volatility. The backdrop of this year’s decline bears almost no resemblance to the 2007/08 period.
Yes, volatility has been elevated*, but at levels less than half of the highest achieved during the financial crisis or even during the COVID panic of 2020. Yes, consumer and investor sentiment have reached multi-decade lows, but there is hardly any feeling of panic. This is likely because the bear market of 2022 has been a function of several converging events, rather than a single highly unusual event.
The main drivers of the market decline this year have been inflation, which reached a 40-year high; the Fed’s decisions to end the easing cycle and begin aggressively raising interest rates in order to tame inflation; and the continued global supply-chain difficulties, which were exacerbated by the war in Ukraine.
These developments negatively affected the outlook for stocks, increasing the uncertainty around growth rates and resulting in higher discount rates, particularly for smaller and higher growth companies. Value stocks, which are often considered less risky by investors, and which largely benefitted from the post-pandemic reopening, were less affected.
As the table on the next page shows, the Russell 2000 Growth Index, a popular proxy for the performance of small-cap growth companies, declined 42% from its peak in 2021 to its trough in 2022, which is nearly twice the drawdown of the S&P 500 Index.
The tech-heavy Nasdaq Composite Index, which contains fast-growing stocks across the market cap spectrum, declined 33.4% from peak to trough, a significantly worse performance compared to that of the S&P 500 Index. Stocks in less stable, less developed markets, as measured by the MSCI Emerging Markets Index, also meaningfully underperformed the broader international MSCI ACWI ex USA Index.
Smaller and Higher Growth Stocks Declined Most in the Recent Downturn
Performance of Popular Equity Indexes Since their Respective Peaks
|
Index Name |
All Time High Date |
2022 Low Date |
All time high to ‘22 Low –Total Return |
All time high to 6/30/22 – Total Return |
|
S&P 500 Index |
1/3/2022 |
6/16/2022 |
–23.0% |
–20.5% |
|
Russell 3000 Growth Index |
11/21/2021 |
6/16/2022 |
–32.1% |
–29.1% |
|
Russell 2000 Growth Index |
2/9/2021 |
6/16/2022 |
–42.0% |
–38.3% |
|
Nasdaq Composite Index |
11/19/2021 |
6/16/2022 |
–33.4% |
–30.4% |
|
MSCI ACWI ex. USA Index |
6/15/2021 |
6/18/2022 |
–21.8% |
–21.1% |
|
MSCI EM Index |
2/17/2021 |
5/12/2022 |
–29.8% |
–28.3% |
|
Source: FactSet. Note: Past performance is not indicative of future results. The indexes are unmanaged. Index performance is not Fund performance; one cannot invest directly into an index. |
While the decline in stocks was broad-based, growth stocks experienced steeper declines. As the chart on the left below shows, growth stocks performed worse than value stocks across almost all market cap segments. The chart on the top right shows that in certain sectors, like Communication Services and Financials, growth performed notably worse than value. In other sectors, growth and value declined similarly – an indication that some of the sell-off may have been indiscriminate of company quality. The biggest declines occurred in the more cyclical or higher growth sectors – Consumer Discretionary, Communication Services, Information Technology (IT), and Health Care.
Growth Stocks Declined More than Value Stocks in Most Sectors and Market Cap Segments
Median Price Change of Growth and Value Stocks by Market Capitalization

Median Price Change of Growth and Value Stocks by GICS Sector
Sources: FactSet, Baron Capital.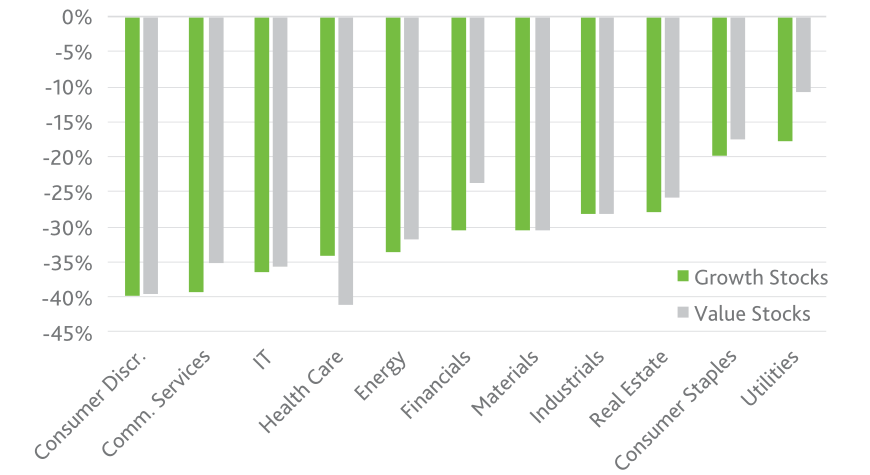
| Notes: Growth stocks are represented by the constituents of the Russell 3000 Growth Index and value stocks are represented by the constituents of the Russell 3000 Value Index. The median returns in the charts above were calculated using the stock price changes of the constituents in each index as of 6/30/2022 from their individual peaks over the period 12/31/2021-6/30/2022 until 6/30/2022. Individual stock peaks have occurred on different dates during the period. Past performance is not indicative of future results. |
After several years of strong outperformance for growth stocks, especially throughout the pandemic, it is not unexpected that value is now outperforming. While no one knows what direction the market may take in the short term, history has shown that stocks tend to move in cycles. This is particularly valid for the relative performance of value and growth stocks. During periods of favorable economic conditions and high optimism, investors typically favor high-growth investments.
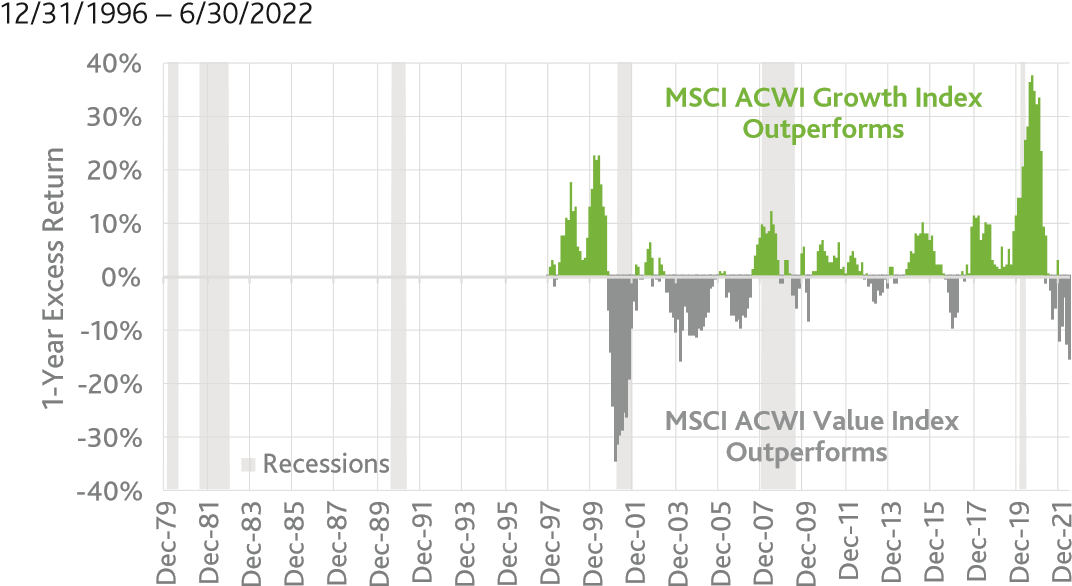
When economic prospects and sentiment deteriorate, investors tend to gravitate to safer investments with lower expected returns, like value stocks. The charts below show the long-term cyclicality in the relative one-year performance of growth and value stocks for U.S. small-caps[1], U.S. mid/large caps[2], and global equities3.
Growth and Value Stocks Perform in Cycles: 1-Year Rolling Excess Returns
U.S. Small Cap Equities
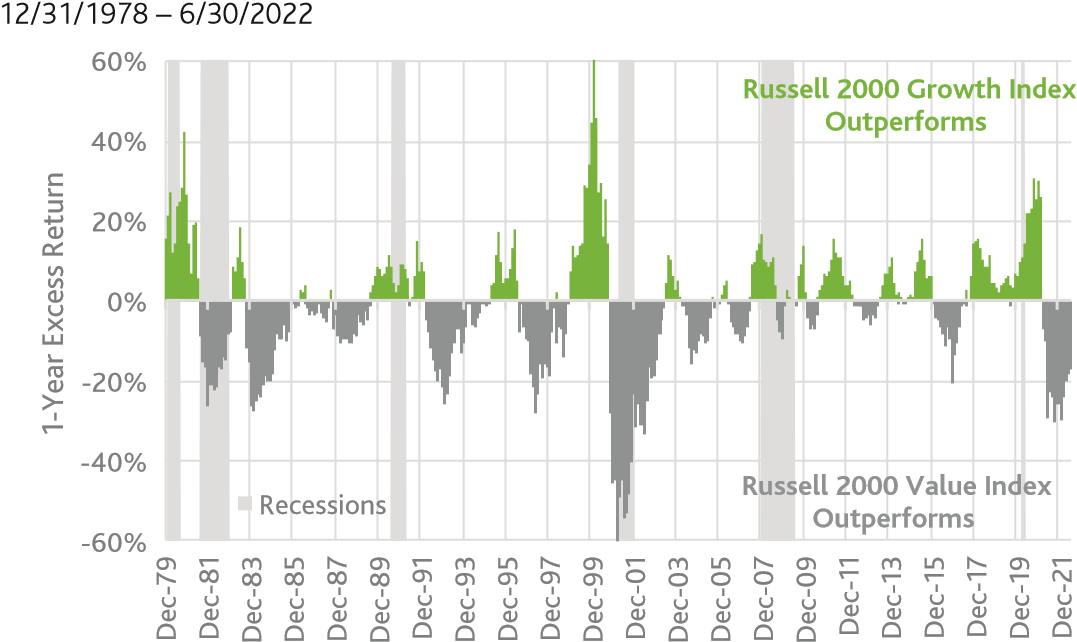
U.S. Mid/Large Cap Equities
Sources: FactSet, Baron Capital.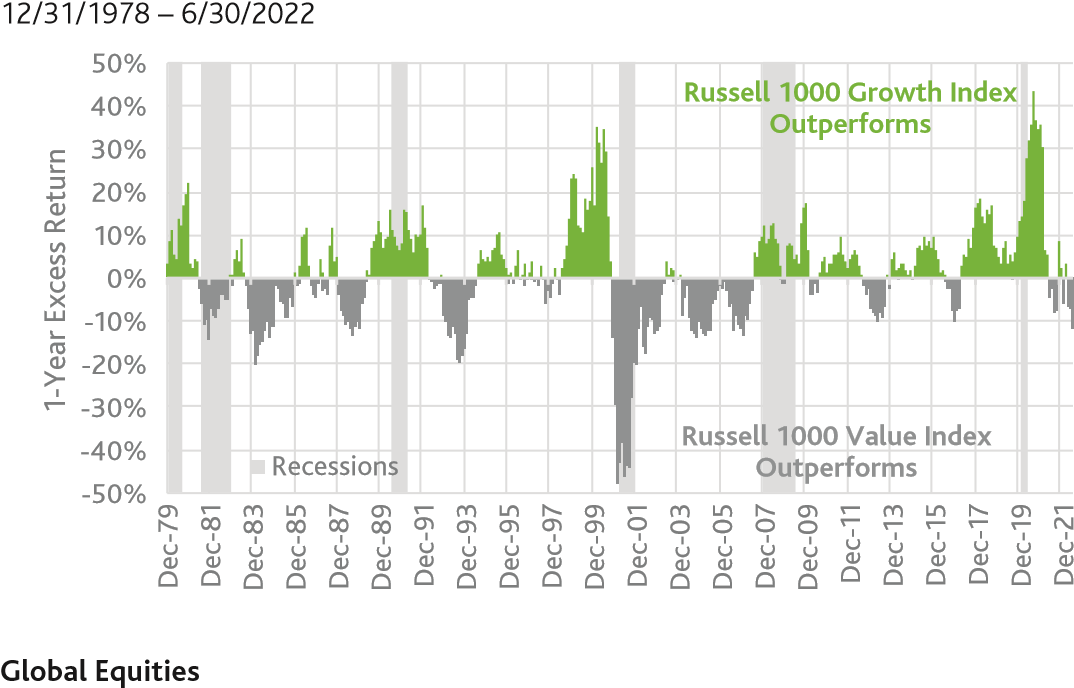
| Note: Past performance is not indicative of future results. The indexes are unmanaged. Index performance is not Fund performance; one cannot invest directly into an index. |
There are several noteworthy observations from the above charts:
- The length and magnitude of outperformance of growth or value stocks varies widely;
- The long periods of outperformance are not necessarily followed by long periods of underperformance;
- The strong out-/underperformance periods are not necessarily followed by periods of strong under-/outperformance;
- The outperformance cycles of growth and value stocks do not seem to correlate to periods of U.S. economic recessions;
- The periods of out-/underperformance for U.S. small-cap growth or value stocks do not always coincide with those of mid/large-cap stocks, although many times they do. Similarly, the cycles for value and growth in global equities do not perfectly coincide in time with the cycles in the U.S.;
- The underperformance of U.S. small-cap growth stocks is significantly bigger than the underperformance of U.S. large-cap growth stocks and global growth stocks in the current cycle.
Based on this data alone, it is hard to assess where growth equities are in the current cycle or where they may be headed. Perhaps, the low point for growth stocks has passed, and they are on the path of recovery or even at the start of a new outperformance cycle. Or there could be further downside coming – no one knows. Investors have long tried to predict the next move of the markets, and to our knowledge, no one has been able to accomplish this with any consistency.
Since stock prices are a driving component of equity valuations, the recent market decline has brought valuations significantly below their highs. During 2021, the next twelve months price-to-earnings (“P/E”) ratio for the S&P 500 Index was more than one standard deviation above its long-term average and was approaching extreme levels last seen during the dot-com bubble.
As of 6/30/22, the popular valuation metric had declined to 15.8x, slightly below the average level over the past 25 years, as seen in the chart below. Although valuations may decline further, the data indicates that currently the broad equity market in the U.S. is not overvalued and may even present an attractive entry point.
Stock Valuations Have Declined Significantly from Their Highs
S&P 500 Index – Next Twelve Months P/E Ratio
Source: FactSet Market Aggregates.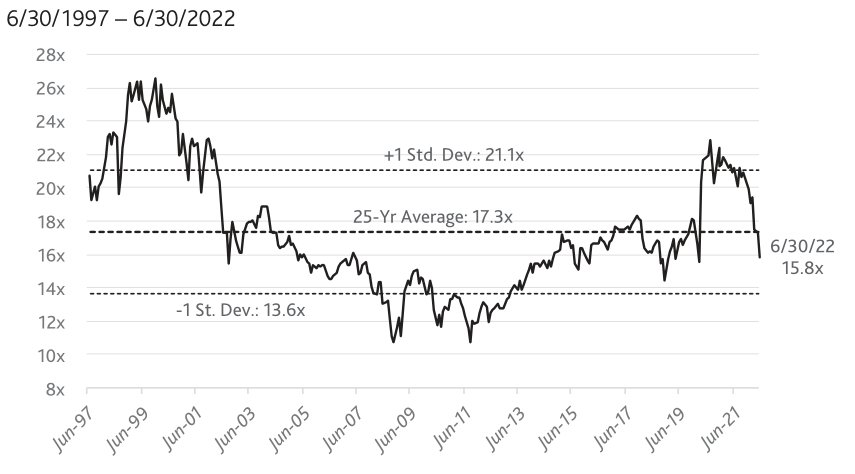
|
Note: Past performance is not indicative of future results. |
Compared to the U.S., international equities seem to be valued even more attractively, judging by the next twelve months P/E ratio of the MSCI ACWI ex USA Index. As shown on the chart below, as of 6/30/2022, the valuation metric was more than one standard deviation below its 20-year average, a rare occurrence. For this chart, we are using data for the past 20 years due to the lack of reliable data for the index prior to 2002.
MSCI ACWI ex USA Index – Next Twelve Months P/E Ratio
Source: FactSet Market Aggregates.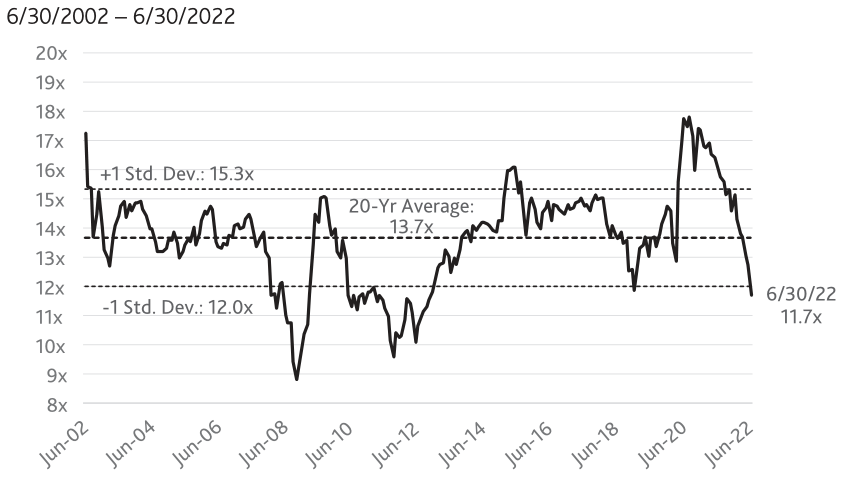
|
Note: Past performance is not indicative of future results. |
The recent underperformance of growth stocks has resulted in a bigger compression of growth equity valuations relative to value. As the table below shows, as of 6/30/2022 the P/E ratio for U.S. small-growth stocks was 46% below the highest valuation level over the past decade. The multiple compression has also been very significant in the mid- and large-cap growth spaces, both in absolute terms and relative to value stocks.
Valuations for Growth Stocks Have Declined More Significantly
Price-to-Earnings Ratio Price-to-Earnings Ratio as of 6/30/2022 vs. 10-Yr Maximum
Source: The Bank of New York Mellon Corporation using I/B/E/S 1 Year Forecast EPS.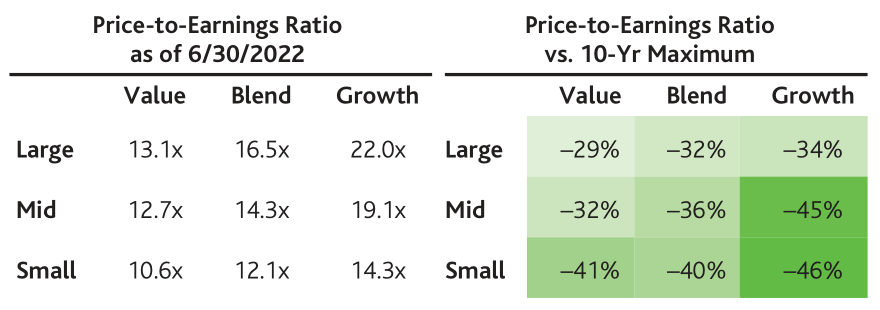
| Notes: The price-to-earnings ratios for each style box are based on Russell indexes, as follows: for Large Value: Russell 1000 Value Index, for Large Blend: Russell 1000 Index, for Large Growth: Russell 1000 Growth Index, for Mid Value: Russell Midcap Value Index, for Mid Blend: Russell Midcap Index, for Mid Growth: Russell Midcap Growth Index, for Small Value: Russell 2000 Value Index, for Small Blend: Russell 2000 Index, for Small Growth: Russell 2000 Growth Index. Past performance is not indicative of future results. |
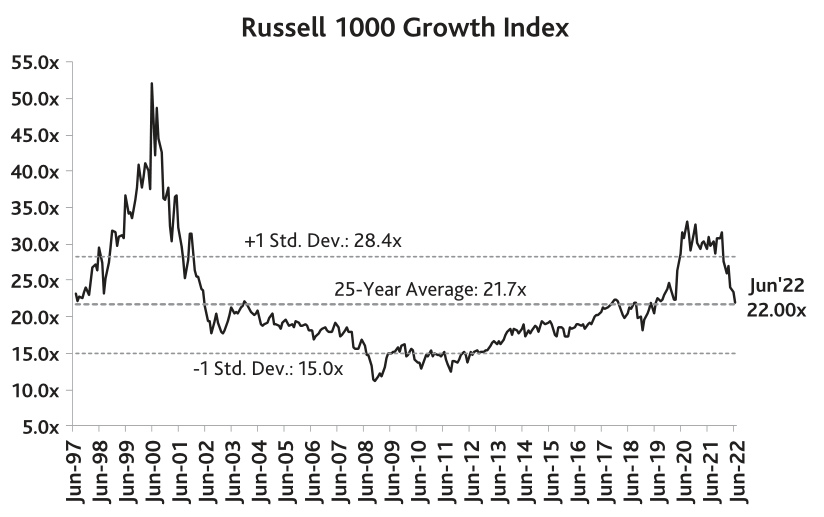
The time series charts below add further perspective, showing growth equity valuations on a longer-term scale. For the smaller cap growth stocks (Russell 2000 Growth Index), P/Es have now declined to one of the lowest levels in 25 years. This means that there may be abundant attractively valued investment opportunities in the small cap space. The valuations of mid- and large-cap growth stocks included in the Russell 1000 Growth Index, which experienced a smaller decline this year, are also far off from their peaks but are roughly in line with historical averages.
This indicates that there are perhaps fewer attractively valued investments in this space, requiring strong skill and good judgment to identify them.
Valuations for Growth Stocks are Below or At Long-Term Averages
Next Twelve Months Price-to-Earnings Ratios
Source: The Bank of New York Mellon Corporation using I/B/E/S 1 Year Forecast EPS.
|
Note: Past performance is not indicative of future results. |
In the short term, stocks prices may recover, decline further, or simply move sideways. We do not know, nor do we try to predict what will happen. Baron’s investment philosophy has always been focused on the long term and on individual company qualities and characteristics – the approach we continue to stick to in the current investment environment.
Over the past year or so, we have witnessed some fundamental global economic shifts, including the beginning of monetary policy normalization after a decade of easing, persistent high inflation, and global commodity shortages. We believe that due to these and other changes, it is less likely that traditional growth or value stocks experience extended outperformance cycles in the near term or at least until inflation and monetary policy normalize.
We recognize that without the support of monetary easing, stocks may be more vulnerable than what we experienced during the past decade. Nevertheless, there are multiple secular growth trends that we believe will produce long-term winners across the equity spectrum, and exceptional returns for those who invest in them. In other words, the opportunities for growth stocks are still present, but we do not expect all stocks to benefit. This makes stock picking ability more valuable.
Typically, investors and index providers separate growth and value stocks by one or a few fundamental metrics. Stocks with high revenue and earnings growth rates tend to be called “growth” and stocks with low price-to-book ratios tend to be identified as “value”. The major growth and value equity indexes are constructed following such criteria, and so are the passive investment products (ETFs and index funds) that replicate the indexes.
Popular fundamental factor models may add additional characteristics to the definitions of their value and growth factors but, roughly speaking, they too combine a handful of fundamental metrics in a formulaic way to assign growth and value scores to companies.
Baron’s assessment of growth is far more comprehensive. We establish each company’s growth profile based on the integral factors we believe drive its business. These factors are often different from one company to the next. Our analysis covers a range of past and projected fundamental metrics applicable to each business, an evaluation of tangible and intangible assets, an analysis of the company’s competitive advantages and their strength and durability, and a detailed product and unit economics analysis.
Of key importance is our assessment of the quality and ability of management, and the likelihood that it successfully executes the growth opportunity. All of these analyses are carried out with a long-term perspective, at least three to five years into the future.
Sometimes, there are common drivers of growth that we can broadly identify. For our non-U.S. investments, there is an additional overlay of analysis related to the economic growth prospects and geopolitical conditions in each country or region we invest in. We also find some common drivers of growth in secular growth themes that we have identified. Some of these themes include digitization of analog business models, advances in biology and medical technology, sustainability in emerging markets, autonomous driving, and cybersecurity.
For example, for companies that are beneficiaries/drivers of digitization, one of the strongest global growth trends, in our view, we can conclude that the growth of revenues and earnings is linked to the pace of adoption and usage of digital products and services.
In our view, Baron’s comprehensive assessment of qualitative and quantitative characteristics gives us a strong sense of the growth and quality profiles of companies. This framework has allowed us to identify long-term winners and deliver long-term alpha to our investors. While our evaluations are not always flawless, we are confident that our assessment of growth is better than the methodology used by a typical index. The latest annual rebalancing of the popular FTSE Russell indexes reinforces our view.
On 6/27/2022, the index provider moved companies like Meta Platforms Inc. (META, the parent of Facebook), Netflix Inc. (NFLX), PayPal Holdings Inc. (PYPL), Zoom Video Communications Inc. (ZM), and Moderna Inc. (MRNA), among others, from the growth side to the value side of its equity universe. At the same time, long-time value names, including Procter & Gamble Co. (PG), International Business Machines Corp. (IBM), and Boeing Co. (BA) were added to the growth indexes.
Our disapproval of these changes may not be surprising. Even non-professional investors may find it hard to believe that a company like Meta Platforms Inc., a pioneer in communications and virtual reality, is a value stock. Certainly, Baron’s view of the growth potential of the company will not be affected by the change in FTSE Russell’s classification. Likewise, we will not invest in Procter & Gamble Co. or International Business Machines Corp. simply because they are now included in the FTSE Russell growth indexes.
As The Wall Street Journal remarked recently**, “Some investors say the price-to-book ratio that FTSE Russell uses has lost its relevance because of the increasing significance of intangible assets, which are ignored in the measure or reflected inconsistently.” We tend to agree.
While we monitor the changes and evolution of the benchmarks, we don’t get distracted by these. Our focus remains on the things within our control – rigorously analyzing the companies we invest in and building and managing portfolios we believe will deliver above average long-term returns. We have tried to use the past six months to our advantage. Our efforts have been focused on upgrading the quality of our portfolios, ensuring they are well positioned to both withstand any additional potential market drops and benefit from the next bull market.
We have been actively checking in with company management teams, confirming our investment theses are intact. In addition, we are making sure our investments, particularly in the smaller cap portfolios, are generating sufficient cash or at least have sufficient cash on their balance sheets. This quality check is of particular importance to us, especially if economic conditions start deteriorating. For our smallest cap portfolio, Baron Discovery Fund, only around 22% of its assets are invested in companies that are not yet cash flow positive.
However, the Fund’s portfolio managers believe each of these companies has sufficient cash and growth momentum to cross the breakeven point without having to raise capital in challenging times (see Baron Discovery Fund Letter). Our research team is making sure such quality checks are performed across our Firm’s investments, particularly with regard to cash flow generation, leverage, and balance sheet quality.
Another action that some of our portfolio managers have taken to improve quality is reducing the number of investments and giving more weight to higher conviction names. However, this does not mean that we have only been selling. As market capitalizations and valuations have declined across the board, we have made investments in companies previously out of reach, either due to size or because they were too expensive. Our portfolio managers are looking beyond what may happen over the next 12 months. They are focused on the growth prospects of our investments three to five years down the road.
We believe that the markets today are presenting attractive buying opportunities for long-term investors. As we have noted in the past, the stock market has gone up over the long term, generating significant returns for those who stayed invested. Since 1970, there have been eight recessions, eight yield curve inversions, 12 rising rates periods, nine periods of rising inflation, and several global crises, as shown in the next chart. Yet, the stock market, as measured by the S&P 500 Index, was up 4,012%, or 7.34% annualized. When we add dividends, these figures increase to 18,673% and 10.49%, respectively.
U.S. Equities Have Increased Over the Long Term Despite Various Crises
S&P 500 Index
12/31/1969 – 6/30/2022
Sources: FactSet, Board of Governors of the Federal Reserve System (U.S.), National Bureau of Economic Research, U.S. Bureau of Economic Analysis.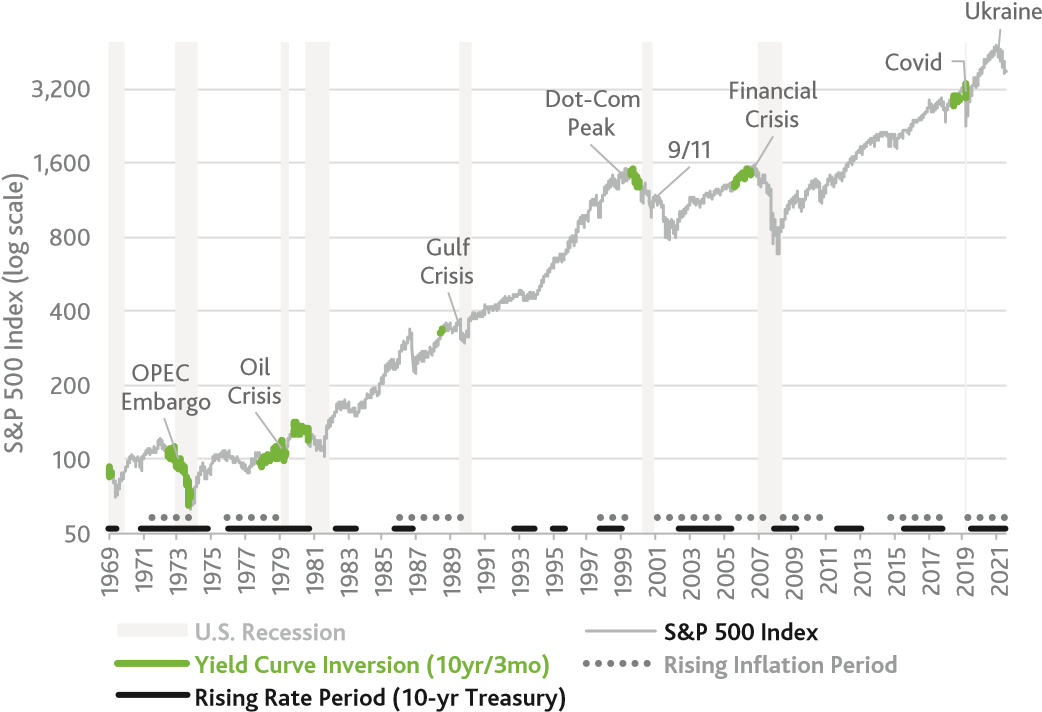
| The performance data quoted represents past performance. Past performance is no guarantee of future results. The indexes is unmanaged. Index performance is not Fund performance; one cannot invest directly into an index. |
Trying to avoid the painful down days may be tempting to some investors, but it can easily lead to missing some of the best days, which typically follow closely the worst days. As the chart below shows, missing the best five days in the market over the past 4 market cycles would have resulted in a 38% lower value of a hypothetical $10,000 investment in a fund designed to track the S&P 500 Index and missing the best 10 days would have resulted in a 55% lower value. Missing more up days would have produced even worse results.
A Few Missed Days May Be Costly
Growth of $10,000 Hypothetically Invested in a Fund Designed to Track the S&P 500 Index
Sources: FactSet, Baron Capital.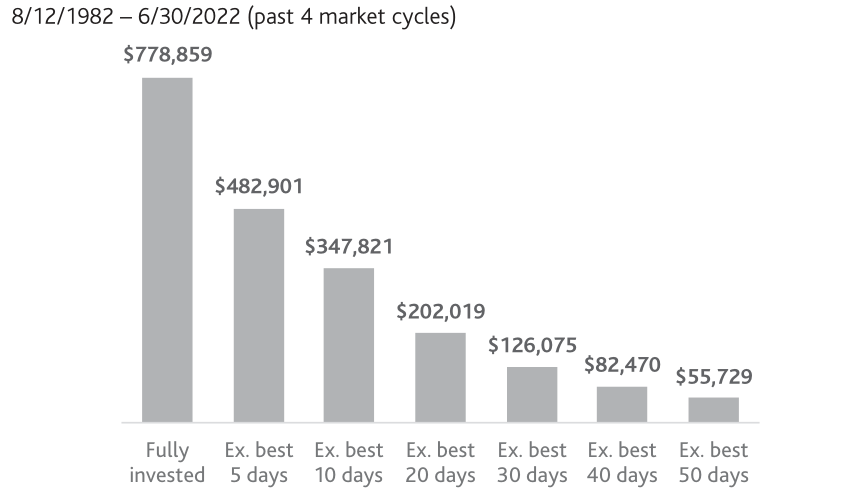
| Note: The performance data quoted represents past performance. Past performance is no guarantee of future results. The index is unmanaged. Index performance is not Fund performance; one cannot invest directly into an index. |
In addition, historical data suggests that staying invested in equities over longer periods increases the likelihood of generating positive returns. For example, as shown in the table below, an investor in a product that exactly mimics the performance of the S&P 500 Index would have had a 69% chance of generating a positive return during any given quarter between 1926 and 2022.
Increasing the investment horizon to 10 years would have resulted in a much better chance for positive return – about 95%, and a significantly lower worst-case scenario. And investing over any 20- or 30-year period would have produced positive returns 100% of the time.
Long-Term Investors Have Had Better Chances of Positive Returns
S&P 500 Index – % of Time Positive Returns and Range of Returns Over Various Periods
Based on monthly rolling periods, 1/31/1926 – 6/30/2022
|
Rolling Period |
% Time Positive |
Average Annualized Return |
Smallest Annualized Return |
Largest Annualized Return |
| 1 Quarter*** |
69% |
2.96% |
–44.78% |
91.17% |
|
1 Year |
76% |
12.49% |
–67.56% |
162.89% |
|
3 Years |
84% |
10.74% |
–42.35% |
43.35% |
|
5 Years |
88% |
10.26% |
–17.36% |
36.12% |
|
10 Years |
95% |
10.50% |
–4.95% |
21.43% |
|
20 Years |
100% |
10.82% |
1.89% |
18.26% |
|
30 Years |
100% |
11.15% |
7.80% |
14.78% |
|
Sources: Morningstar Direct, FactSet, Baron Capital. Note: The performance data quoted represents past performance. Past performance is no guarantee of future results. The index is unmanaged. Index performance is not Fund performance; one cannot invest directly into an index. |
Despite the current economic and market challenges, we are confident in the long-term prospects of our investments. When investing for the long term in businesses that are growing and the intrinsic value of which is increasing, we know that time is on our side. We believe that, sooner or later, the market will recognize the value that we see, absent any changes in the fundamentals.
This process may not happen smoothly or evenly over time, which is why it is important not to lose sight of long-term goals and remain invested, particularly in volatile times. We believe that investing in quality growth businesses with excellent management teams and competitive advantages will certainly help achieve those goals.
Sincerely,
Chairman, President, and COO
Footnotes
|
[1]Represented by the Russell 2000 Growth Index and Russell 2000 Value Index. [2]Represented by the Russell 1000 Growth Index and Russell 1000 Value Index. [3]Represented by the MSCI ACWI Growth Index and MSCI ACWI Value Index. *As measured by the CBOE Market Volatility Index (“VIX”) **“Facebook, Netflix and PayPal Are Value Stocks Now”, The Wall Street Journal, 6/23/2022 ***Returns are not annualized for the quarterly periods. |
Editor’s Note: The summary bullets for this article were chosen by Seeking Alpha editors.
Be the first to comment