

wwing
Earnings of Bank of Hawaii Corporation (NYSE:BOH) will likely recover this year after most probably dipping in 2022. Hawaii’s economy will drive loan growth, which will, in turn, play a key role in earnings growth. Further, slight margin expansion will support the bottom line. Overall, I’m expecting the Bank of Hawaii to report earnings of $5.31 per share for 2022, down 15%, and $5.72 per share for 2023, up 8% year-over-year. The December 2023 target price is below the current market price. Based on the total expected return, I’m maintaining a hold rating on the Bank of Hawaii Corporation.
Hawaii’s Satisfactory Economic Condition Will Likely Sustain Loan Growth
Bank of Hawaii’s loan growth continued to remain strong during the quarter that ended September 2022. The portfolio grew by 8.9% during the first nine months of 2022, or 11.8% annualized, which is the highest growth since 2016. In my opinion, the Bank of Hawaii can have a further few strong quarters before the growth rate subsides to a more normal level. Hawaii’s economy is currently very strong, which will likely keep loan growth elevated in the near term.
The elevated passenger count shows that the state’s tourism industry is doing quite well. The following chart shows how the current passenger count is higher than last year’s passenger count. (Note: the blue line is current while the orange line is lagged by one year. The gap between blue and yellow lines shows how much better the current value is relative to a year ago period.) University of Hawaii Economic Research Organization (“UHERO”) expects total passenger arrivals by air to rise by 4.1% in 2023, as mentioned in its December forecast release.
University of Hawaii Economic Research Organization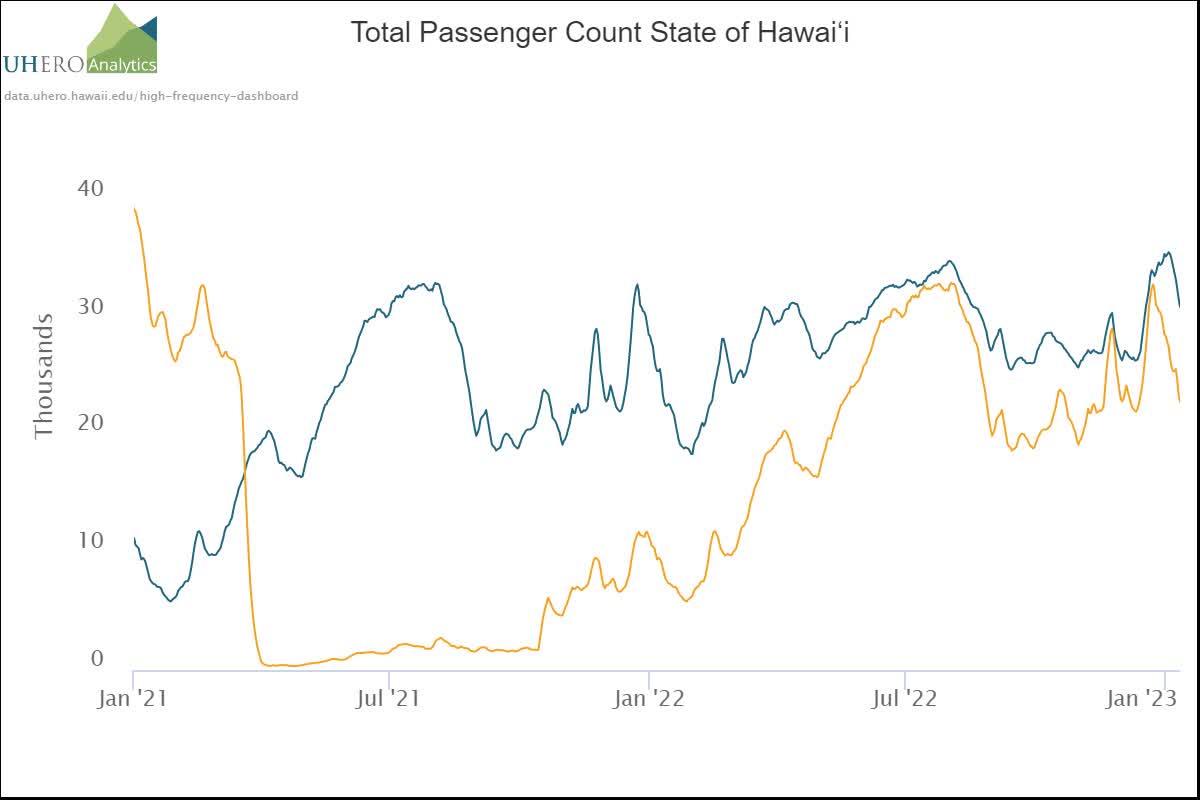
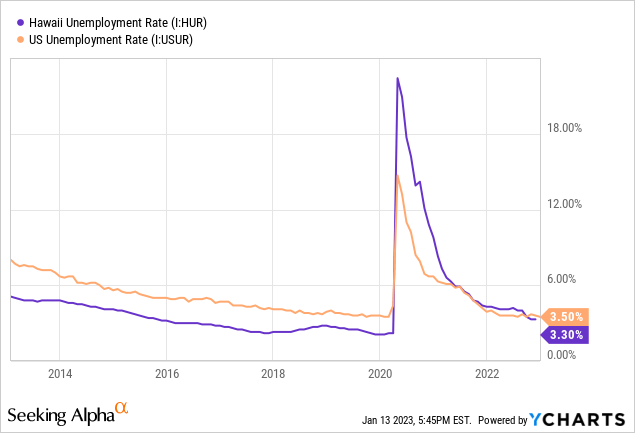
Further, the state’s unemployment rate is currently very low compared to both the national average and the state’s history. UHERO expects the unemployment rate to drop even further in 2023 relative to 2022.
Considering these factors, I’m expecting the loan growth to have remained elevated at 2% in the last quarter of 2022, taking full-year loan growth to 11%. For 2023, I’m expecting loan growth to moderate to around 6%. Meanwhile, I’m expecting deposits to grow somewhat in line with loans. The following table shows my balance sheet estimates.
| Financial Position | FY18 | FY19 | FY20 | FY21 | FY22E | FY23E |
| Net Loans | 10,342 | 10,881 | 11,724 | 12,101 | 13,439 | 14,228 |
| Growth of Net Loans | 6.7% | 5.2% | 7.7% | 3.2% | 11.1% | 5.9% |
| Other Earning Assets | 5,504 | 5,960 | 7,472 | 9,362 | 8,413 | 8,929 |
| Deposits | 15,027 | 15,784 | 18,212 | 20,360 | 21,202 | 22,503 |
| Borrowings and Sub-Debt | 640 | 798 | 768 | 564 | 544 | 577 |
| Common equity | 1,268 | 1,287 | 1,375 | 1,432 | 1,047 | 1,083 |
| Book Value Per Share ($) | 30.2 | 31.7 | 34.5 | 35.7 | 26.3 | 27.2 |
| Tangible BVPS ($) | 29.4 | 30.9 | 33.7 | 35.0 | 25.5 | 26.4 |
| Source: SEC Filings, Author’s Estimates(In USD million unless otherwise specified) | ||||||
Suboptimal Balance Sheet Positioning to Restrict Margin Expansion
Bank of Hawaii’s net interest margin expanded by 13 basis points each in the second and third quarters. The subdued margin expansion is not surprising as the net interest income is not very rate sensitive due to the following factors.
- Bank of Hawaii has a large securities portfolio that mostly carries fixed rates. Securities made up 37% of total earning assets at the end of September 2022. Therefore, the securities portfolio will make the average earning-asset yield somewhat sticky.
- The large balance of adjustable-rate deposits will keep the deposit beta elevated. These deposits, including interest-bearing demand and savings accounts, made up 59.14% of total deposits at the end of September 2022.
- Only around 35% of total loans will mature or reprice in a year’s time, as mentioned in the earnings presentation. The rest of the loan portfolio will remain fixed and therefore hold back the margin as market interest rates rise.
The results of the management’s interest-rate sensitivity analysis given in the 10-Q filing show that a 200-basis points hike in interest rates could increase the net interest income by only 3.3% over twelve months.
3Q 2022 10-Q Filing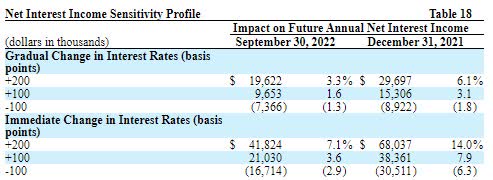
Considering these factors, I’m expecting the margin to have grown by only three basis points in the last quarter of 2022. Further, I’m expecting the margin to increase by eight basis points in 2023.
Expecting Earnings to Recover by Around 8% this Year
The anticipated loan growth will likely be the chief earnings driver in 2023. Further, the bottom line will receive some support from slight margin expansion. Meanwhile, I’m expecting the provisioning for expected loan losses to remain near a normal level. I’m expecting the net provision expense to make up 0.14% of total loans in 2023, which is close to the average from 2017 to 2019.
Overall, I’m expecting the Bank of Hawaii to report earnings of $5.31 per share for 2022, down 15% year-over-year. For 2023, I’m expecting earnings to recover to $5.72 per share, up 8% year-over-year. The following table shows my income statement estimates.
| Income Statement | FY18 | FY19 | FY20 | FY21 | FY22E | FY23E |
| Net interest income | 486 | 498 | 496 | 497 | 544 | 610 |
| Provision for loan losses | 13 | 16 | 118 | (51) | (4) | 20 |
| Non-interest income | 169 | 183 | 184 | 171 | 153 | 149 |
| Non-interest expense | 372 | 379 | 374 | 394 | 419 | 438 |
| Net income – Common Sh. | 220 | 226 | 154 | 250 | 211 | 227 |
| EPS – Diluted ($) | 5.23 | 5.56 | 3.86 | 6.25 | 5.31 | 5.72 |
| Source: SEC Filings, Author’s Estimates(In USD million unless otherwise specified) | ||||||
In my last report on the Bank of Hawaii, which was published in June 2022, I estimated earnings of $5.33 per share for 2022. My updated earnings estimate is a bit lower because the non-interest income reported for the third quarter missed my previous expectations.
My estimates are based on certain macroeconomic assumptions that may not come to fruition. Therefore, actual earnings can differ materially from my estimates.
The Current Market Price is Above the Year-End Target Price
Bank of Hawaii is offering a dividend yield of 3.5% at the current quarterly dividend rate of $0.70 per share. The earnings and dividend estimates suggest a payout ratio of 49% for 2022, which is in line with the five-year average of 50%. Therefore, I’m not expecting an increase in the dividend level.
I’m using the historical price-to-tangible book (“P/TB”) and price-to-earnings (“P/E”) multiples to value the Bank of Hawaii. The stock has traded at an average P/TB ratio of 2.37x in the past, as shown below.
| FY19 | FY20 | FY21 | Average | ||||
| T. Book Value per Share ($) | 30.9 | 33.7 | 35.0 | ||||
| Average Market Price ($) | 82.7 | 66.5 | 85.9 | ||||
| Historical P/TB | 2.68x | 1.97x | 2.46x | 2.37x | |||
| Source: Company Financials, Yahoo Finance, Author’s Estimates | |||||||
Multiplying the average P/TB multiple with the forecast tangible book value per share of $26.4 gives a target price of $62.7 for the end of 2023. This price target implies a 22.2% downside from the January 13 closing price. The following table shows the sensitivity of the target price to the P/TB ratio.
| P/TB Multiple | 1.97x | 2.17x | 2.37x | 2.57x | 2.77x |
| TBVPS – Dec 2023 ($) | 26.4 | 26.4 | 26.4 | 26.4 | 26.4 |
| Target Price ($) | 52.1 | 57.4 | 62.7 | 68.0 | 73.3 |
| Market Price ($) | 80.6 | 80.6 | 80.6 | 80.6 | 80.6 |
| Upside/(Downside) | (35.3)% | (28.8)% | (22.2)% | (15.7)% | (9.1)% |
| Source: Author’s Estimates |
The stock has traded at an average P/E ratio of around 15.3x in the past, as shown below.
| FY19 | FY20 | FY21 | Average | ||||
| Earnings per Share ($) | 5.56 | 3.86 | 6.25 | ||||
| Average Market Price ($) | 82.7 | 66.5 | 85.9 | ||||
| Historical P/E | 14.9x | 17.2x | 13.7x | 15.3x | |||
| Source: Company Financials, Yahoo Finance, Author’s Estimates | |||||||
Multiplying the average P/E multiple with the forecast earnings per share of $5.72 gives a target price of $87.4 for the end of 2023. This price target implies an 8.4% upside from the January 13 closing price. The following table shows the sensitivity of the target price to the P/E ratio.
| P/E Multiple | 13.3x | 14.3x | 15.3x | 16.3x | 17.3x |
| EPS 2023 ($) | 5.72 | 5.72 | 5.72 | 5.72 | 5.72 |
| Target Price ($) | 76.0 | 81.7 | 87.4 | 93.1 | 98.8 |
| Market Price ($) | 80.6 | 80.6 | 80.6 | 80.6 | 80.6 |
| Upside/(Downside) | (5.7)% | 1.3% | 8.4% | 15.5% | 22.6% |
| Source: Author’s Estimates |
Equally weighting the target prices from the two valuation methods gives a combined target price of $75.0, which implies a 6.9% downside from the current market price. Adding the forward dividend yield gives a total expected return of negative 3.4%. Hence, I’m adopting a hold rating on the Bank of Hawaii Corporation.
Be the first to comment