

Spencer Platt/Getty Images News
Investment Thesis
I am assigning Bank of America (NYSE:BAC) a sell rating based on BAC being a proxy for the American economy in a worsening macroeconomic outlook. It is easy to like a too big to fail bank with the longevity, profitability, brand name, and client base of Bank of America, especially when it is down 30% over the last year. If you have a long investment horizon and you aren’t concerned with short term liquidity, BAC’s current price might reflect a nice entry point that can be averaged down if the stock falls further. However, I view the current macro environment as too much of a risk to Bank of America to justify an investment in most cases at its current level.
Financial Analysis
Bank of America has a 20-year beta of 1.58 meaning it is much more volatile than the market. I specifically calculated for the 20-year beta in order to fully encompass a market cycle to show that BAC is increasingly volatile in a volatile market. For example, BAC has a 5-year beta of 1.08, a 10-year beta of 1.15, and had a beta of 2.07 from January 2006 to January 2010. To be fair, Bank of America has dramatically altered their credit mix and lending practices since 2009. In Q4 2009, Bank of America had a loan mix of 67% consumer loans to 33% commercial loans. BAC currently has a loan mix of 56% commercial loans to 44% consumer loans, this is a dramatic shift in credit mix with a lower risk profile. From 2009 to 2022 BAC has reduced their credit card lending from $161 Billion to $84 Billion and their home equity lending from $154 Billion to $27 Billion, providing less exposure to unsecured or junior lien debt. As you can see in the graphic below, the credit profiles of the consumer credit that remains on the books is incredibly strong.
BAC Consumer Creditworthiness (Bank of America Investor Presentation)
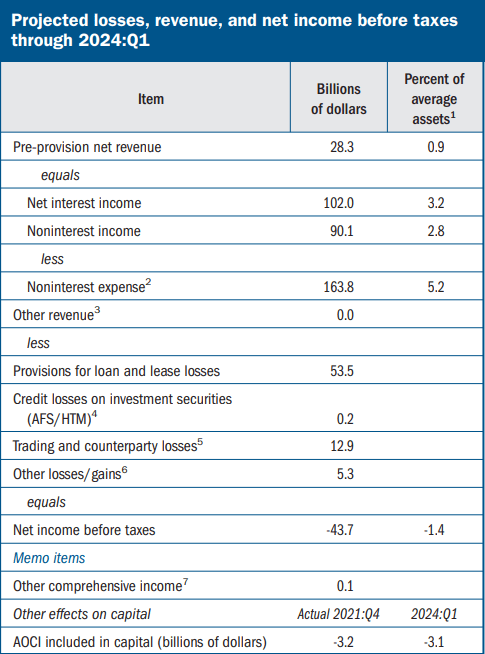
Bank of America is more insulated from a credit crunch than they were in 2009, but that doesn’t mean they are invulnerable. The most recent Fed stress test, projects that over nine quarters in a severely adverse scenario Bank of America would take $52.5 Billion in loan losses or 5.2% of its total loans. Among large-cap diversified banks in the U.S. BAC’s 5.2% loan loss rate was actually the lowest with U.S. Bancorp (USB) at 5.9%, JPMorgan (JPM) and Wells Fargo (WFC) at 6.0%, and Citigroup (C) at 6.4%. However, in a severely adverse scenario the stress test projects Bank of America to have the largest nine quarter net income loss at ($43.7 Billion) with JPM close behind at ($40.9 Billion).
BAC Fed Stress Test Loan Losses (Federal Reserve) BAC Fed Stress Test Net Losses (Federal Reserve)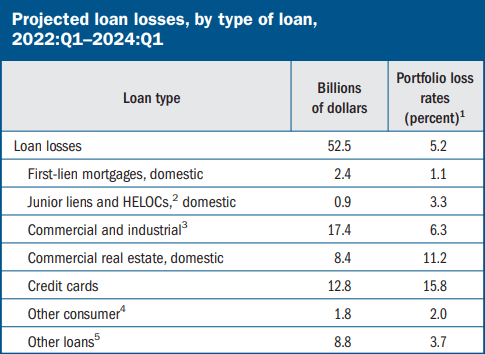
Rising interest rates are extremely double-edged for Bank of America. Bank of America projects an additional $5 Billion in yearly net interest income for every 100-basis point (1%) increase in interest rates. Rising rates will also continue to put a strain on leveraged consumers, businesses, and governments increasing the risk of a credit or currency crisis.
Macro Analysis
It is no secret that we are currently in an extremely tough macroeconomic environment. The Fed is trying to play catch-up with 8.3% inflation, and thus far they have signaled that taming inflation is their priority over employment, growth, and the market. Real GDP decreased 1.6% in Q1 2022 and 0.6% in Q2, signaling a technical recession. In the chart below, you can see that the Atlanta Fed GDPNow is currently projecting real GDP growth of 2.9% for Q3, with the Blue Chip consensus coming in under 1%. The IMF is projecting 3.2% global growth in 2022 and 2.7% for 2023, this is the lowest growth since 2001, excluding the global financial crisis and Covid-19.
Jamie Dimon, CEO of JPM, shared the following thoughts about the state of the economy on 10/10/22, courtesy of CNBC.
“These are very, very serious things, which I think are likely to push the US and the world — I mean, Europe is already in recession — and they’re likely to put the US in some kind of recession six to nine months from now”
“The likely place you’re gonna see more of a crack and maybe a little bit more of a panic is in credit markets”
“Could be another easy 20 per cent…I think the next 20 per cent will be much more painful than the first. Rates going up another 100 basis points are a lot more painful than the first 100 because people aren’t used to it.”
As you can see in the New York Fed Corporate Bond Market Distress Index, credit markets haven’t cracked yet, but the burden of higher rates is making itself known.
Corporate Bond Market Distress Index (N.Y. Fed)
The consumer has also felt the burden of inflation with total revolving credit reaching all time highs and the personal savings rate falling to 3.5%, a rate not seen since August, 2008. Consumers have increasing relied on credit cards to deal with higher energy and food costs. Savings from stimulus checks have been spent and with the student loan pause set to expire at the end of the year, tighter times lay ahead.
Revolving Credit, Fed Funds Rate, and Credit Card Delinquincy (FRED St. Louis Fed)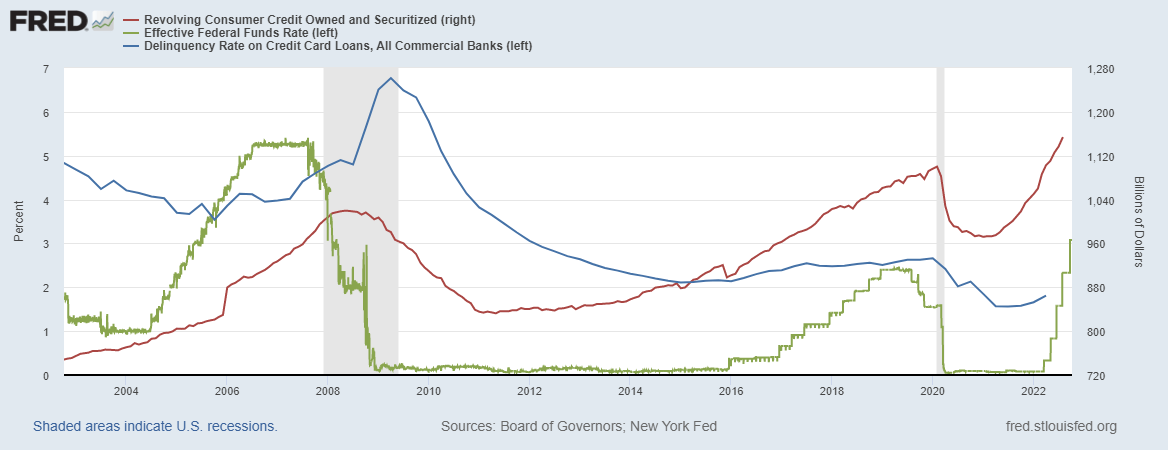
Valuation:
I chose six of the largest diversified banks in North America as comps for BAC: JPMorgan Chase & Co., Wells Fargo & Co., Royal Bank of Canada (RY), The Toronto-Dominion Bank (TD), U.S. Bancorp, and Citigroup Inc. When determining the fair market value of banks, the focus is on assets and earnings so I focused on P/B, EPS, and a combination of the two in Graham’s Number.
BAC Comps (Data from Seeking Alpha)
Bank of America is trading at a discount to its peers on a P/B basis at 1.00x compared to the median of 1.29x and average of 1.16x. BAC has a return on assets of 0.80% compared to the 0.90% of its peers, so a slight discount in P/B is probably warranted. In the graph below, you can see Bank of America’s 20-year historical price-to-book value. Again, BAC is trading at a slight discount to its 20-year average of 1.149.
BAC 20Y Historical P/B (YCharts)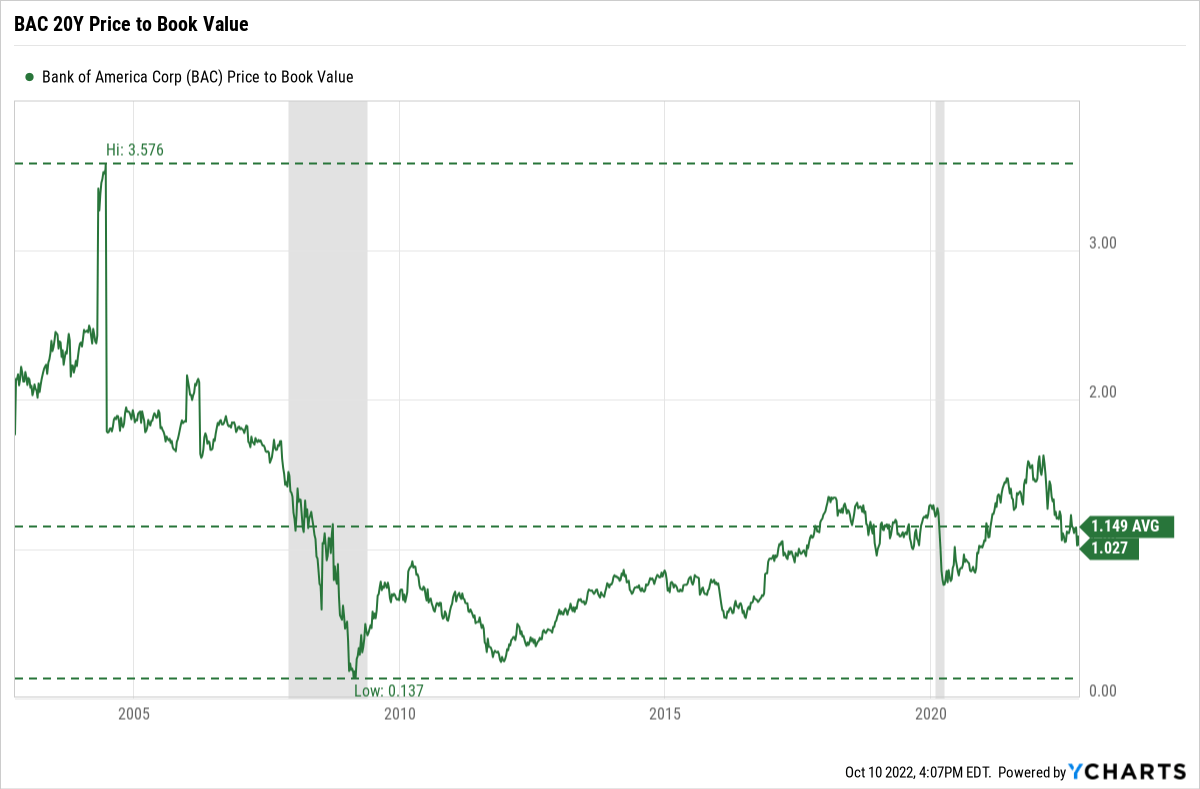
On a P/E basis, BAC is trading in line with peers at 9.24x against a median of 9.25x and an average of 8.59x. Consensus estimates put Bank of America’s 1-year EPS at $3.47 giving BAC a target price range of $29.81-$32.09 (3.47*8.59= $29.81, 3.47*9.25= $32.09) Over the past 5 years BAC has traded at an average P/E of 13.38x.
Graham’s Number is metric used to determine the upper boundary that a defensive investor should pay for a stock based on an ideal P/E ratio of 15x and P/B of 1.5x. Graham’s Number is calculated by:
Investopedia 
Given current market conditions, bank stocks are not going to trade at 15x P/E and 1.5x P/B, but it is still useful in establishing an upper boundary and as a point of comparison. BAC currently has a Graham’s Number of $46.59 and a Price-to-Graham’s Number of 0.64x, compared to a median of 0.71x and an average of 0.66x. The chart below shows that over the last 20 years BAC’s stock price and Graham’s Number have been highly correlated.
BAC Price and Graham’s Number Correlation (YCharts)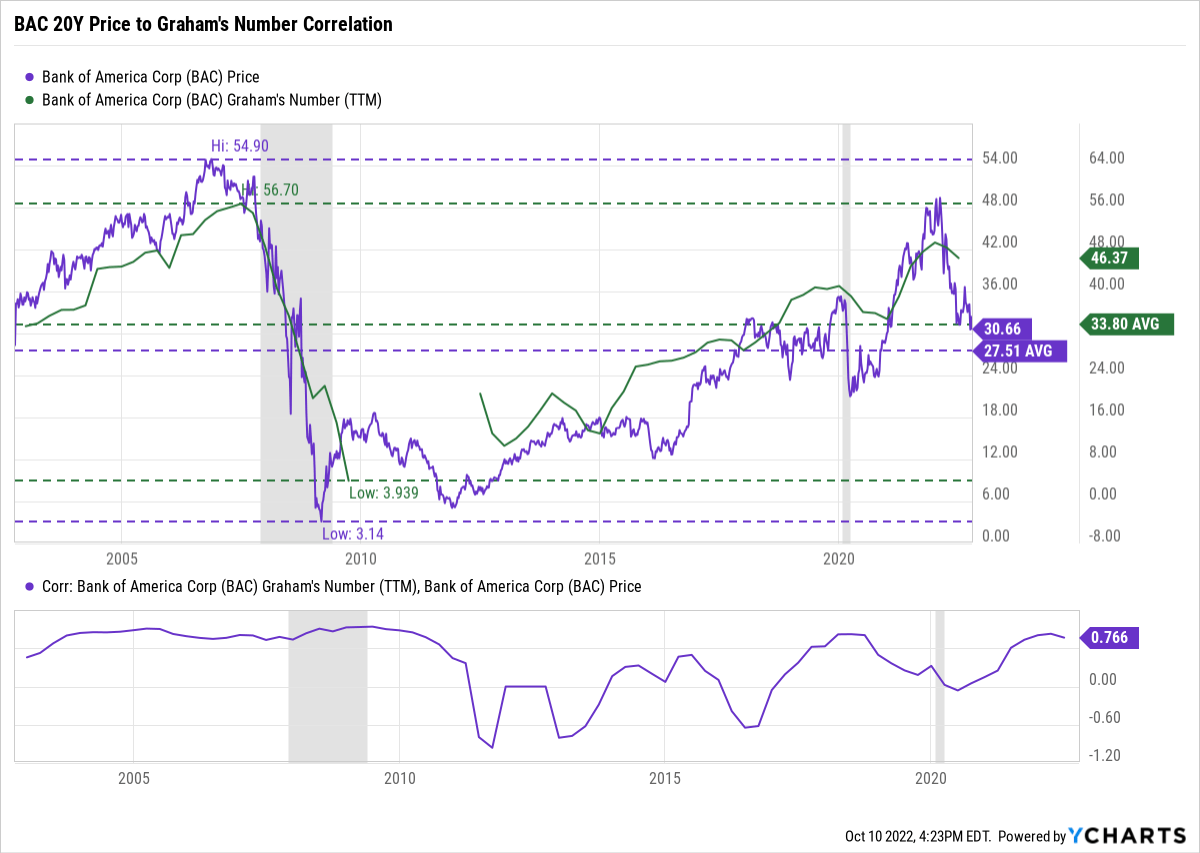
Final Thoughts
I like the way that Bank of America has transformed its balance sheet to reduce risk and prepare itself for eventualities. I actually think that Bank of America’s stock price is representative of its current intrinsic value. However, I think that the macroeconomic risks to the global economy and Bank of America outweigh upside at the moment. In the ideal scenario for Bank of America, the Fed would achieve a soft landing through moderate contractionary monetary policy; I just don’t buy it.
Be the first to comment