


tupungato
The global sell off didn’t overly affect Bank of America (NYSE:BAC). Yes, it did drop from the $50 region but if you have read any of the other articles which outlined bearish waves for major equities, Bank of America is one that dipped its toe into a third wave rather than jumping all in life jacket in tow.
This of course will only be confirmed once there is a clear bullish reversal and it just so happens that Bank of America is on the doorstep of one. Now we can move to the monthly chart below to delve deeper into the technicals.
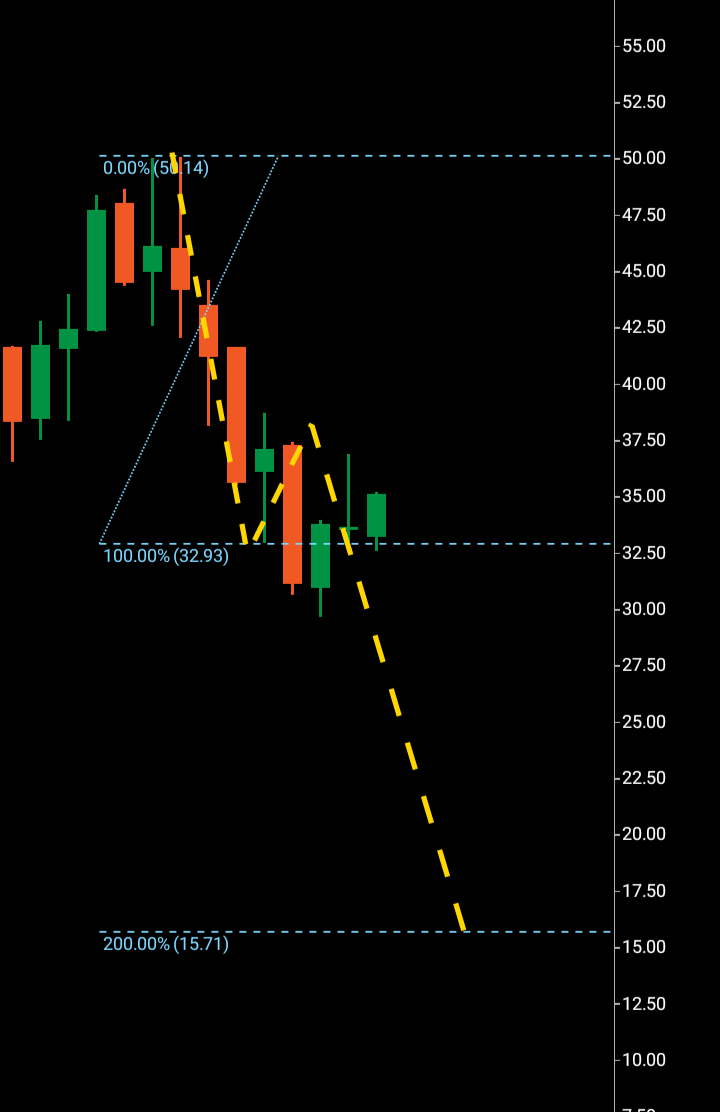
Bank of America monthly downwards (C Trader)
Starting from the top and working downwards, we can see BOA topping out in December 2021 after an attempt to climb higher, the following month BOA came within 3 cents of beating the topping candle before dropping to a low over the following months of $32.95 while after a swathe of bearish candles printing a bullish candle which once beaten at the bottom, would technically form a bearish third wave. In fact as we speak BOA is technically still in a bearish pattern until it tops $50 dollars where the start of the bearish wave one was formed. But it is the turnaround we will focus on today as if a bullish three wave pattern does break out, it will higher the probability that BOA has bottomed and will look to complete at the $44 region with what appears to be a lot of bullish intent for this banking stock to surpass the previous high and continue through the Fibonacci levels rendering any bearish wave over.
We can see the pattern BOA is technically still in above until a break above $37 that is. A bearish wave one $50-$32 and wave two $32-$37 with the third wave breaking through at $32 and turning around at just above $29.50 with a large bullish formation candle, this candle consists of enough wick and body to pass off as a macro bottoming candle theoretically. But it is the very bullish rejection candle at $37 that all eyes are now on. In order for a wave one two especially in bullish form, there must be a large buy up that carries price higher from a low and also a rejection candle. Normally rejection candles in bullish patterns would be red rejection candles, however it all boils down to what exactly is a rejection. We can see the candle that has been rejected at $37 opening initially quite far away before peaking at $37 and being driven back down with sell orders, the key to this is that the sell orders weren’t strong enough to push price any further into the wave one. So when we look at the pattern off the low, we can technically see a wave one and two, I would like to see a further buy up into the wave one by way of a larger bottoming wick before pushing higher but sometimes when a wave one two finishes in bullish form suggesting high demand, that doesn’t happen.
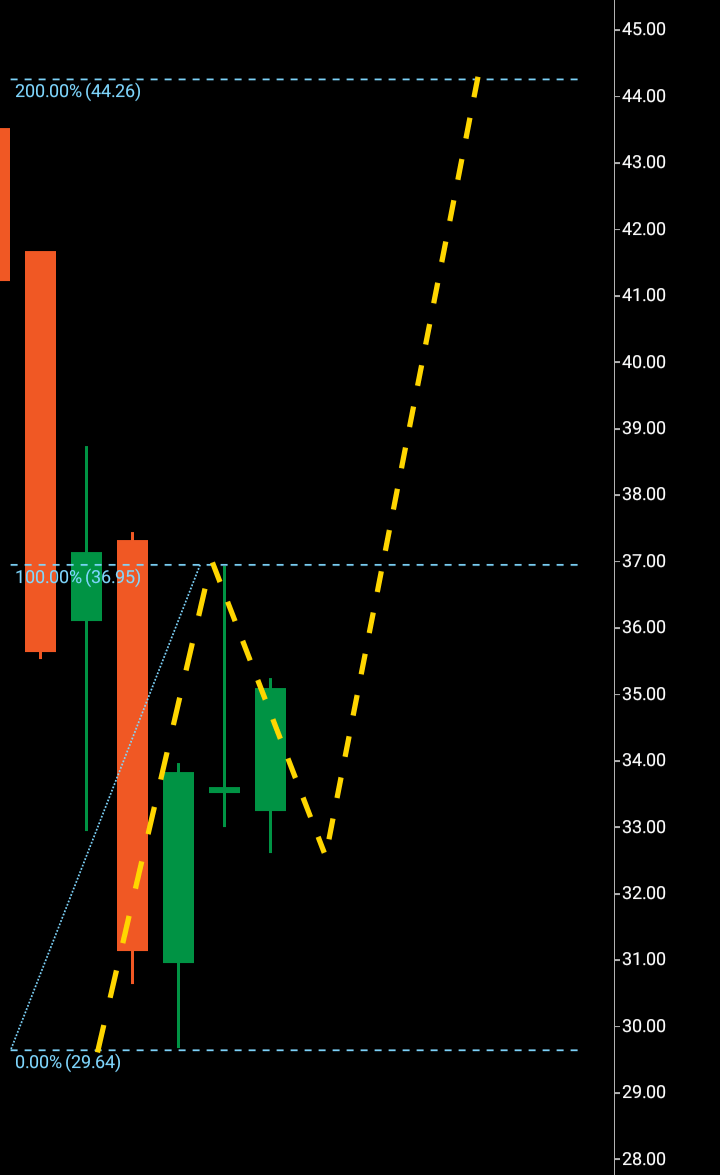
Bank of America Bullish turn around wave one and two (C Trader)
This appears to be the case here with the BOA current pattern formation that we can see in the chart above and we have a wave one $29-$37 and a bullish wave two $37-$33. With the third wave looking to break out and complete at $44. Numerically this is a short third wave and also technically still leaves BOA in bearish mode until $50 is beaten. Nevertheless, we are looking at a significant bullish turnaround showing investor confidence in BOA by its potentially feeble attempt at a bearish third wave and now rapid reversal.
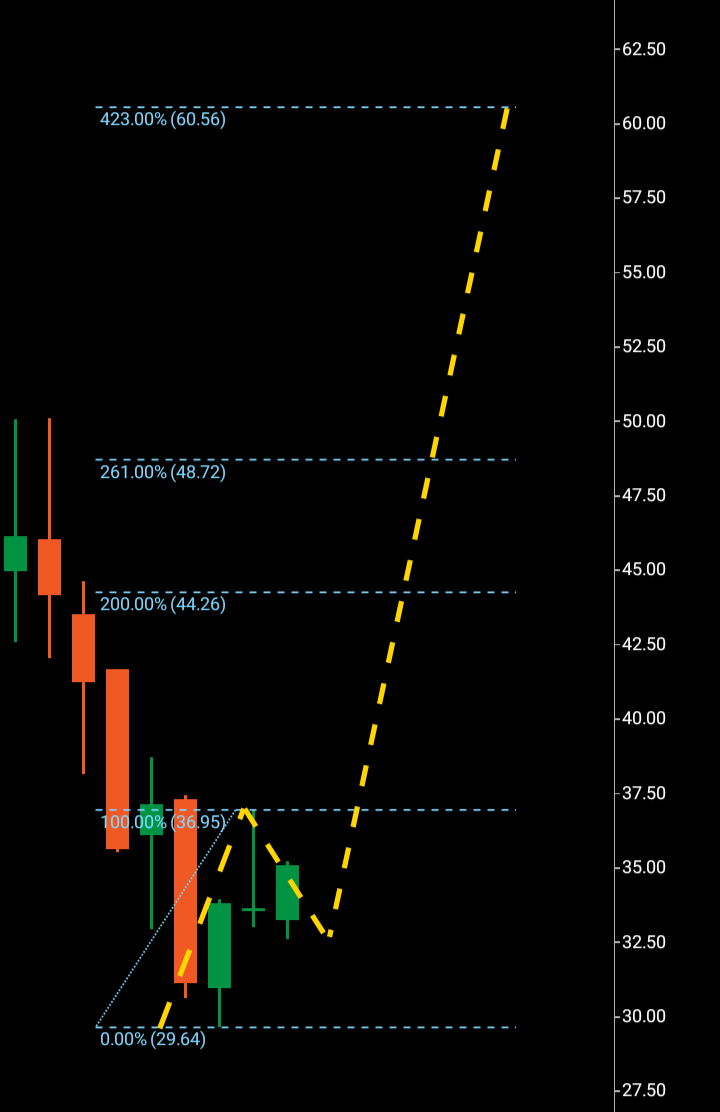
Bank of America possible targets (C Trader)
We will now examine the future possible Fibonacci levels given the slim numeracy of this bullish third wave and where BOA may land if it keeps grinding higher after hitting target at $44. We can see the ultimate Fibonacci target of the 423% lies at $60 but in reality, BOA will have to make additional three wave patterns on the monthly chart to achieve this. It is first the 200% will be the target if price breaks above $37 and the next stop would be the $48 area for the Fibonacci 261%.
To finalize, If BOA can break above $37 it looks to be in a bullish mode that could see target $44 hit relatively quickly in 30-60 days potentially. If price breaks below $29 from now on, any bullish pattern would be rendered a fail.
About the Three Wave Theory
The three wave theory was designed to be able to identify exact probable price action of a financial instrument. A financial market cannot navigate it’s way significantly higher or lower without making waves. Waves are essentially a mismatch between buyers and sellers and print a picture of a probable direction and target for a financial instrument. When waves one and two have been formed, it is the point of higher high/lower low that gives the technical indication of the future direction. A wave one will continue from a low to a high point before it finds significant enough rejection to then form the wave two. When a third wave breaks into a higher high/lower low the only probable numerical target bearing available on a financial chart is the equivalent of the wave one low to high point. It is highly probable that the wave three will look to numerically replicate wave one before it makes its future directional decision. It may continue past its third wave target but it is only the wave one evidence that a price was able to continue before rejection that is available to look to as a probable target for a third wave.
Be the first to comment