

AUD/USD gained bearish momentum below the 0.7400 support zone. NZD/USD started a major decline after it faced sellers near 0.6815.
Important Takeaways for AUD/USD and NZD/USD
· The Aussie Dollar started a fresh decline after it struggled near 0.7450 against the US Dollar.
· There was a break below a key bullish trend line with support near 0.7390 on the hourly chart of AUD/USD.
· NZD/USD also started a major decline after it failed to stay above 0.6800.
· There was a move below a key bullish trend line with support near 0.6740 on the hourly chart of NZD/USD.
AUD/USD Technical Analysis
The Aussie Dollar faced a strong selling interest near the 0.7450 level against the US Dollar. The AUD/USD pair started a major decline below the 0.7420 level.
There was a clear move below the 0.7400 and 0.7380 support levels. The pair even declined below the 0.7350 support level and the 50 hourly simple moving average. Besides, there was a break below a key bullish trend line with support near 0.7390 on the hourly chart of AUD/USD.
The pair traded as low as 0.7332 on FXOpen and is currently consolidating losses. On the upside, the AUD/USD pair is facing resistance near the 0.7350 level.
The next major resistance is near the 0.7360 level. It is near the 23.6% Fib retracement level of the recent drop from the 0.7457 swing high to 0.7332 low. The first major resistance is now forming near the 0.7400 level.
The 50% Fib retracement level of the recent drop from the 0.7457 swing high to 0.7332 low is also near the 0.7395 level. A close above the 0.7400 level could start a steady increase in the near term. The next major resistance could be 0.7450.
On the downside, an initial support is near the 0.7330 level. The next support could be the 0.7300 level. If there is a downside break below the 0.7300 support, the pair could extend its decline towards the 0.7250 level. Any more downsides might send the pair toward the 0.7220 level.
NZD/USD Technical Analysis
The New Zealand Dollar also followed a similar path from the 0.6815 zone against the US Dollar. The NZD/USD pair gained pace below the 0.6780 support zone.
The pair traded below the 0.6750 and 0.6720 support levels. Besides, there was a move below a key bullish trend line with support near 0.6740 on the hourly chart of NZD/USD. The pair even broke the 0.6700 level and traded as low as 0.6698.
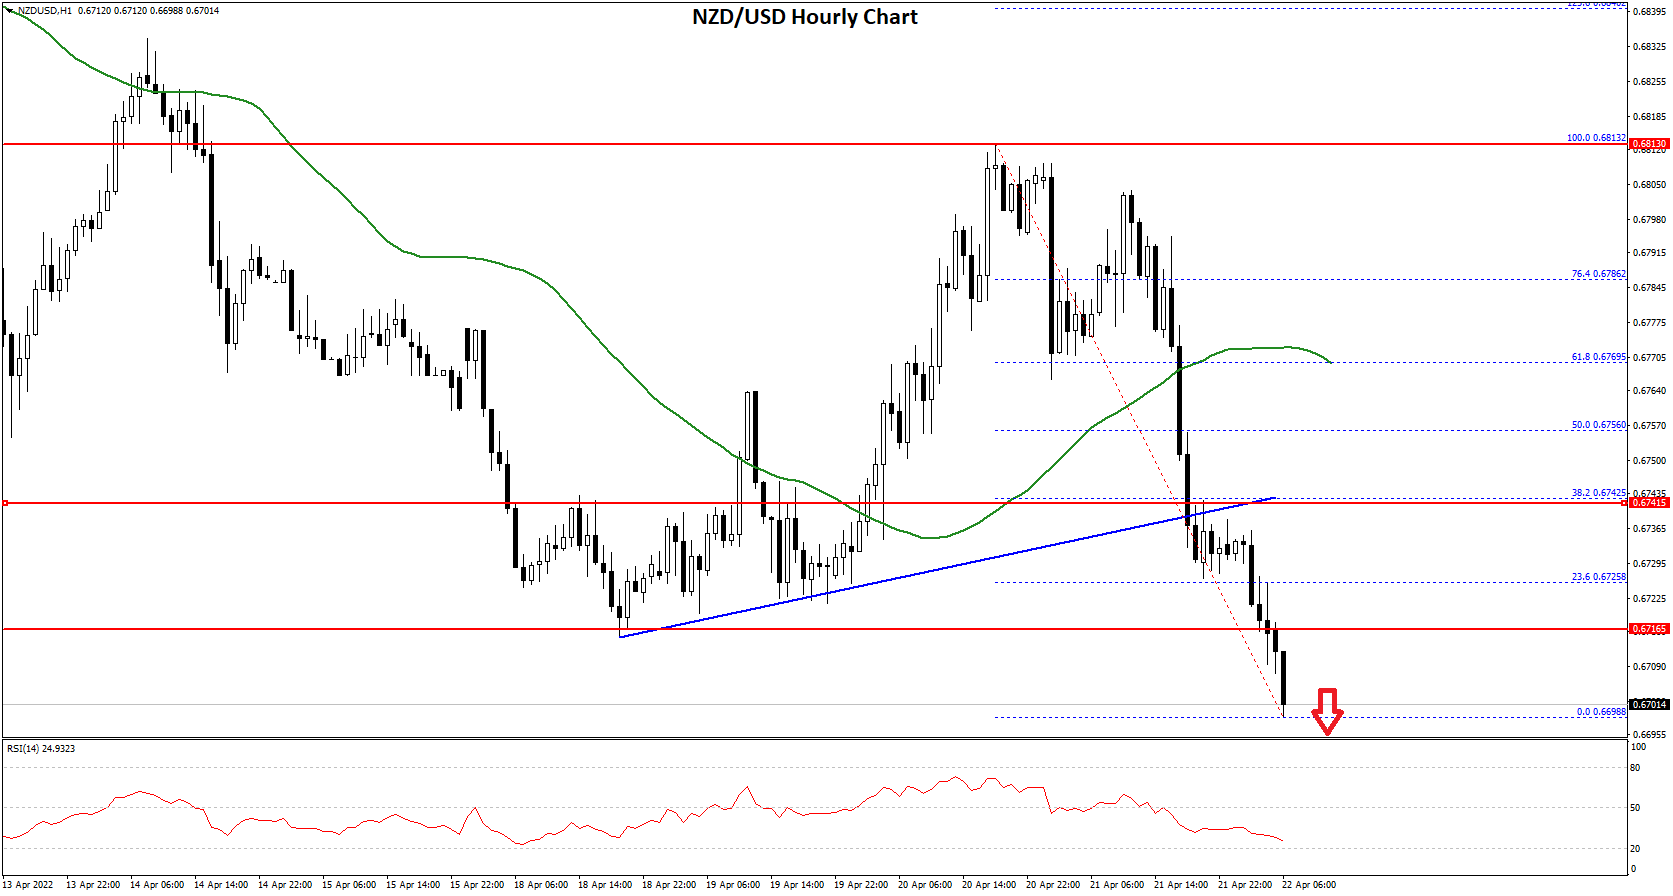
On the upside, an initial resistance is near the 0.6715 level. The next major resistance is near the 0.6725 level. It is near the 23.6% Fib retracement level of the recent drop from the 0.6813 swing high to 0.6698 low.
The first major resistance is now forming near the 0.6750 level. It is close to the last breakdown zone and the 38.2% Fib retracement level of the recent drop from the 0.6813 swing high to 0.6698 low.
A clear move above the 0.6750 level might even push the pair towards the 0.6780 level. On the downside, an initial support is near the 0.6695 level. The next support could be the 0.6680 zone. If there is a downside break below the 0.6680 support, the pair could extend its decline towards the 0.6650 level.
This forecast represents FXOpen Markets Limited opinion only, it should not be construed as an offer, invitation or recommendation in respect to FXOpen Markets Limited products and services or as financial advice.

Be the first to comment