

Justin Sullivan
AT&T Inc. (NYSE:T) recently declared its Q4 earnings as covered by Seeking Alpha here. EPS beat while revenue missed expectations, although it was up marginally YoY. The market seemed to like the results as the stock went up 6% after earnings, thereby notching a six-month high as reported by Seeking Alpha here.
I have a history of analyzing AT&T’s free cash flow (“FCF”) before and after earnings, as covered in this article after 2022 Q3 results. But why FCF, you may ask?
Why cash flow over EPS
When evaluating dividend coverage, most investors and analysts tend to look at earnings per share [EPS]. I prefer free cash flow as a better indicator of financial health for these reasons:
- Earnings tend to be up and down depending on rare events and write-offs.
- Earnings are more prone to GAAP-related fluctuations.
- Cash flow is king.
Add to this the fact that the company’s unusually stronger free cash flow guidance had raised expectations as can be seen here.
Let’s see how AT&T’s fourth quarter results stack up from this perspective. Did AT&T deliver?
- Total shares outstanding: 7.128 Billion
- Current quarterly dividend per share: $0.2775
- Quarterly FCF required to cover dividends: $1.978 Billion
- FCF in Q4: $6.103 Billion, as shown in the table below.
- Payout ratio using Quarterly FCF: 32.41% ($1.978 Billion divided by $6.103 Billion)
- EPS reported: 61 cents
- Payout ratio using Quarterly EPS: 45% ($0.2775 divided by $0.61)
ATT FCF (Seekingalpha.com)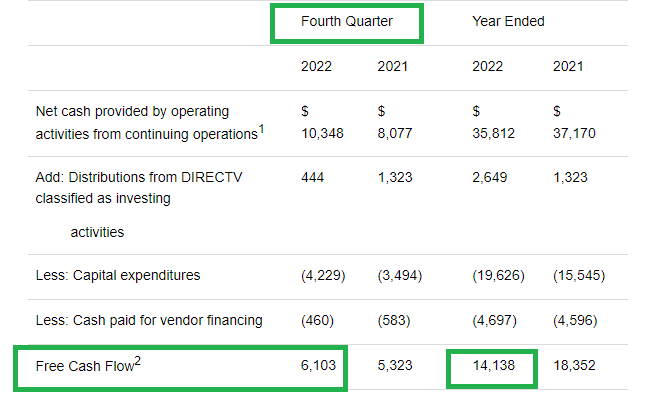
The short answer to the question “Did AT&T Deliver?” is an emphatic yes. The FCF payout ratio for Q3 was 51% while in Q4 the number fell to 32.41%. Although AT&T’s quarterly numbers look healthy above, will the annual numbers tell us a different story? After all, this is a company that has hurt investors with questionable decisions that led to insurmountable debt. Let’s find out.
- Total shares outstanding: 7.128 Billion
- Current annual dividend per share: $1.11
- Annual FCF required to cover dividends: $7.91 Billion
- FCF in FY 2022: $14.138 Billion, which came in slightly above the $14 Billion that AT&T had projected.
- Payout ratio using Annual FCF: 55.94% ($7.91 Billion divided by $14.138 Billion)
- Lower end of projected forward EPS: $2.35
- Payout ratio using Annual EPS: 47.23% ($1.11 divided by $2.35)
How do we look?
In comparison to end of Q3, EPS based payout ratio has gone up a little while FCF based payout ratio has gone down significantly due to the massive FCF in Q4. Notice that I used the lower end of the projected EPS above as AT&T has guided for FY 2023 EPS of $2.35 to $2.45, including a 25 cents impact due to a combination of pension costs, interest rates and taxes. I expect AT&T to have these issues periodically given their high pension obligations plus the obvious fact that rates and taxes are out of their control.
Back to this quarter’s results, key highlights include the following:
- AT&T showed a great deal of strength in post-paid net adds with 656K added, which handily beat the 644,800 estimated. This number gets even more impressive when you compare it to Verizon’s (VZ) 217K. AT&T’s promotions were deemed a bit aggressive in the recent past but the strategy appears to be vindicated.
- Business wireline is declining as expected but Mobility and Consumer wireline more than offset the former.
- Post prepaid and post-paid churn rates were fractionally lower in Q4 YoY.
Looking Forward
- AT&T has guided $16 Billion in Free cash flow for FY 2023, which once again shows their renewed confidence. Assuming dividends and total shares outstanding remain the same, a FCF of $16 Billion will result in a payout ratio of 49%, down from the current 56% calculated above.
- Using the guided EPS range of $2.35 to $2.45, AT&T’s stock is trading at a forward multiple of 8.15 to 8.50. Now, before we pound the table that the stock is a bargain, let’s not forget the expected EPS growth rate of 1.69%/yr for the next five years. That means, the stock is trading at a Price-Earnings/Growth (“PEG”) of ~5.
- However, with a yield of 5.50%, AT&T makes up for the lack of growth. But the key is knowing why you own a particular stock. I, like a vast majority of investors, hold AT&T for its dividends and for a change, it appears like the dividend is well covered as long as the company retains its recently found discipline.
- A median price target of $22 represents a 10% upside from here. This does not appear too appealing to me after the run up from $16 to $20 in about three months. AT&T is likely to remain a range bound stock and will likely present opportunities to buy in the mid to high teens if you are a patient.
Conclusion
John Stankey had his share of doubters when he took over the reign at AT&T and it is hard to blame them. After all, he was “one of them” given his history at the company and he led the DirecTV and Time Warner acquisitions. Naturally, investors worried about overall management but especially the debt situation. To the surprise and relief of investors, AT&T’s debt has stayed flat since the Warner Bros. Discovery, Inc. (WBD) spin off and it appears like the company has suddenly realized its best (and quite simple) strategy: be the best possible telecom player in the market.
AT&T’s stock was at $16.21 when I reviewed its Q3 dividend coverage and since then, the stock has outperformed S&P 500 by about 15%. Although the dividend coverage looks strong, I rate the stock a “Hold” if you already have a position in the stock. If you are looking at initiating a position for the first time, this may not be a bad time as the technical strength shown below augurs well for the immediate future.
ATT Stock (Barchart.Com)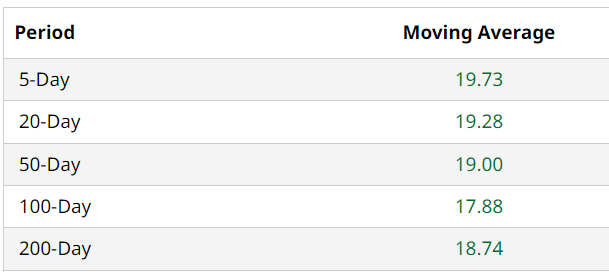
What do you think about AT&T’s Q4 earnings, in particular, and the stock in general? Please leave your comments below.
Be the first to comment