


Many pundits argue that Atlassian is significantly over-priced compared to it’s peers. I argue; “It’s lonely at the top.”
deepblue4you/E+ via Getty Images
Investment Thesis:
Atlassian (NASDAQ:TEAM) gets a bad rap across the investing space for its sky-high valuation, with many pundits suggesting investors shun the high-growth stock and look elsewhere given the 180 price-to-earnings ratio.
The tech firm’s share price has tumbled 43% since its 2021 high of $483 but TEAM has already shrugged off the March 2022 tech sell-off (dipping to $238 and then returning to the $270-$290 range).
I believe that the bullish case for TEAM is to ignore P/E on its own for the firm, and consider more closely the following factors:
- Exceptional historic revenue & customer count growth and forecast growth
- TEAM is investing (and divesting) with a strategic long term view
- Strong underlying cash flows fueling growth
- A healthy balance sheet
- Reasonable price vs growth metrics
I am not suggesting however that TEAM does not come without downside risks and point to numerous downward revisions of forecasts as perilous to the share price.
Let’s explore…
TEAM By The Numbers: Revenue Growth & Customer Count Growth
Over the last 5 years, TEAM revenue has increased exponentially (26.84% CAGR), with positive forecasts indicating a continuation of this trend.
Customer counts have risen quickly with average quarterly customer growth of 6% per quarter, from 89k customers in Q4 2017, to 226k in Q2 2022.
(Note the following customer count numbers include new customers through acquisitions and changes to the firm’s definition of customers)
| Year | Quarter | New | Total | Growth |
| 2017 | Q1 | 4,723 | 65,673 | |
| 2017 | Q2 | 3,164 | 68,837 | 5% |
| 2017 | Q3 | 16,194 | 85,031 | 24% |
| 2017 | Q4 | 4,206 | 89,237 | 5% |
| 2018 | Q1 | 4,246 | 107,746 | 5% |
| 2018 | Q2 | 4,825 | 112,571 | 4% |
| 2018 | Q3 | 6,587 | 119,158 | 6% |
| 2018 | Q4 | 6,638 | 125,796 | 6% |
| 2019 | Q1 | 5,888 | 131,684 | 5% |
| 2019 | Q2 | 6,551 | 138,235 | 5% |
| 2019 | Q3 | 5,803 | 144,038 | 4% |
| 2019 | Q4 | 8,689 | 152,727 | 6% |
| 2020 | Q1 | 7,060 | 159,787 | 5% |
| 2020 | Q2 | 5,003 | 164,790 | 3% |
| 2020 | Q3 | 6,261 | 171,051 | 4% |
| 2020 | Q4 | 3,046 | 174,097 | 2% |
| 2021 | Q1 | 8,620 | 182,717 | 5% |
| 2021 | Q2 | 11,617 | 194,334 | 6% |
| 2021 | Q3 | 18,473 | 212,807 | 10% |
| 2021 | Q4 | 23,311 | 236,118 | 11% |
| 2022 | Q1 | 11,746 | 216,500 | 5% |
| 2022 | Q2 | 10,021 | 226,521 | 5% |
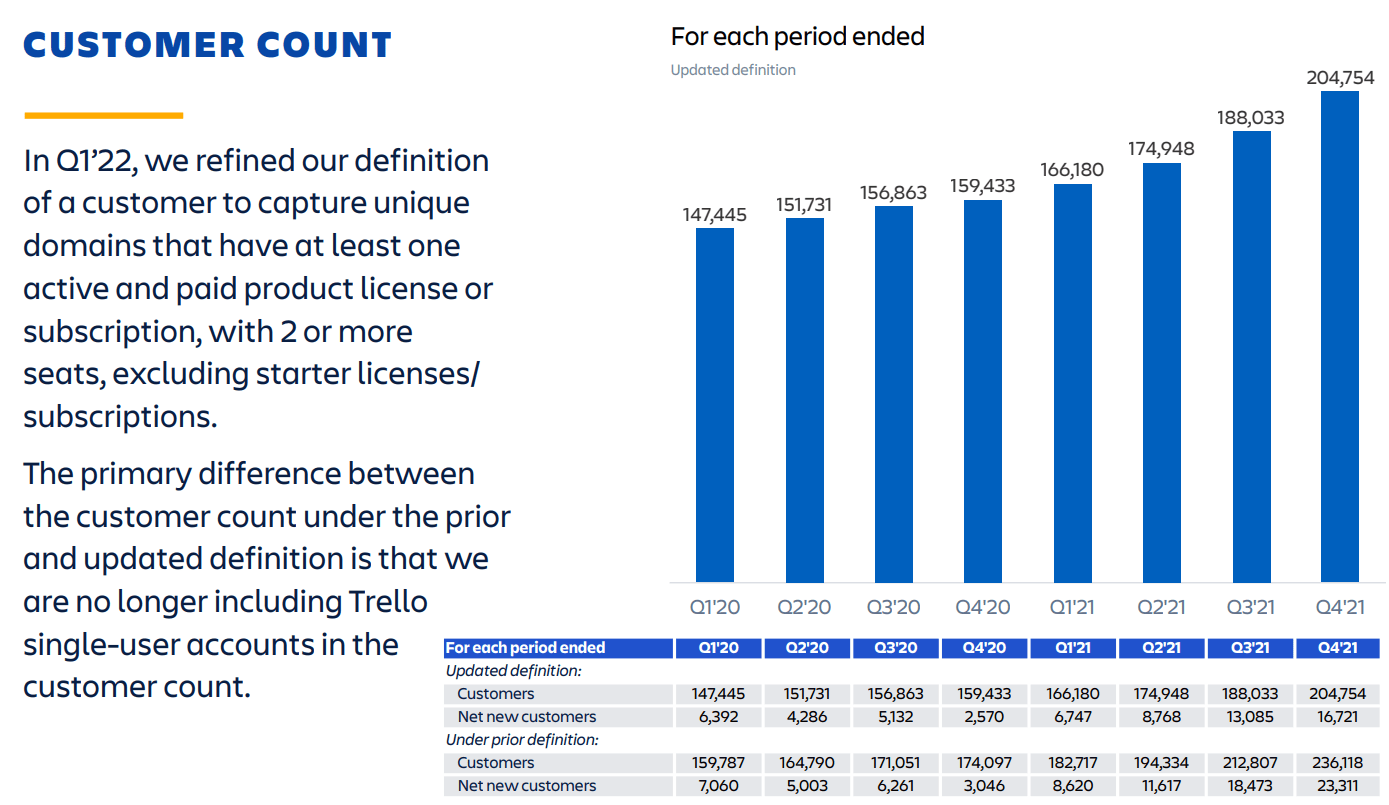
TEAM customer count, new definitions vs old definitions (investors.atlassian.com)
And while customer counts and revenue overall has been increasing, so too has revenue per customer.
A 38% rise in revenue per Customer over 2 and a half years is significant and shows that TEAM has been able to value add over and over again across its customer base. This is especially significant given the growth of the customer base underlying these figures, indicating new customers have been brought on and are paying higher prices potentially than earlier customers.
| Year | Quarter | $Rev/Customer |
| 2019 | Q4 | 2,026 |
| 2020 | Q1 | 2,102 |
| 2020 | Q2 | 2,273 |
| 2020 | Q3 | 2,250 |
| 2020 | Q4 | 2,302 |
| 2021 | Q1 | 2,220 |
| 2021 | Q2 | 2,274 |
| 2021 | Q3 | 2,416 |
| 2021 | Q4 | 2,227 |
| 2022 | Q1 | 2,614 |
| 2022 | Q2 | 2,808 |
Ongoing deeper customer penetration is an exceptional sign of the firm’s product quality and the customers’ willingness to stay with the firm.
TEAM By The Numbers: Strong Underlying Cashflows & Excellent Underlying Profitability
If you’re browsing the ratios of TEAM, you’ll undoubtedly come across the firm’s negative net income margins and see a picture of a loss-making firm as it undergoes significant growth.
However, examining the underlying cash flows, which excludes cash from financing (which can heavily skew net income ratios), shows that TEAM has been operating efficiently and effectively generating cash that provides the firm unlimited runway for growth.
Underlying cash flows are calculated as: Underlying Cash Flows = Cash from Operations + Cash from Investing
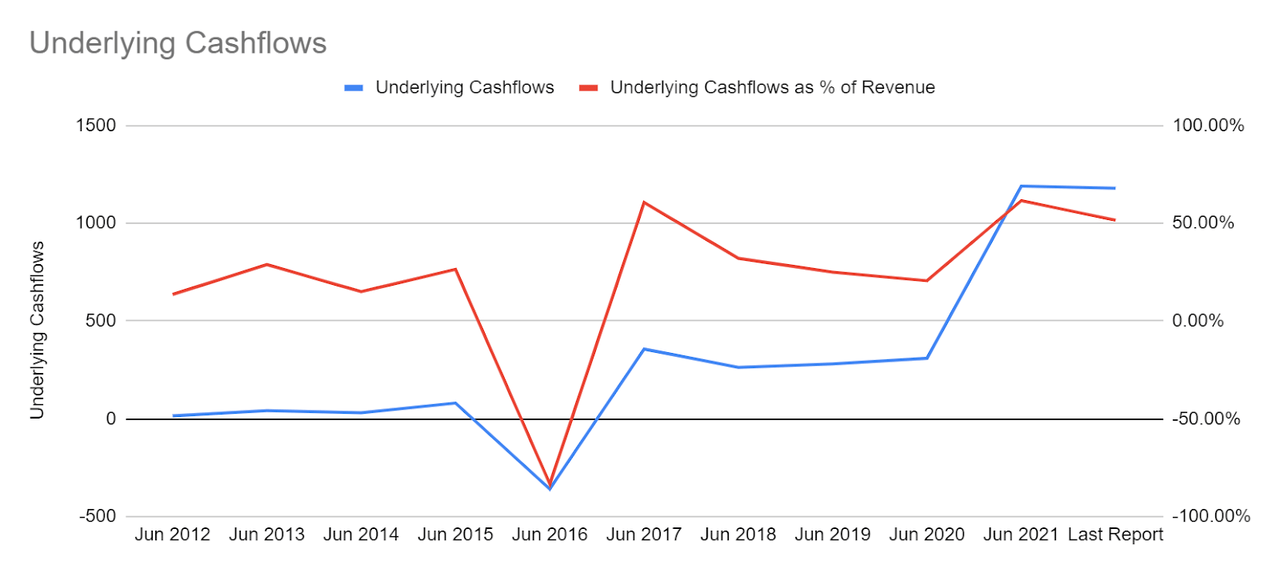
TEAM Underlying Cashflow (Source: Author)
TEAM’s gross profit figures are exceptional and TEAM is one of the leaders in the Application Software industry for gross profit margin at 83.78%, vs the Information Technology sector median of 49.58%.
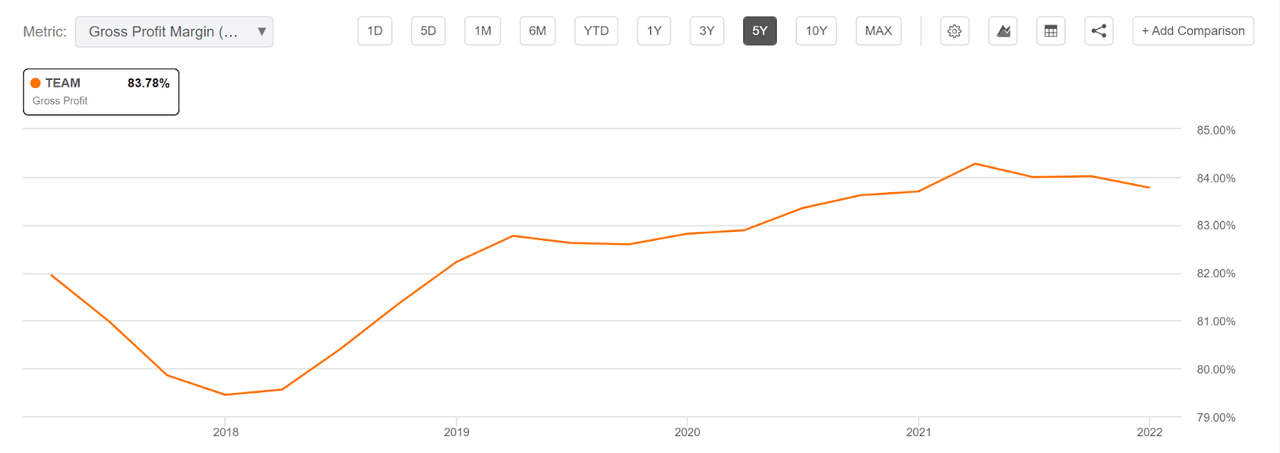
TEAM gross profit margins (Source: SA)
SG&A expenses as a % of revenue have also fallen steadily over time, with margins falling from 42% to 34%, indicating falling costs of client acquisition.
SG&A margin is a factor I like to watch carefully, especially in growing companies, as this is a good sign of whether a firm is paying too much for growth or has excellent organic growth.
However this doesn’t factor in acquisitions, which TEAM has been doing over the years, so these figures may be skewed downwards.
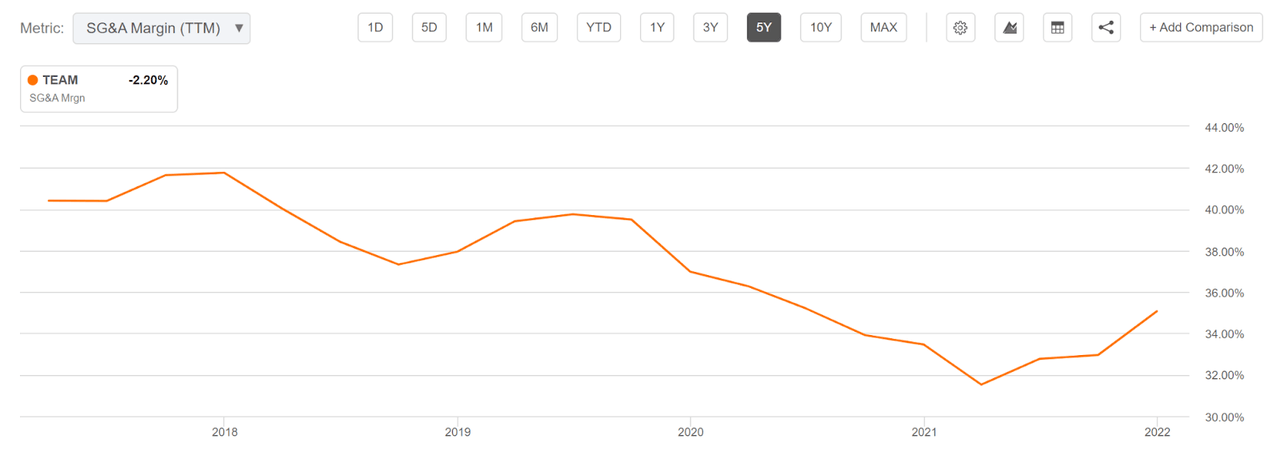
TEAM SG&A Margins (Source: SA)
Overall, TEAM is a solid performing growth firm that is setting itself up for massive profitability as it heads towards a critical mass, and therefore terminal value.
TEAM By The Numbers: A Look At The Balance Sheet
TEAM’s balance sheet is remarkably healthy, given the scale of recent acquisitions and the level of growth for the firm.
While the firm carries a debt/capital ratio of 88.43%, this debt is comfortably serviceable with a Current Ratio 1.08, Quick Ratio 0.98 and Covered Ratio 1.33.
Interestingly, the “Unearned Revenue” line of 913.9 makes up 72.5% of total liabilities. Given TEAM sells services, paid for in advance, this shouldn’t be too concerning, especially with a gross margin of around ~83%, this should only really be thought of as $155.36m in liabilities for services (not forgetting the gross profit margin of 83%). This would bring Total Current Liabilities down from $1,259.8m to just $501.26m, just 39.7% of its current figure.
Given the rate of growth and underlying cash flows, I see no concerns on the balance sheet here.
Should the need to raise further capital arise, TEAM is well-positioned with 45% of its equity still held ready to float. I believe a debt raise should be no issue either.
A Catalyst For Value: A Leading R&D Expense
According to TEAM’s FY21 Investor Day presentation, the firm has a market-leading investment in R&D by % of revenue, indicating their commitment to continuous product development and improvement.
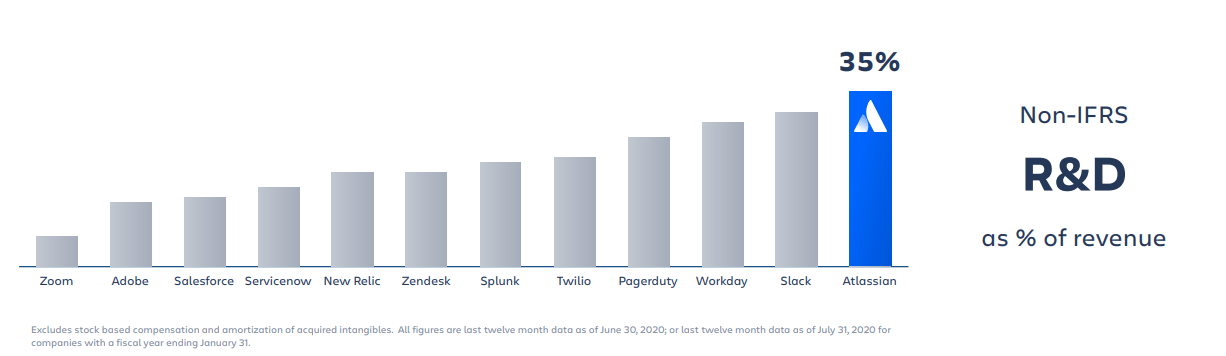
TEAM Vs Competitor R&D Investment Comparison (Source: TEAM Investor Day Presentation)
But delving deeper into TEAM’s investor day presentation, you will uncover a very interesting comment on how the R&D budget is allocated.
TEAM is famous for its focus on innovation through events like “ShipIt”, “20% Time” and it’s “innovate every day” ritual. But TEAM has taken these innovative activities a step further, with a process of review for employees able to access funding and resources to act on an idea they have at any time.
All this innovation and investment is designed to help TEAM create what it terms “durable growth”, where they seek to create their next “$100 million product”.
Risk Factor: End Of Server Products
20% of TEAM’s quarterly revenue in Q2 came from Server products, however, the firm plans to exit this space. While other SA writers have concerns that ending a product suite responsible for 20% of top-line revenue would be severely damaging to the business and present a huge risk, the Q2 shareholder letter acknowledged that “cloud revenue was up 58% YoY, and one-third of all cloud migrations in Q2 came from their server product clients.”
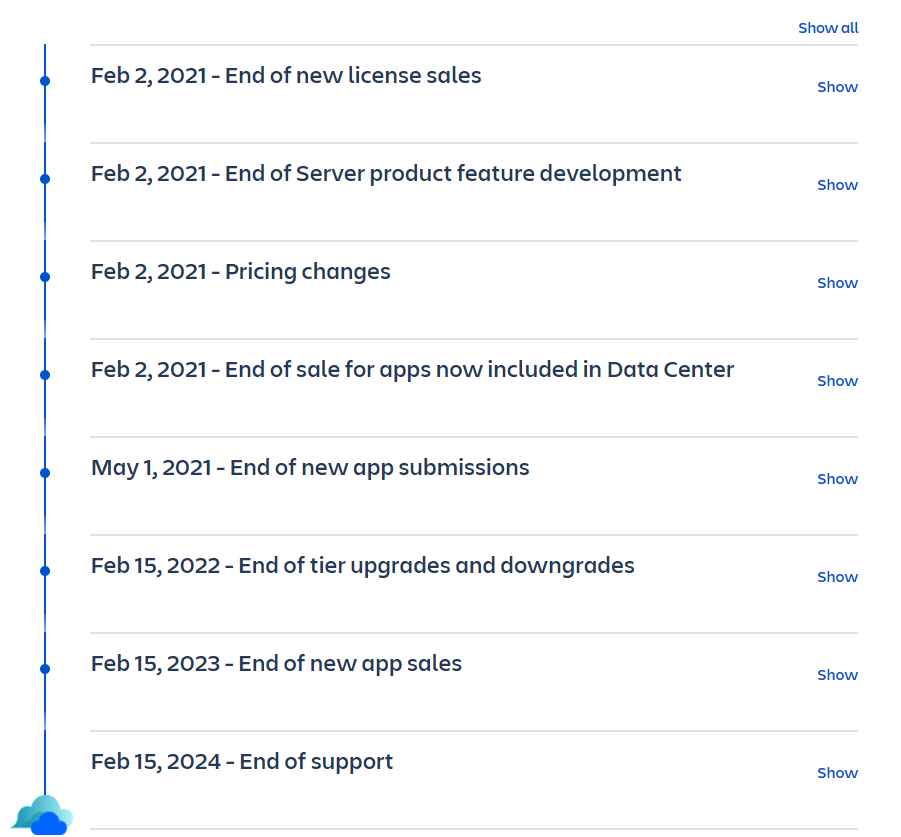
Timeline for the phasing out of Atlassian server products (atlassian.com)
I believe that the decision to end this product represents a strategic decision by the firm to take a long-term view of the tech industry, TEAM’s own future, and bring its product offerings in-line with that view.
Valuation To Peers
The most obvious place to start with addressing TEAM’s valuation is it’s P/E ratio, given it is sky-high at 174 and widely criticised for being so large. But despite this, looking across the Application Software space, this would only put TEAM in the top 4 highest P/E ratios for the industry. (Similarly, TEAM’s FWD P/E places it 3rd highest)
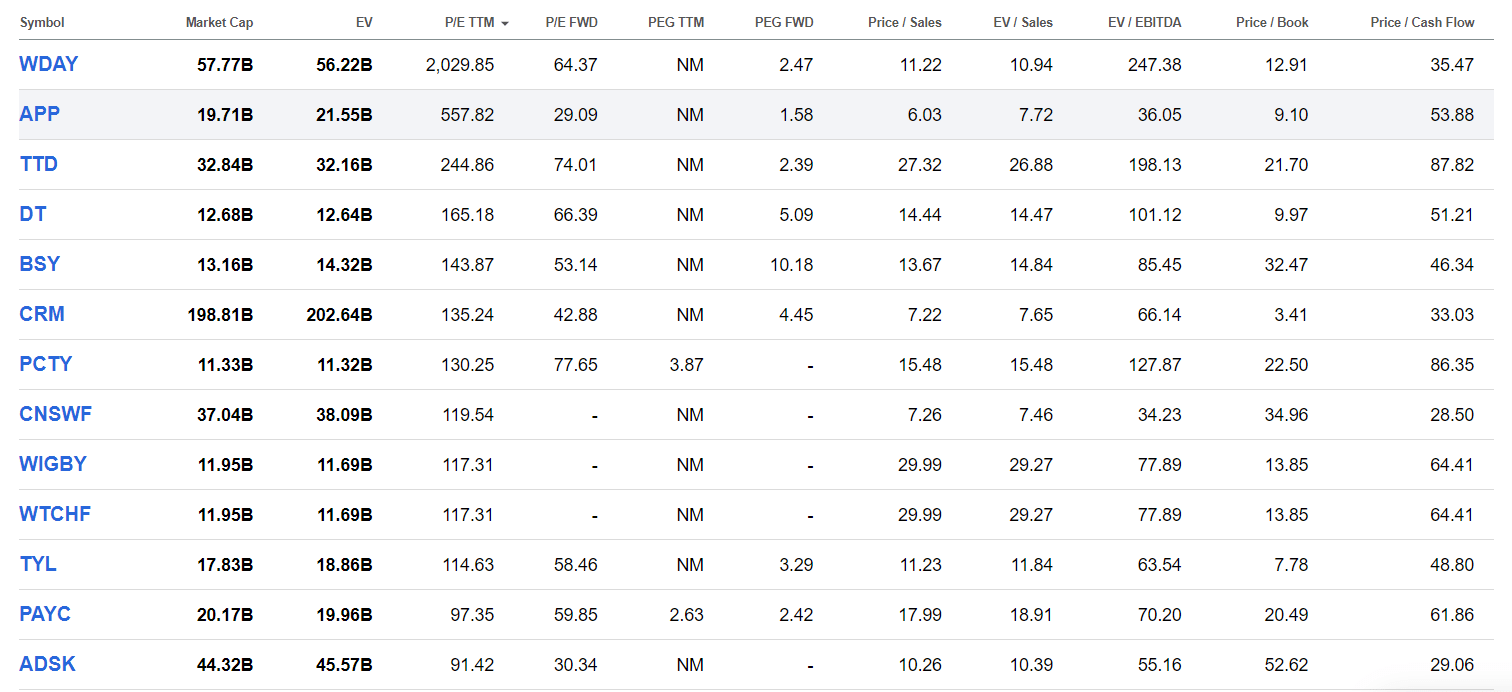
The top Application Software stocks by market cap (Seeking Alpha)
Things get interesting when we look at customer counts, and compare these to market caps and revenue, however.
Looking at just the top 6 firms by market cap, we see that TEAM has a very “middle” market cap per customer (the price investors are paying per customer) and also a very “middle” revenue per customer ratio.
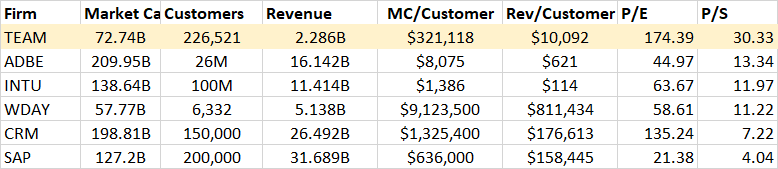
Comparing the top 6 firms by customer counts, revenue and market cap. Note customer counts are estimates based on best available data from various sources, and not all reported by the firm themselves. (Author)
On a more detailed comparison basis however (you can find the Seeking Alpha peer comparison for these 6 firms here), you will see that Atlassian is the only A-Grade rated firm for growth in this list.
As the fastest growing firm, TEAM deserves to trade at a premium to its peers.
Comparing TEAM to the tech industry as a whole over the last 5 years shows us that the firm has outperformed strongly, especially post-COVID.
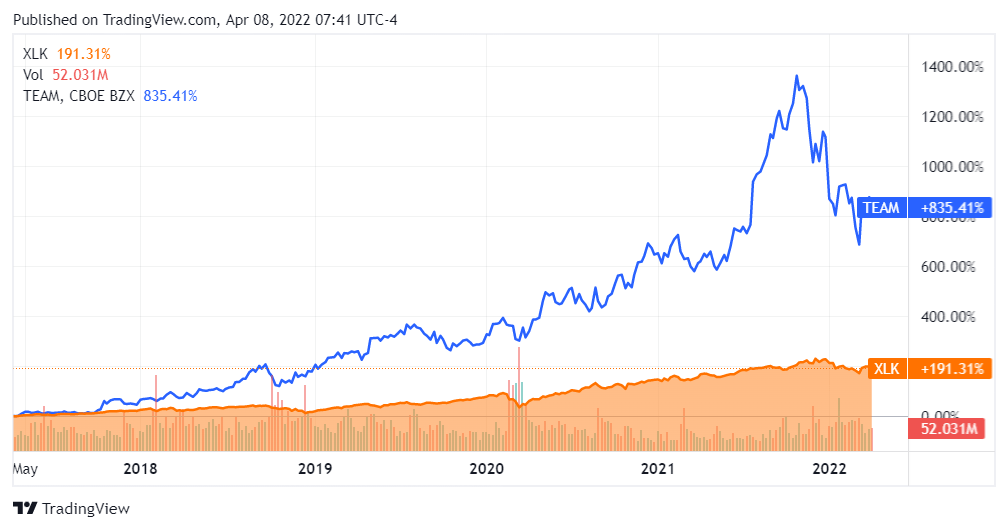
TEAM Vs Tech Sector Index (Trading View)
Pricing TEAM
There are already plenty of Seeking Alpha authors who will point to the P/E and P/S ratios and infer the firm is too expensive, so let’s try to create the argument for a modest bull position.
A bullish fundamental valuation of Atlassian at this P/E level means investors must lean heavily on growth metrics and forecasts in order to justify the current valuation and see a mispricing opportunity.
When we look at PEG ratios, Atlassian begins to look less expensive, and more like a reasonably priced growth firm.
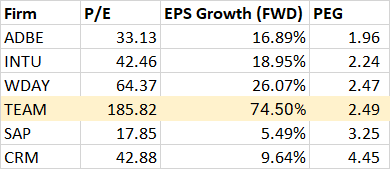
TEAM P/E, growth rates and PEG ratio vs Peers. (Author, Seeking Alpha Data)
Let’s take the average PEG among these 6 firms, 2.81 (marginally higher than TEAM’s current PEG), and the highest PEG on the market at 4.45. Let’s also consider the whole $10B+ Application Software industry average PEG ratio at 3.1.
Using these PEGs gives us the following valuations for TEAM.
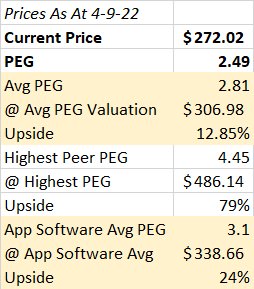
TEAM valuation using peers PEG ratios. (Author, Seeking Alpha Data)
The Application Software industry average PEG presents a reasonable central-scenario price target and presents an attractive reward for investors looking for a bullish scenario.
Interestingly, analysts on TEAM with price target ratings published in 2022 have all placed valuations within the above-calculated upside ranges.
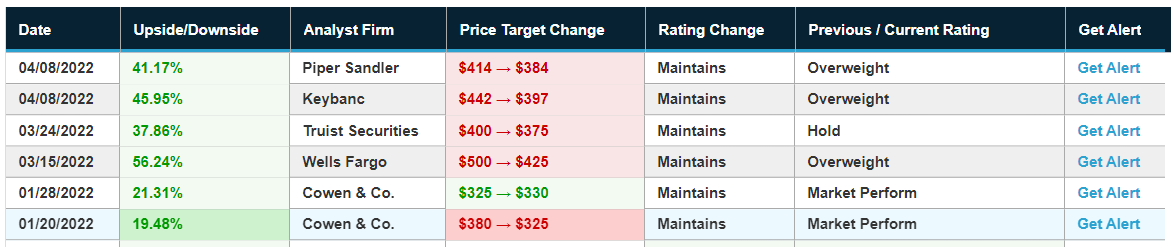
Analysts in 2022 are largely bullish on TEAM, though mostly scaling back previous price targets. (benzinga.com)
This could infer that analysts like the stock based on its growth trajectory, rather than its current earnings.
For investors considering the bullish case, this presents a risky situation where eyes should be focused firmly on earnings and revenue estimates. Given the valuation of the firm, and that it appears the market is pricing TEAM predominantly on its growth rather than earnings, any estimates revised down for the firm could have outsized negative impacts on the share price.
Conclusion: Looking Forward & Up
I hold a reasonably bullish view of TEAM, given its increasing subscriber growth, market-leading profitability, leading investment in R&D, and excellent underlying cash flows.
Investors must recognise the outsized risk of downward revisions on revenue and EPS estimates that exist for TEAM in particular, given that the stock price would be punished for not delivering on growth given the premium currently being paid for earnings.
Be the first to comment