

ruthrose/iStock via Getty Images
Foreword
While more than half this collection of Dow Industrials is too pricey and reveals only skinny dividends, the five lowest priced Dogs of the Dow are worth a look. This month none of the five lives up to the dogcatcher ideal of annual dividends from $1K invested exceeding its single share price. Those five, however, showed prices within $30.00 of meeting that goal.
With renewed downside market pressure of 40%, it would be possible for INTC, MRK, WBA, DOW, VZ, & IBM to become elite fair-priced dogs with their annual yield (from $1K invested) meeting or exceeding their single share prices by year’s end. However, exuberance remains un-checked in the 2022 market and the prices of all Dow stocks are currently up. Only VZ is within $1.02 of the dogcatcher ideal price vs dividend return.
[See a summary of top ten fair-priced March Dow Dogs in Actionable Conclusion 21 near the middle of this article.]
Actionable Conclusions (1-10): Brokers Expect 18.98% To 37.78% Net Gains From Top-Ten Dow Dogs As Of April, 2023
Two of ten top dividend-yielding Dow dogs were verified as also being among the top ten gainers for the coming year based on analyst 1-year target prices. (They are tinted gray in the chart below). So, this April, 2023 yield-based forecast for Dow dogs, as graded by Wall St. wizard estimates, was 20% accurate.
Estimates of dividend-returns from $1000 invested in the ten highest-yielding stocks and their aggregate one-year analyst median target prices, as reported by YCharts, created the 2022-23 data points for the projections below. Note: one-year target prices estimated by lone analysts were not applied. Ten probable profit-generating trades projected to March 30, 2023 were:
YCharts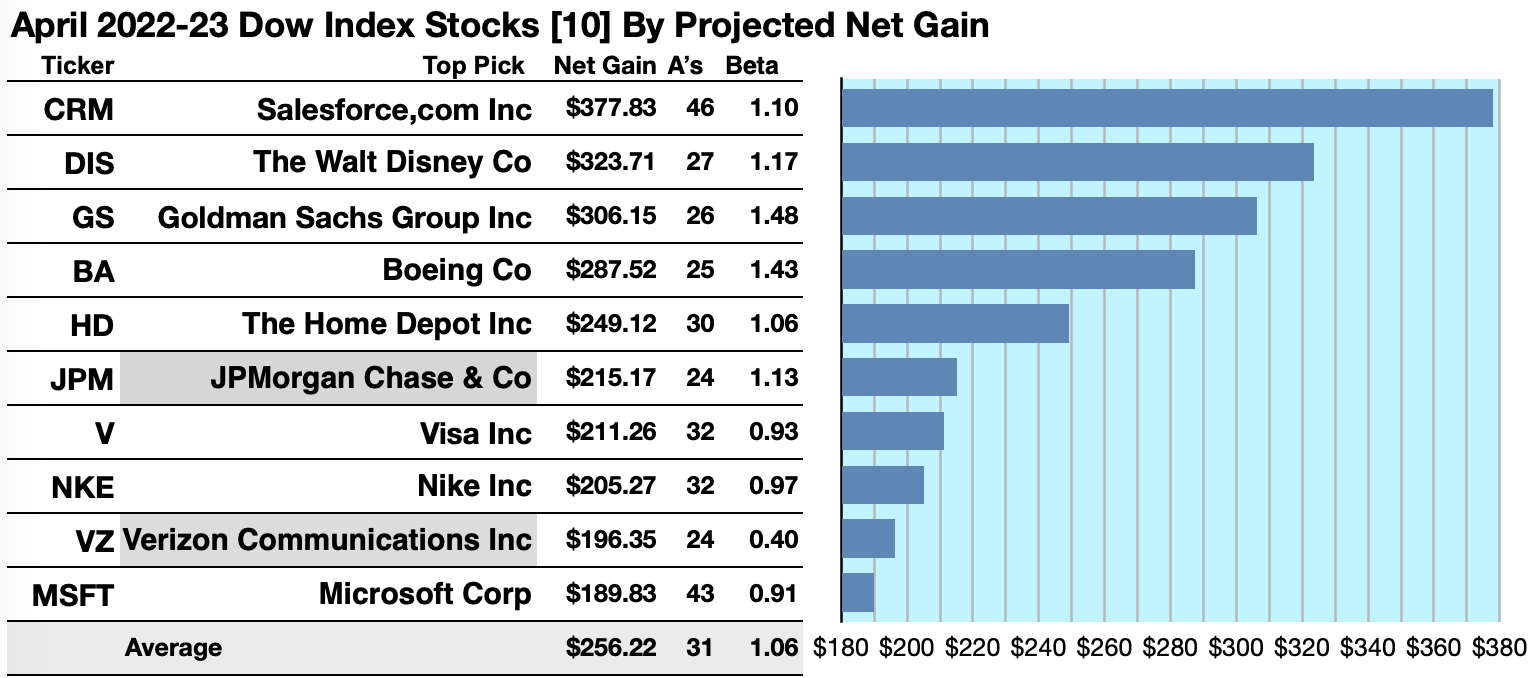
Salesforce.com Inc (CRM) was projected to net $377.83, based on the median of target prices estimated by forty-six analysts, less broker fees. The Beta number showed this estimate subject to risk/volatility 10% over the market as a whole.
The Walt Disney Co (DIS) was projected to net $323.71, based on the median of target estimates from twenty-seven analysts, less broker fees. The Beta number showed this estimate subject to risk/volatility 17% over the market as a whole.
Goldman Sachs Group Inc (GS) was projected to net $306.15, based on dividends, plus the median of target price estimates from twenty-six analysts, less broker fees. The Beta number showed this estimate subject to risk/volatility 49% over the market as a whole.
Boeing Co (BA) was forecast to net $262.58, based on the median of target price estimates from twenty-five analysts, including annual dividend, less broker fees. The Beta number showed this estimate subject to risk/volatility 43% greater than the market as a whole.
The Home Depot Inc (HD) was projected to net $249.12, based on the median of target price estimates from thirty analysts, plus the estimated annual dividend, less broker fees. The Beta number showed this estimate subject to risk/volatility 6% greater than the market as a whole.
JPMorgan Chase & Co (JPM) was projected to net $215.17 based on the median of target price estimates from twenty-four analysts, plus dividends, less broker fees. The Beta number showed this estimate subject to risk/volatility 13% greater than the market as a whole.
Visa Inc (V) was projected to net $211.26, based on dividends, plus the median of target price estimates from thirty-two analysts, less broker fees. The Beta number showed this estimate subject to risk/volatility 7% less than the market as a whole.
Nike Inc (NKE) netted $205.27 based on the median of target price estimates from thirty-two analysts, less broker fees. The Beta number showed this estimate subject to risk/volatility 3% less than the market as a whole.
Verizon Communications Inc (VZ) was projected to net $196.35, based on the median of target price estimates from twenty-four analysts, less broker fees. The Beta number showed this estimate subject to risk/volatility 60% under the market as a whole.
Microsoft Corp (MSFT) was projected to net $189.83, based on dividends, plus the median target price estimates from forty-three analysts, less broker fees. The Beta number showed this estimate subject to risk/volatility 9% less than the market as a whole.
The average net gain in dividend and price was estimated at 25.62% on $10k invested as $1k in each of these top ten Dow Index stocks. This gain estimate was subject to average risk/volatility 6% over the market as a whole.
Open source dogcart from Dividendogcatcher.com
The Dividend Dogs Rule
Stocks earned the “dog” moniker by exhibiting three traits: (1) paying reliable, repeating dividends, (2) their prices fell to where (3) yield (dividend/price) grew higher than their peers. Thus, the highest yielding stocks in any collection became known as “dogs.” More precisely, these are, in fact, best called, “underdogs”.
The April, 2022 Dow 30 By Yield
YChartscom/IndexArb.com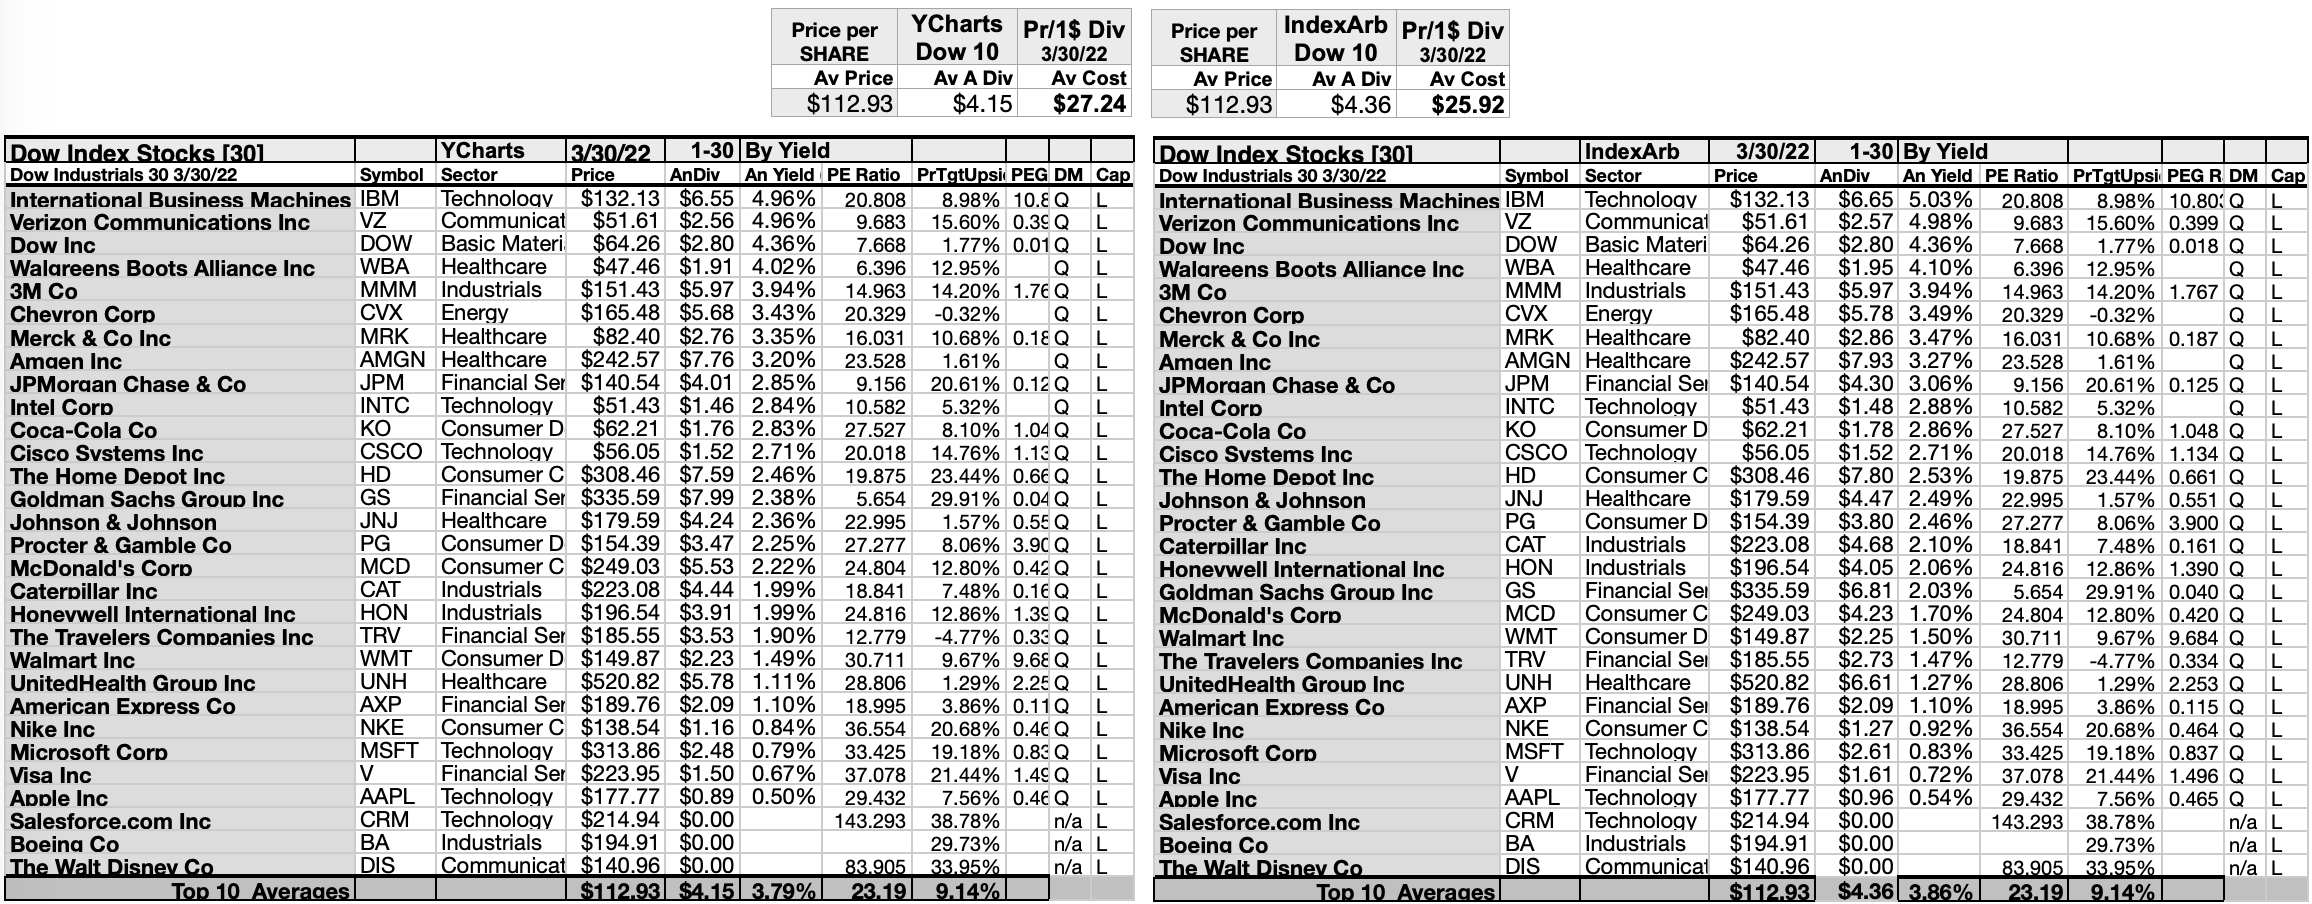
Actionable Conclusions (11-20): 10 Top Dow Dividend Stocks By Yield Ranged 2.84% To 4.96% Per YCharts And 2.88% To 5.03% Per IndexArb
Top ten Dow dogs as of 3/30/22 represented seven of eleven Morningstar sectors by YCharts and seven of eleven per IndexArb. All stocks were in the same order on the two lists by yield this month.
Both put the two technology dogs in the first and tenth positions, International Business Machines (IBM) [1] and Intel Corp (INTC) [10]. Second place went to the lone communication services sector member of the top ten, Verizon [2] on both lists.
Both YCharts and IndexARB put the lone basic materials dog in third place, Dow Inc (DOW) [3],
The lists agreed that the fourth, seventh and eighth place finishers, were all from the healthcare sector: Walgreen’s Boots Alliance (WBA)[4], Merck & Co Inc (MRK) [7] and Amgen Inc (AMGN) [8].
The health team surrounded the lone industrials dog in the top ten in fifth, 3M Co (MMM) [5], and a lone energy member, in sixth, Chevron Corp (CVX) [6].
Thereafter, the two lists agreed on the ninth place financial services firm, JPMorgan Chase & Co [9], to complete their April top ten dogs of the Dow by yield lists.
YCharts.com/IndexArb.om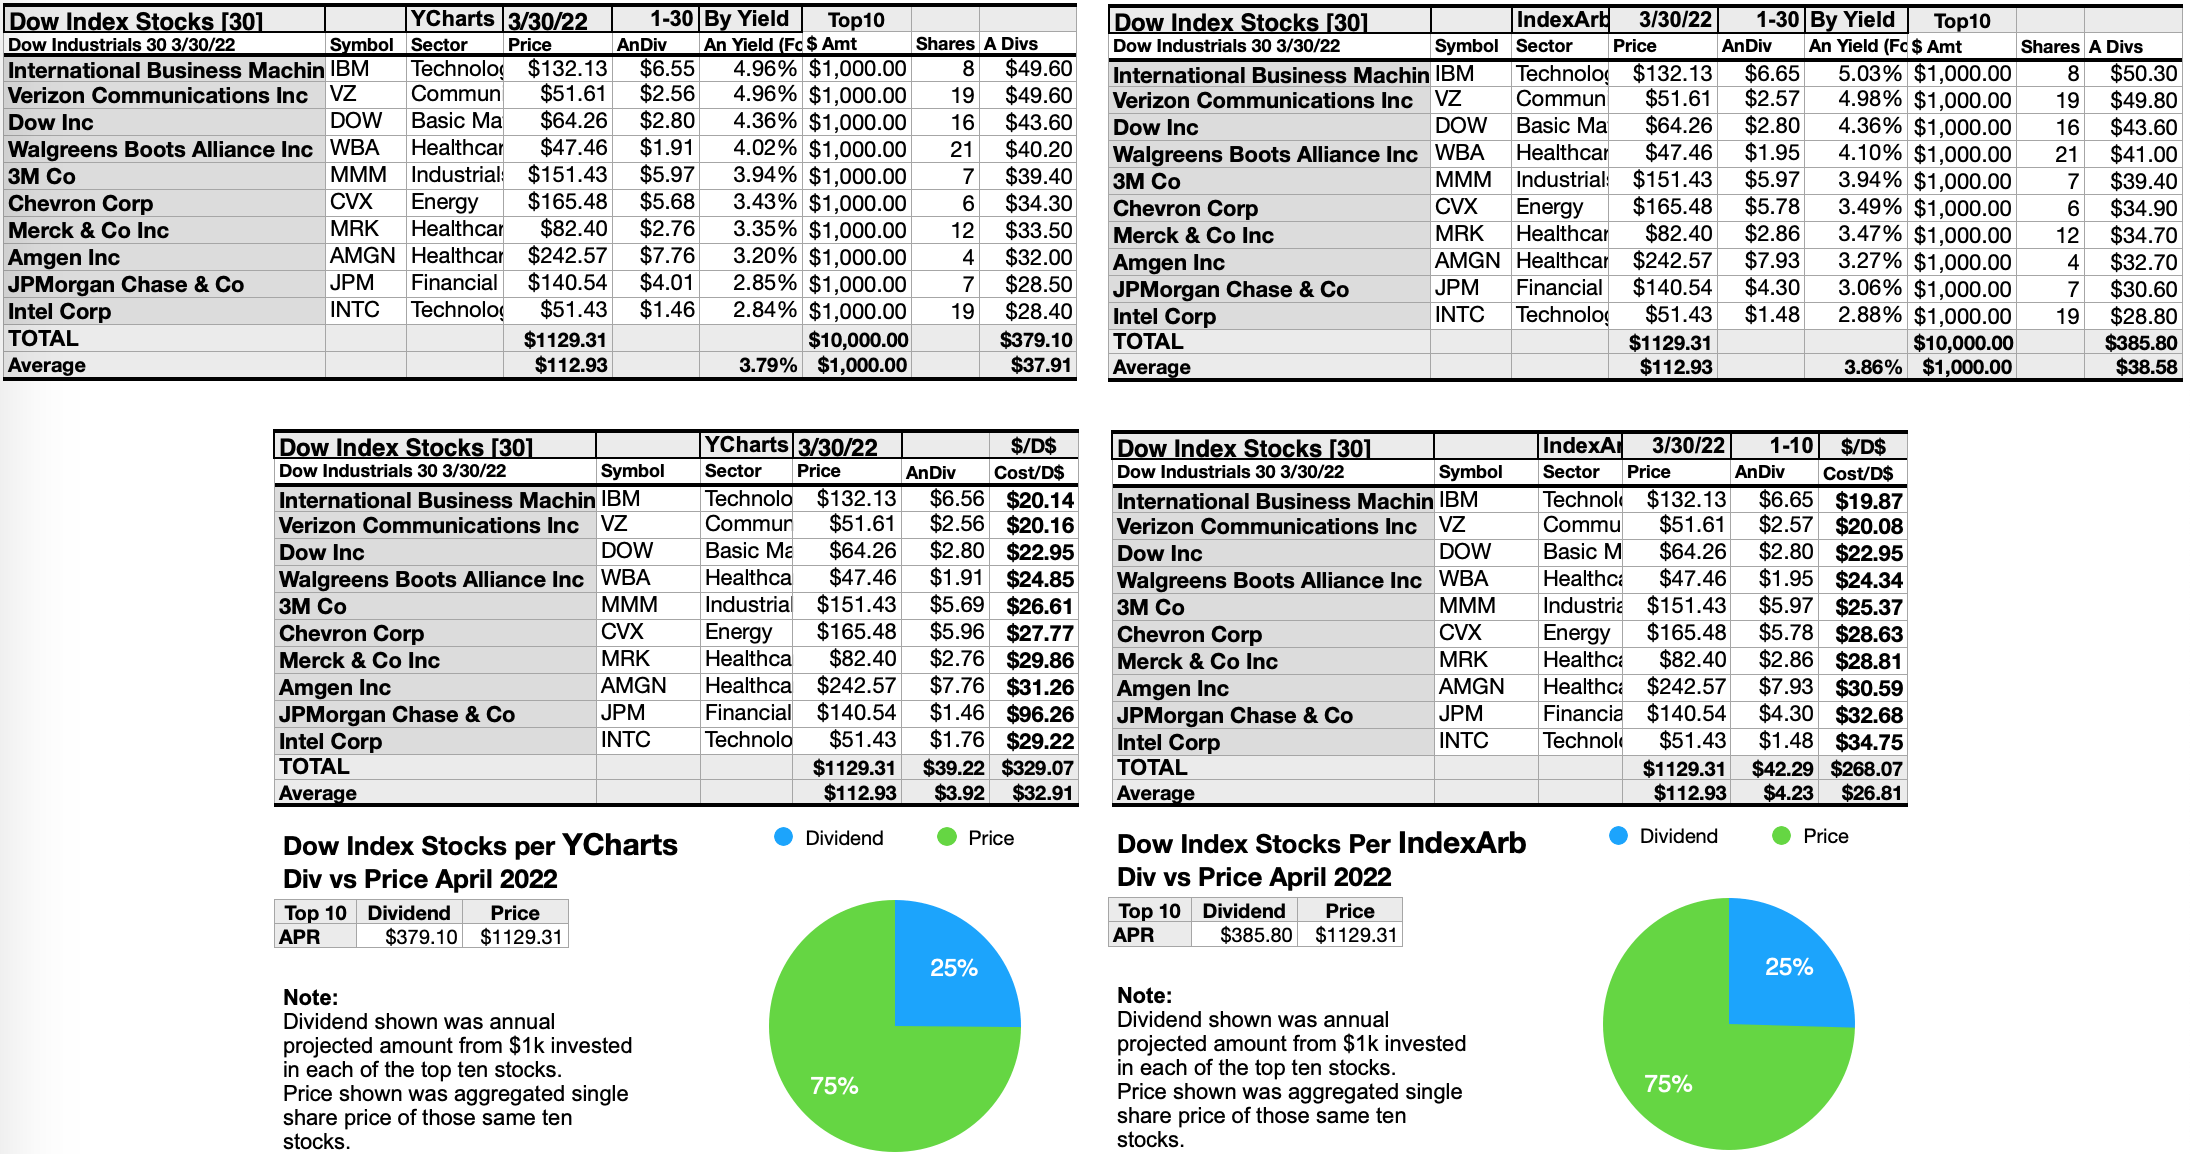
Dividend Vs. Price Results
Graphs above show the relative strengths of the top ten Dow dogs by yield as of market close 3/30/2022. The two sets of charts show the variation of dividends calculated by YCharts.com estimates and those from the arbitrage firm IndexArb.com. There was a $3.07 difference in estimated total single share dividends between YCharts and IndexArb top ten, resulting in a $6.10 total cost per dividend dollar differential. These numbers were not enough to impact the comparative percentages.
This month all of the top ten Dow dogs show an overbought condition (in which aggregate single share price of the ten exceeds projected annual dividend from $10k invested as $1k each in those ten). A dividend dogcatcher priority is to select stocks whose dividends from $1K invested exceed their single share price. That condition was again not reached by any Dow index members leading into April.
Actionable Conclusion (21): All Ten Top Dow Dogs Are Overbought
This gap between high share price and low dividend per $1k (or oversold condition) means, no matter which chart you read, all 27 Dow dividend payers are low risk and low opportunity dogs, with the non-dividend payers being particularly dismal. The Dow top-ten average cost per dollar of annual dividend for March 30, 2022 was $27.24 for YCharts or $25.92 by the IndexArb reckoning.
One that cut its dividend after March, 2020, Boeing (BA), has re-learned (and is now certified that it knows how to fly) and is thus prepared to take off again if someone ever orders planes made in the USA again. The used plane market, however, is soaring. BA may not ever recover from being in worse shape than was GE when excused from the Dow index. As for DIS, the magic kingdom may be close to reinstating a dividend but don’t hold your breath. However, the newest of the three latest no-dividend stocks on the block, CRM, is simply overpriced. Those three non-dividend payers are the true down in the dumps dogs of the Dow, despite analysts high-balling their future share price estimates.
Remember this dogcatcher yield-based stock-picking strategy is contrarian. That means rooting for (buying) the underdog is productive when you don’t already own these stocks. If you do hold these stocks, then you must look for opportune pull-backs in price to add to your position to best improve your dividend yield.
Price Drops or Dividend Increases Could Get All Ten Dow Dogs Back to “Fair Price” Rates For Investors
YCharts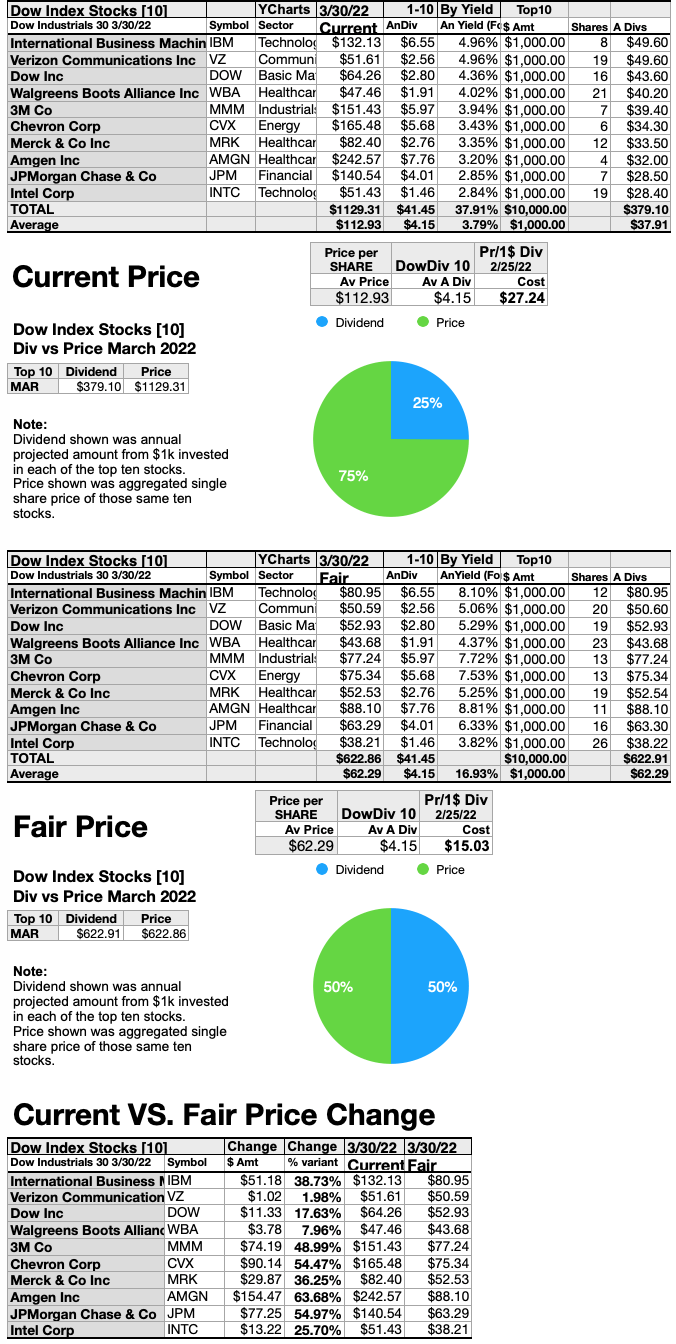
The charts above retain the current dividend amount and adjust share price to produce a yield (from $1K invested) to equal or exceed the single share price of each stock. As this illustration shows, none are ideally priced. Four low priced stocks are within $13.22 of making the grade (VZ; DOW; WBA; INTC).
Four more, however (MRK; IBM; MMM; JPM ) need to trim prices between $30 and $77.25. Then, two behemoth priced stocks hold the key to realizing the 50/50 goal for share prices equalling dividend payouts from $10k invested. If CVX could shed just $90.14, and Amgen could drop $154.47 in share price, the top ten as a group could attain that elusive 50/50 goal.
The alternative, of course, would be that these companies raise their dividends but that is a lot to ask in these highly disrupted, inflationary, and cash-rich times. Mr. Market is much more effective at moving prices up or down to appropriate size.
YCharts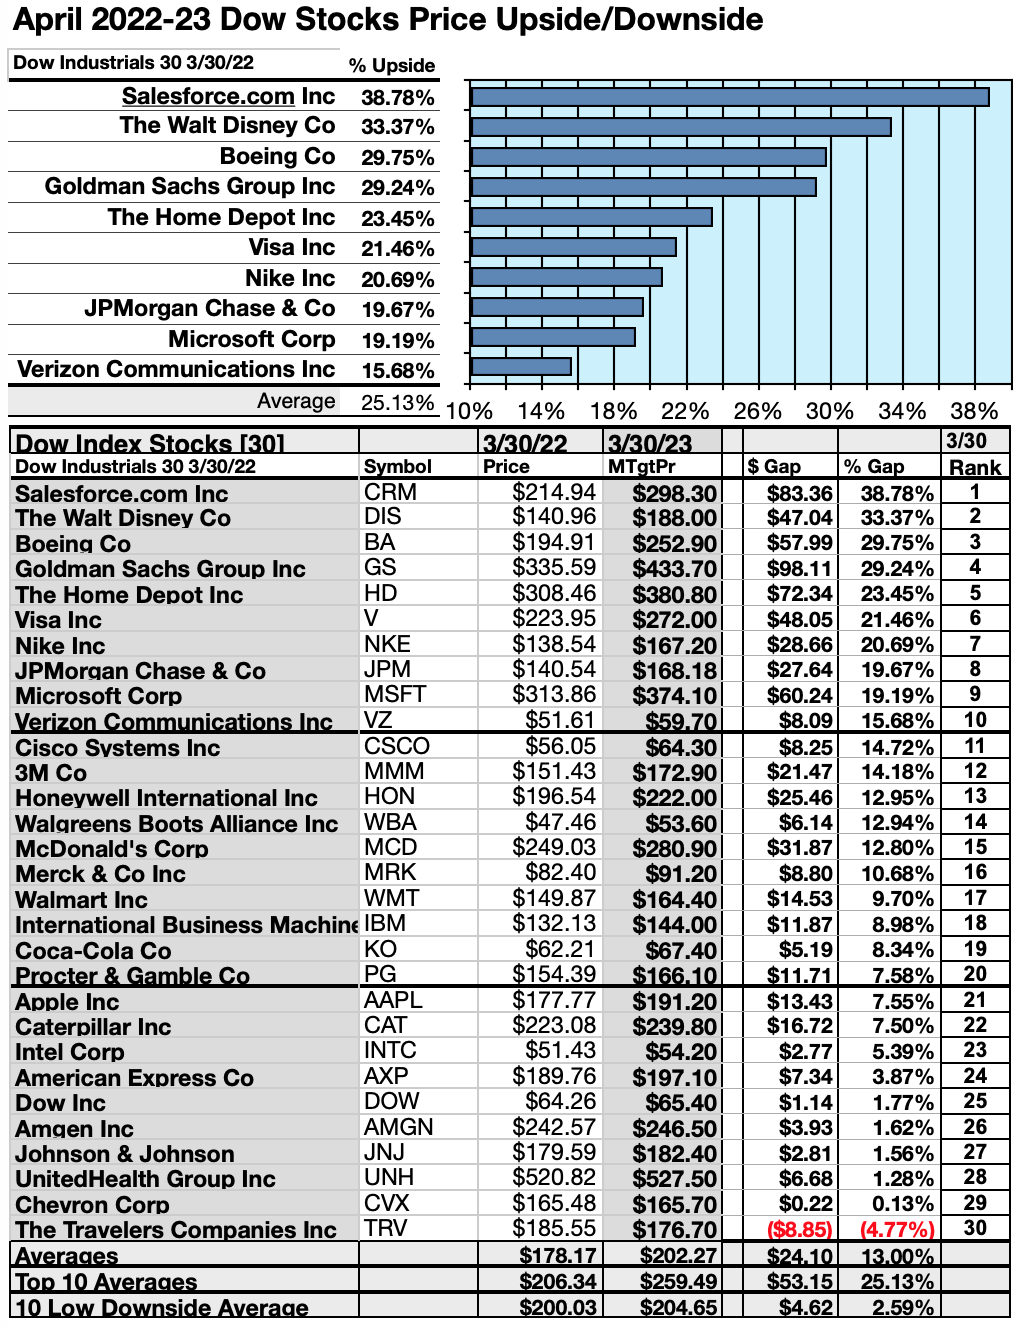
Actionable Conclusions: (22-31) The Dow Index Showed 15.68% To 38.78% Top Ten Upsides To April 1, 2023; (32) One Downside Was Revealed By Broker 1-Yr. Targets
To quantify top dog rankings, analyst median price target estimates provided a “market sentiment” gauge of upside potential. Added to the simple high-yield “dog” metrics, analyst median price target estimates provided another tool to dig out bargains.
Analysts Forecast A 2.54% Advantage For 5 Highest-Yield, Lowest-Priced of 10 Dow Dogs As Of March 30, 2023
Ten top Dow dogs were culled by yield for their monthly update. Yield (dividend / price) results as verified by YCharts did the ranking.
YCharts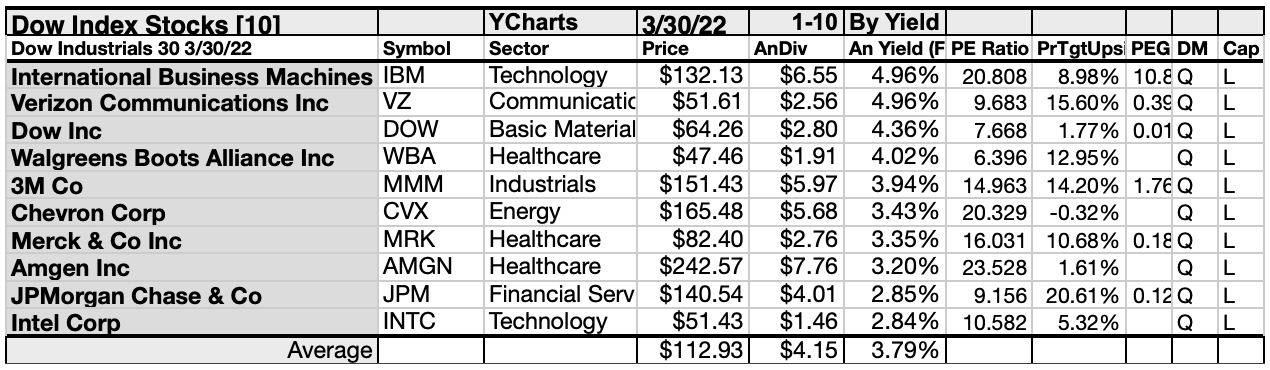
As noted above, top-ten Dow dogs selected 3/30/22 by both the YChart and IndexArb methods revealing the highest dividend-yields represented eight of the eleven sectors in Y-Charts and IndexArb reckonings. Consumer Cyclical went missing. (Real Estate is not reported and Utilities has its own Dow Index.)
Actionable Conclusions: Analysts Expected 5 Lowest-Priced of the Ten Highest-Yield Dow Dogs (34) To Deliver 12.20% Vs. (35) 11.89% Net Gains by All Ten Come March 30, 2023
YCharts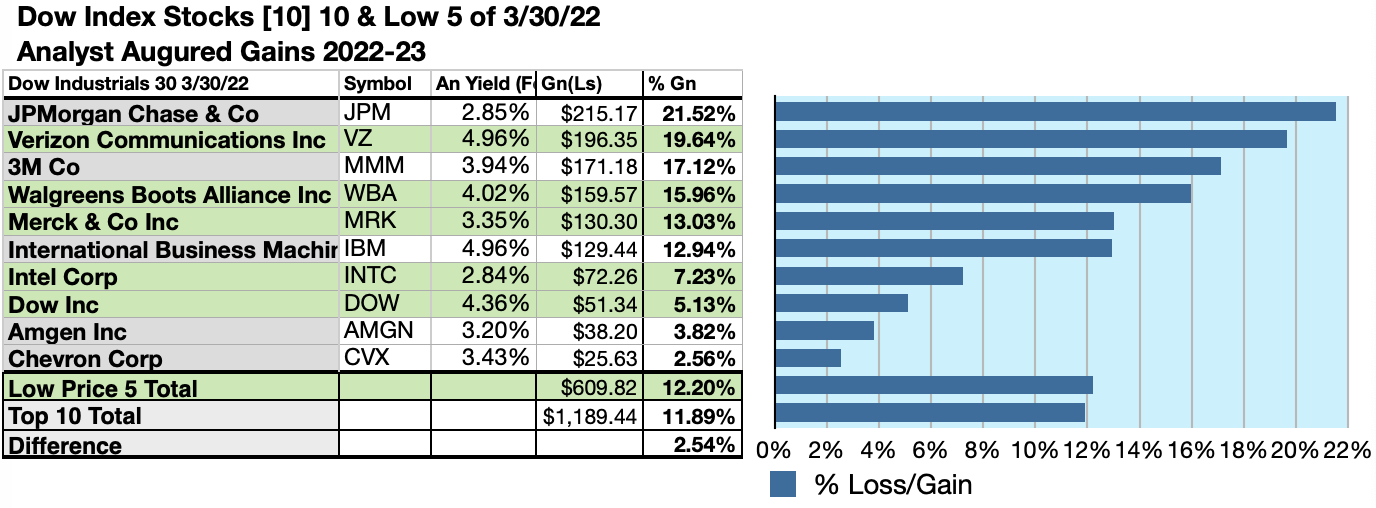
$5000 invested as $1k in each of the five lowest-priced stocks in the top ten Dow Dividend kennel by yield were predicted by analyst 1-year targets to deliver 5.37% LESS gain than from $5,000 invested in all ten. The eighth lowest priced, 3M Co showed top analyst-estimated gains of 23.82%.
YCharts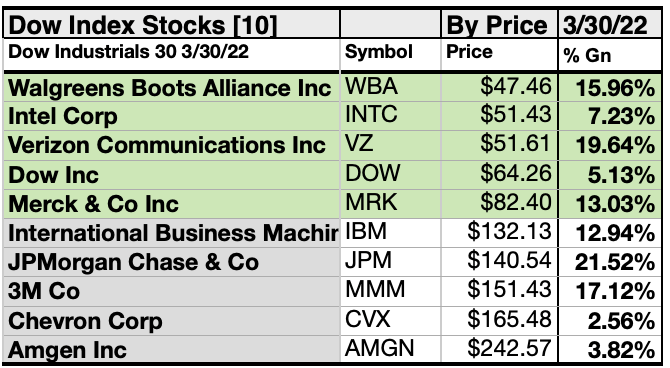
The five lowest-priced Dow top-yield dogs for February 25 were: Walgreens Boots Alliance Inc; Intel Corp; Verizon Communications Inc; Dow Inc; Merck & Co Inc, with prices ranging from $47.46 to $82.40.
Five higher-priced Dow top-yield dogs for March 30 were:; International Business Machines Corp; JPMorgan Chase & Co; 3M Co; Chevron Corp; Amgen Inc, whose prices ranged from 132.13 to $242.57.
The distinction between five low-priced dividend dogs and the general field of ten reflected Michael B. O’Higgins’ “basic method” for beating the Dow. The scale of projected gains based on analyst targets added a unique element of “market sentiment” gauging upside potential. It provided a here-and-now equivalent of waiting a year to find out what might happen in the market.
Caution is advised, since analysts are historically only 20% to 90% accurate on the direction of change and just 0% to 20% accurate on the degree of change. (In 2017 the market somewhat followed analyst sentiment. In 2018 analysts estimates were contrarian indicators of market performance, and they continued to be contrary for the first two quarters of 2019 but switched to conforming for the last two quarters.) In 2020 analyst projections were quite contrarian. The first half of 2021 most dividend stock price actions exceeded all analyst expectations. The last half of 2021 was still gangbusters. Future sag may free-up three or more Dow dogs, sending them into the ideal zone where returns from $1k invested equal (or exceed) their single-share price.
Afterword
Lest there be any doubt about the recommendations in this article, this month there were no Dow Index stocks showing dividends for $1k invested exceeding their single share price.
The dogcatcher hands off recommendations are still in place referring to one that cut its dividend in March, 2020. While Boeing, has re-learned (and is certified) how to fly, it still has to find customers before it can get airborne again. BA faces strong headwinds to stay on the Dow index (despite analyst optimism for the lone American commercial air-crafter). Also keep hands off the newest non-dividend member of the Dow, Salesforce.com Inc, until it declares a dividend from $1K invested greater than its single share price. While subscriptions keep the ship afloat, Disney needs audiences to get strapped back into buying tickets to watch and ride before resuming a dividend. The DIS parks are now open in CA & FL. Will anybody play there or go to movies again? If so, when will the DIS dividend return? Looks like all viewer loyalties have switched to Apple productions and streaming entertainment options.
The net gain/loss estimates above did not factor in any foreign or domestic tax problems resulting from distributions. Consult your tax advisor regarding the source and consequences of “dividends” from any investment.
Stocks listed above were suggested only as possible reference points for your Dow dividend dog stock purchase or sale research process. These were not recommendations.
Graphs and charts were compiled by Rydlun & Co., LLC from data derived from Indexarb; YCharts; finance.yahoo.com; analyst mean target price by YCharts. Open source dog art from dividenddogcatcher.com
Be the first to comment