

Fundamental 10-Step Analysis Of Apple Health & Valuation
Justin Sullivan/Getty Images News
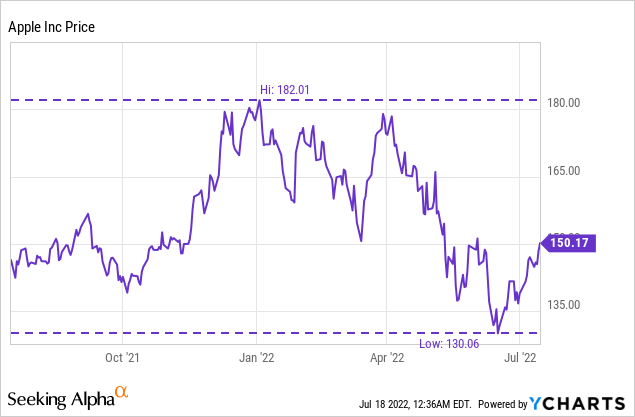
It’s been a wild ride of a year for Apple Inc. (NASDAQ:AAPL) – just twelve months ago the company was generating $90B in free cash flow & $76B in earnings, then fluctuated between $130 and $180 per share from the exuberance of the market to the decline of all things tech, and now has settled at…almost precisely where it was on a share price basis one year ago.
But wait…with a nearly 5% decline in shares outstanding the market cap actually sits slightly lower now than one year ago. And now Apple is generating nearly $106B in free cash flow and almost $102B in earnings. Clearly, the valuation has dropped while the fundamental performance has continued progressing forward at rates almost unheard of for a $2.45T (with a T) market cap company. As you will see based on the fundamentals, this is clearly a wonderful business that has continued to outperform its competitors and almost every other business with its reach, moat, and financial performance. The analysis shows this with ease, but with each step, we must ask and assess – can this continue?
Let’s take a look at the current share price’s justification by valuation metrics and the fundamentals over the past 5 years.
Using the $2.451T market cap as of July 18, 2022, Apple is the world’s most valuable company and has grown over 5 years at compounded annual growth rates that astound: 12% revenue CAGR, 17.5% earnings CAGR, and over 14% free cash flow CAGR – all while decreasing share count at 5% compounded annually. The margins continue expanding as the services component of the business continues growing, now making up 20% of total revenue at 72.6% gross margin – the second largest category of revenue Apple breaks out.
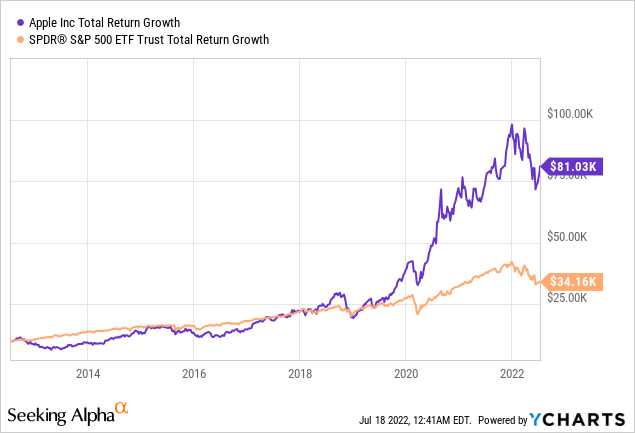
Just look at this return from 10 years showing the price growth of $10,000. Apple, through high return on invested capital, earnings growth, and recent share buybacks, was able to more than double the S&P 500 return. But it wasn’t always the case – the outperformance has occurred almost exclusively since the end of 2019 as the valuation metric went from 10-12x earnings to nearly 30 in the most exuberant parts of late 2021. All of this sets the stage for some introspection from an investor’s standpoint: clearly, the company operated in the doldrums compared to the S&P 500 return for many years, can this pattern return? Or should investors take solace in what has been a steady improvement in the business fundamentals and management’s experience in continuing this growth?
Using a 10-Step Fundamental Analysis detailed further here, I will examine 10 important components of Apple and how the company measures up on each metric, either assigning a 1/1, 0.5/1, or a 0/1 for each of the 10 components.
Incredible Revenue & Income Growth Almost Defies the “Law of Large Numbers”
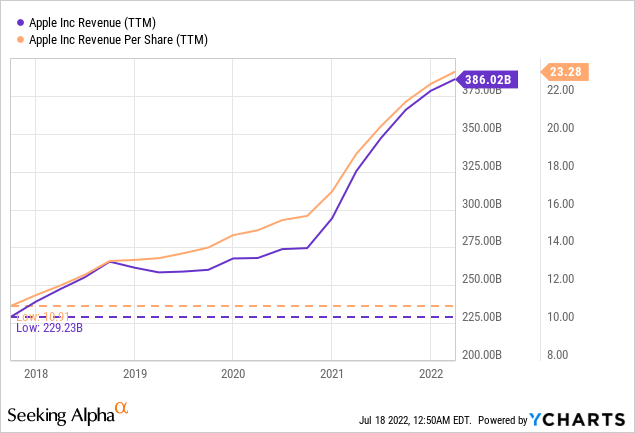
Looking at trailing 12-month numbers as of March 31, 2022 for operating revenue over the past 5 years, Apple has increased revenue from $220.46B in 2017 to $386.02B in 2022. Revenue increase has come from a combination of extreme digital services growth, Mac outperformance in the market, the emergence of a “wearables” market with Apple Watch, and of course, iPhone strength and pricing power during the 5-year period. With consumers comfortable paying well over $1,000 for iPhone in 2022 as the center of their digital lifestyle, revenue has increased significantly as compared to the $699 starting price for an iPhone 8 in 2017. (Source)
This is an example of what Warren Buffett refers to as a “moat” or durable competitive advantage. As services grow and the ecosystem continues expanding and becoming more indispensable to the consumer, the “stickiness” factor of the iPhone means pricing power can continue to rise. Where upgrades every two years used to be entirely or partially subsidized by the wireless carriers just 5 years ago, now it is completely common practice to have monthly payments for the iPhone on your wireless bill monthly, as high as $50 per month!
Not only that, but here is the brilliance of this model – the carrier pays Apple and you pay the carrier so the cost on a monthly basis feels minimal – every $100 in pricing power the iPhone achieves is barely over $4 per month over 24 months for the consumer – and the consumer isn’t even paying Apple directly most of the time. All of this along with the services ecosystem is a tremendous tailwind for the company. This revenue growth has grown at an 11.9% CAGR over the past 5 years, but taking into account the share buybacks creates an even more enhanced piece of data: per share revenue – which grew from $10.57/share in 2017 to $23.85/share in 2022 or a 17.7% CAGR.
This is the effect of share buybacks and how they can even further enhance growth for the investor. The compounding machine continues forward at rates that are incredible for a company generating well over a third of a trillion dollars in annual revenue.
Revenue Growth: $220.46B -> $386.02B over 5 years, 11.9% CAGR // 17.7% per share CAGR with buybacks |
Incredible revenue growth at this large of a scale over 5 years enhanced by share buybacks, and continuing to grow at over a 9% rate quarter over quarter even with a strong dollar. Score: 1/1
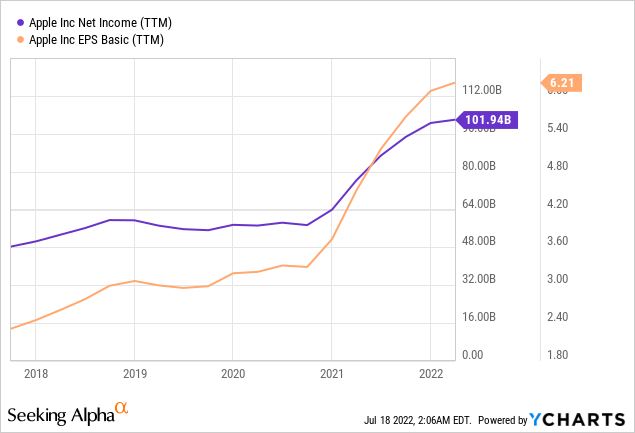
Although net income is not quite as insightful of a valuation metric compared to free cash flow, Apple’s sensible and consistent investments, coupled with heavy research and development (versus property plant & equipment) leads to a very similar net income or earnings figure to free cash flow – one that is growing at a rapid rate. Using trailing twelve-month figures as of March 31, 2022 – Apple’s net income has more than doubled over the past 5 years from $45.73B to $101.94B representing a massive 17.4% CAGR. These figures are further enhanced as shown in the chart when seen through a per share basis to account for the buybacks: $2.19/share in earnings in 2017 growing to $6.30/share in earnings over 5 years or a 23.5% CAGR. (Note the chart doesn’t accurately show the most up-to-date and ever decreasing share count).
These types of growth rates in a mature business are incredible and highlight the power of the internal compound with minimal capital expenditures required compared to operational free cash flow (but a high rate of return achieved on those expenditures to enhance the compounding). These rates of earnings compounded growth and per share growth even outpace those of AutoZone (AZO), which has experienced enormous industry tailwinds, minimal capital expenditures, and transformational share buybacks — and all at about 50 times the scale! (Source) But…now is a good time for an investor to ask the obvious…can this continue or has this simply just been a very good run?
Looking to the future, there are two major questions regarding headwinds that Apple will face in terms of their financial performance: 1) Will the law of big numbers eventually catch up to Apple?; and 2) Just how much more innovation is left and how long can the brand stay dominant in an industry notorious for systemic shifts? There are obviously no easy or resolute answers to be had to either question, but what we do know at present should alleviate major concerns, though leave smaller ones behind of course.
First, there is no doubt that the law of big numbers has and will continue in larger scale to drag performance. 10% growth on $38B in revenue is $3.8B or roughly 4-6 weeks of iPad sales – but 10% growth on $386.02B is $38.6B or roughly the entire Mac market for an entire year. This requires continual disrupting, innovating, market share growth, and pricing power. Luckily, I see all of these things continuing to happen with Apple: one example is the Watch is becoming a health device with so many paths forward towards not only usability but also revenue growth through services.
Then there’s the Arcade, the Apple TV service, the Fitness service, the iCloud storage service, and so much more. What was once a one-time buy now is a very strong and sticky ecosystem with continual opportunities for revenue as highlighted by the 20% revenue that is services at an incredible 72.6% gross margin.
Will Apple stay dominant? All signs point to yes. The iPhone at the center of the digital world of so many consumers, especially young consumers, means they have and will continue building the Apple ecosystem around them in growing numbers.
Income Growth: $45.73B -> $101.94B over 5 years, 17.4% CAGR // 23.5% per share CAGR – Incredible! |
Very consistent & robust income growth over 5 years significantly enhanced on a per share basis by share buybacks and a growing emphasis on very high margin services like subscriptions, storage, content, and the toll booth that is the App Store. Score: 1/1
Strong Balance Sheet And Debt Ratios Do Not Detract From The Stability
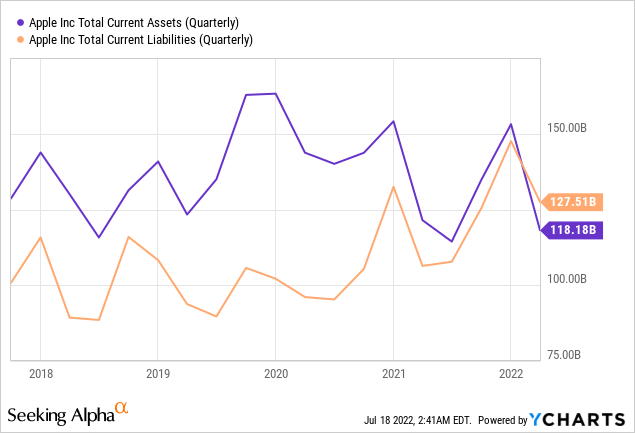
Due to the liquidity of current retail assets being sold and the amount of inventory required, retailers and grocers traditionally do not hold current assets greater than current liabilities. This is magnified by such a large and growing mix of products, including the transition to Apple silicon from Intel, amongst other changes. It is also rumored to be an especially full and busy season for introducing new products, meaning that current liabilities at present could be higher than assets due to the supply chain timing.
Based on this and the established industry norms, while liquidity in terms of the company’s ability to pay off all current liabilities with current assets is definitely ideal, it is rarely expected in a retail setting such as this due to sell-through rates. I will note, however, that this is the first time in the 5-year chart that this situation has occurred, which does give me pause and concern should it become a long-term trend as this would represent a reversion from historical norms for Apple.
Assets vs. Liabilities: $118.18B current assets vs. $127.51B current liabilities / negative, but retail |
While common for retailers, current assets do fall short of current liabilities, representing less than ideal liquidity. Due to the norms of the industry practice, this being the first time it has happened in over 5 years, and the likelihood of correction in the future, we will deduct half a point instead of a full point. Score: 0.5/1
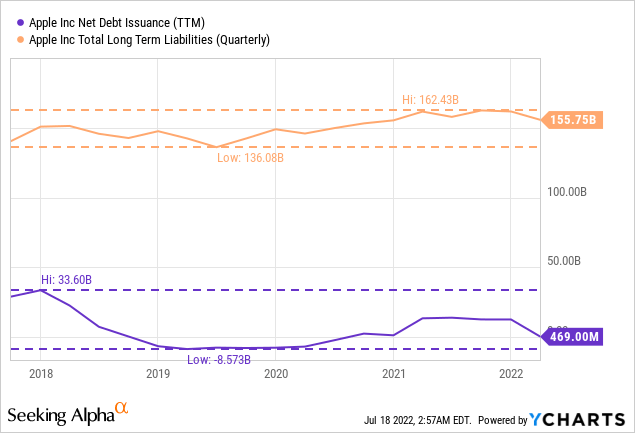
Apple management has kept long-term debt of just over 1x annual free cash flow, which represents an extremely conservative and reasonable figure for management to keep within. The debt expansion did concern me at first glance, just looking at the chart above, but management noted in the Q2-2022 conference call:
Let me now turn to our cash position. As we continue to generate very strong cash flow, we ended the quarter with $193 billion in cash and marketable securities. We repaid $3.8 billion in maturing debt while increasing commercial paper by $2 billion, leaving us with total debt of $120 billion. As a result, net cash was $73 billion at the end of the quarter. (Source)
While $120 billion of total debt seems startlingly high, it could all be paid off immediately with the cash and marketable securities and still have $73 billion left over, not even mentioning the roughly $28 billion in free cash flow quarterly! Simply put, debt is so reasonably constrained at Apple that it represents a non-issue.
Long Term Debt: Slight Growth, But At Just Over 1x Annual Free Cash Flow, It is a Non-Issue |
Management is prudently using debt, interest is a small portion of cash flow, and overall is just over 1x Free Cash Flow. Score: 1/1
The Compounding Secret: Incredible Return on Invested Capital & Vigorous Share Buybacks
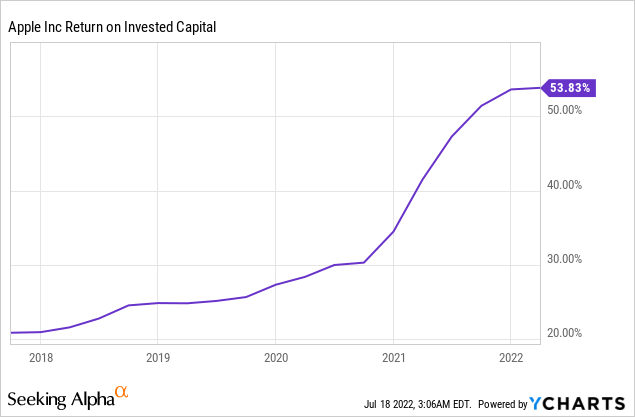
After examining the long-term debt situation on the balance sheet, it appears an ideal time to examine management’s returns from the capital invested back into the business. Return on invested capital is perhaps one of the most apparent indicators of a competent and innovative management team focused on shareholder return – how capital is invested and allocated back into the business. The average of S&P 500 companies is approximately 7%. Looking at improving upon than average and towards companies deploying their money in a high quality manner, I look for businesses earning more than 10% return on invested capital.
Return on invested capital is a financial metric favored by Charlie Munger, stating “It’s obvious that if a company generates high returns on capital and reinvests at high returns, it will do well.” (Source) With an average ROIC of 32% over the past 5 years, Apple management is doing a first-class job of using shareholder money in the most efficient and productive manner possible. Investors can feel confident whatever free cash flow is not being returned to shareholders in the form of buybacks and dividends is being very wisely used to internally compound growth within the company. In fact, current ROIC shows returns at 53.8% which is a massive surprise considering the capital being deployed by Apple, and the 10-year chart above represents just how consistently Apple has produced outsized returns.
To outpace the average S&P in this regard by 4.5 times over 5 years and 7.5 times at present truly shows the magnitude by which Apple makes incredible investments within their company, generating substantial returns for shareholders. I consider this a major sign that services, with their high margins, are playing an outsized role in Apple’s future growth as a business.
Invested Capital & Equity Returns: 32% ROIC avg 5 years & currently 53.8% – Incredible Numbers |
ROIC is well above 10% at 32% average and 53.8% at present and continuing to grow quarter over quarter. Since shareholder equity is so strongly affected by aggressive buybacks, the return on equity percentage tops 150% at present. Score: 1/1
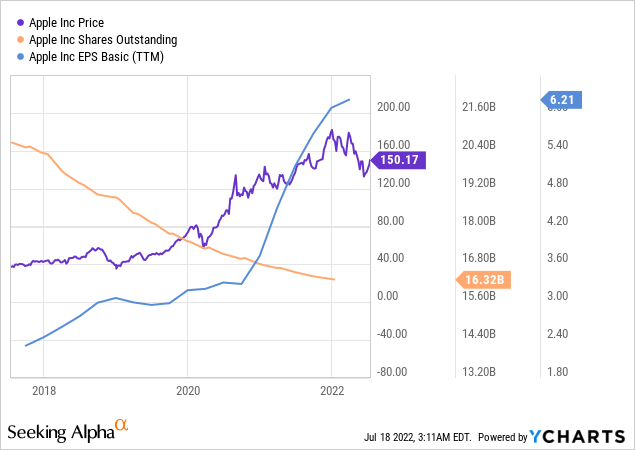
Apple has a share buyback program that is unrivaled in terms of sheer scale: in the last 12 months, nearly $86 billion of shares have been repurchased alone. Let’s look at the chart above for a simple example: as shares (orange line) go down by 22.4% during 5 years, earnings per share (light blue line) go up by over 187% during the 5 years – so it is no surprise that the share price (purple line) also goes up, in this case, by some 275%.
The number of shares of the company and the way management either enhances shareholder value or dilutes it through buybacks or share issuances is a very meaningful metric for overall investor return. While some companies will buy back 1% of shares annually and have a very good buyback program at that, others will dilute and raise capital through issuing new shares.
With Apple, the magnitude of the buyback is truly impressive. In 5 years, the shares outstanding have decreased (taking into account the stock split) from 20,855,360,000 shares to 16,185,181,000 shares, representing a 22.4% decrease in shares and investors having a 5.23% CAGR just from buybacks alone! As demonstrated by Berkshire Hathaway’s (BRK.A) (BRK.B) long-term buying back of shares, Apple management is showing that buybacks are one of the best ways to enhance shareholder return in a tax-efficient manner in the long term. The growth of the earnings power is magnified by the decrease in the share count, creating a compounding machine.
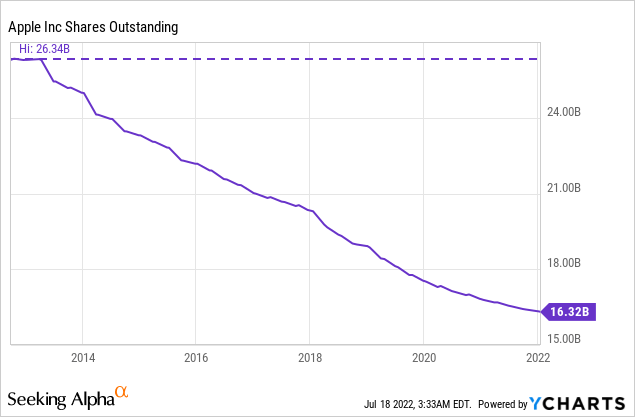
Take a look at one more chart just to really enhance the magnitude of this: from July 2012 to now, Apple decreased their share count by 38.5% – representing investors increasing their ownership stake in the company by 62%. It’s good to be patient and let compounding do its job!
Buybacks: 20.855B -> 16.185B shares over 5 years, 22.4% decrease in shares – A+ and At Huge Scale! |
Share count has decreased over past 5 years & that is the gold standard. Score: 1/1
Modestly Growing, Well-Covered Dividend Offers Little To Excite Investors
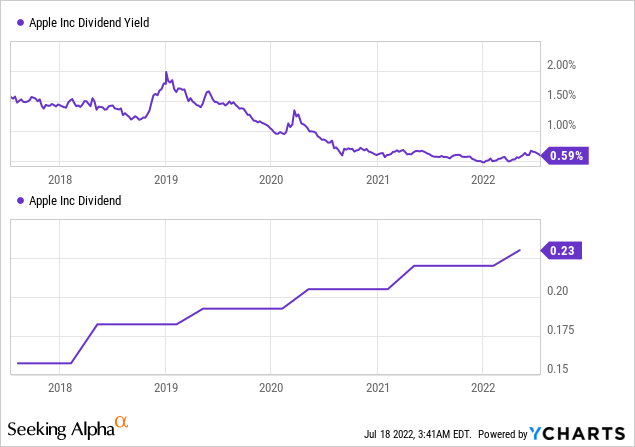
Having increased the dividend at an 8% CAGR during the past 5 years from a split-adjusted $0.1575/share to the present $0.23/share annually, Apple represents just a 0.6% yield at the current valuation. However, because of the size of the business, this modest yield represents a total payout of $14.89B annually or 14% payout on total annual free cash flow. The growth has been modest when viewed against the power and size of the share buyback program, which is clearly Apple’s preferred mechanism of shareholder return for the past 10 years.
Overall, this is a very minor footnote to the overall Apple investor story, albeit one that takes up nearly $15 billion in free cash flow resources annually. Based on present valuations as compared to past valuations, I would rather see even further enhanced share buybacks taking place – although having a dividend does create some semblance of cash flow for passive investors. At 911 million shares, Berkshire Hathaway’s stake in Apple alone represents over $838 million annually in dividend payments.
Dividend: $14.89B dividend annual, 0.60% yield / 14% payout of free cash flow / Modest Yet Covered |
With a well-covered, modest dividend, Apple offers stability and consistency for investors, though not even close to being the primary means of shareholder return compared to the buyback program. Score: 1/1
Massive Free Cash Flow Generation and Growth… At A Fair Valuation
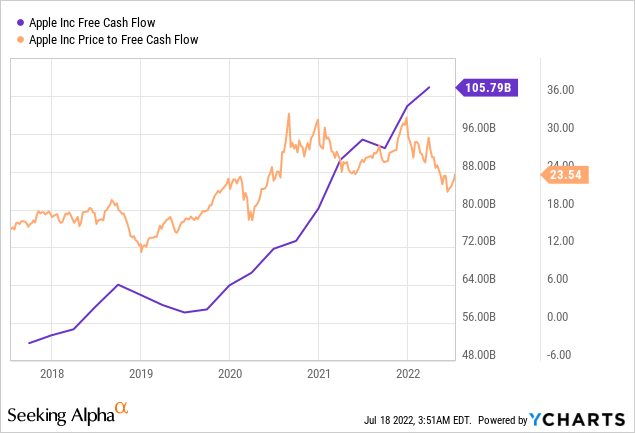
From the standpoint of a company’s operational strength and stability, free cash flow represents a very meaningful metric and the primary factor I look towards when creating a valuation metric and measuring long-term stability and growth. Apple again produces characteristically strong outperformance with regards to free cash flow over 5 years – going from $54.53B to $105.8B representing a 14.2% CAGR and a near double during the time period. Where the numbers really become affected greatly though, is on a per share basis thanks to the buybacks – approximately $2.61/share in free cash flow 5 years ago has turned into approximately $6.53/share in free cash flow now – a 2.5x increase representing a staggering 20% CAGR.
The fact that this is cash flow being measured in the hundreds of billions annually growing at these elevated rates makes the growth even more compelling. Like the other fundamental metrics of the company that we have reviewed, this is a remarkable display of management over-performance. Only Saudi Aramco (Source) is generating stronger cash flows at present ($30 billion per quarter) and that is on the back of an unbelievably hot and cyclical oil market.
Having this level of free cash flow allows for five primary uses of the capital: 1) share buybacks; 2) dividends; 3) acquisitions; 4) investment in itself; and 5) debt repayment. All of these, with the exception of some acquisitions, grow shareholder value over time when handled properly by management.
Free Cash Flow: $54.53B -> $105.8B in 5 yr (14.2% CAGR increase) or $2.61/sh -> $6.53/sh (20% CAGR) |
Free cash growth over the past five years is consistent and compounding at very high rates for an incredible result that directly has benefited shareholders significantly. Score: 1/1
Now for the component of valuation with regards to Apple: let’s look at two methods: free cash flow, and earnings.
Apple, based on the $2.451 trillion market cap, is selling for 23.16 times free cash flow for the trailing twelve months – representing a 4.32% initial rate of return based on free cash flow with a 14.2% CAGR free cash flow growth over the past 5 years.
Apple, based on the $42.26B market cap, is selling for 24.04 times earnings for the trailing twelve months – representing a 4.16% initial rate of return based on earnings with a 17.4% CAGR earnings growth over the past 5 years.
By my standard metrics of looking for growth companies selling for under 20 times free cash flow, the valuation of Apple is stretched from both aspects noted above, though the double-digit growth in particular with earnings does give me pause. This recent pullback in valuation as shown in the chart above does give me confidence, but the chart also shows years very recently where Apple was selling at just 12 times free cash flow. Essentially the positive is: I am buying a compounding company with strong free cash flow growth and an incredible durable competitive advantage. The negative: I am only getting a fair value at present. It’s the classic wonderful business at a fair price.
Valuation: 23.16x FCF; 24x EPS; 4.16-4.32% implied initial return w/14% CAGR FCF & 17% CAGR Earnings |
There is so much to like about Apple from a fundamental business standpoint: the dynamic growth, management’s incredible capital allocation strategies, and the shareholder-friendly buyback policy – but the valuation comes at just a fair price. Score: 0.5/1
Overall Apple Recap & Valuation
Looking at all of these metrics and making assumptions based on the future is the key to creating assumptions on future returns and growth. We know that Tim Cook and Apple management are committed to returning incredible amounts of ever-growing capital back to shareholders primary through share buybacks and dividends, all while ensuring the business has everything it needs to grow effectively through research & development, along with accretive acquisitions. Frankly, when management allocates capital at a 50%+ return on invested capital, you can trust the expertise in the marketplace to make and commit to the right decisions with regards to internal investment and compounding.
As services continue to grow rapidly at high margins, iPad supply chain restraints eventually subside, the Apple Watch grows into a stronger franchise, and iPhone pricing power is further stretched even higher, I believe a runway for Apple exists even without highly innovative products in the future. However, I do believe those “X-Factors” do exist and will continue to push the company forward.
Let’s take a series of assumptions based on free cash flow over a five-year period:
– 10% annual compounded free cash flow increases (well below the present 5-year growth of 14.2%)
– 5% annual share count reduction (exactly at the same pace as the present share count reduction rates over the past 5 years – management has shown this is their primary way of creating value and I don’t see this changing)
– 20 times free cash flow terminal multiple (Below the 23.16x free cash flow valuation the business has right now)
What does this give investors in terms of returns over the next 5 years? Roughly a 12.5% annual return for Apple based on the present share price.
How about for earnings?
– 10% annual compounded earnings increases (well below the present 5-year growth of 17.4%)
– 5% annual share count reduction (exactly at the same pace as the present share count reduction rates over the past 5 years – management has shown this is their primary way of creating value and I don’t see this changing)
– 20 times earnings multiple (Below the 24x earnings valuation the business has right now)
What does this give investors in terms of returns over the next 5 years? Roughly a 12% annual return for Apple based on the present share price.
I strongly believe management will continue growth, continue buying back shares with vigor, and deliver internally compounding results to shareholders generously over the next five years. These numbers may look conservative at a glance – the earnings growth of 10% vs. the present 5-year growth of 17.4% for example – but the law of big numbers will begin to become a drag on performance over time and 10% of $102B is over $10 billion annually in increases every single year for 5 years.
This is not an easy task, but I do believe management can achieve it. The growth assumptions take into account a margin of safety since they are well below the present growth rates. In five years, Apple should be somewhere around $260 per share with these assumptions. If 12-12.5% annual return seems a fair reward for the risk you are taking on with Apple based on those assumptions, then this is the right timing. If those assumptions seem too bold, then you should wait for either more information in the form of Q3 earnings to be released at the end of July, or for a more attractive entry point.
Please see this blog post here to understand the methodology behind the 10-step analysis.
Revenue Growth: $220.46B -> $386.02B over 5 years, 11.9% CAGR // 17.7% per share CAGR with buybacks |
Income Growth: $45.73B -> $101.94B over 5 years, 17.4% CAGR // 23.5% per share CAGR – Incredible! |
Assets vs. Liabilities: $118.18B current assets vs. $127.51B current liabilities / negative, but retail |
Long Term Debt: Slight Growth, But At Just Over 1x Annual Free Cash Flow, It is a Non-Issue |
Invested Capital & Equity Returns: 32% ROIC avg 5 years & currently 53.8% – Incredible Numbers |
Buybacks: 20.855B -> 16.185B shares over 5 years, 22.4% decrease in shares – A+ and At Huge Scale! |
Dividend: $14.89B dividend annual, 0.60% yield / 14% payout of free cash flow / Modest Yet Covered |
Free Cash Flow: $54.53B -> $105.8B in 5 yr (14.2% CAGR increase) or $2.61/sh -> $6.53/sh (20% CAGR) |
Valuation: 23.16x FCF; 24x EPS; 4.16-4.32% implied initial return w/14% CAGR FCF & 17% CAGR Earnings |
Management & Moat: Incredible Management Leads the Industry & Product Loyalty is the Ultimate Moat |
Based on 10-Step Analysis: 9.0 out of 10 |
Be the first to comment