

Deagreez
This article was published on Dividend Kings on Wed, February 8th, 2023.
—————————————————————————————
I’m a passionate high-yield investor, and you might think that means I own only the world’s best high-yield blue-chips.
While I certainly own lots of those, I also love growth stocks like Apple (NASDAQ:AAPL) and Autodesk (NASDAQ:ADSK).
Why? Not because growth stocks boost long-term returns, though they certainly do that. No, I love growth stocks because my goal isn’t just high, safe, and growing yield today; it’s maximum safe income over time.
You might have seen this formula before:
Total return = starting yield + long-term growth + changes in valuation.
This is called the Gordon Dividend Growth model and it’s the single most accurate forecasting tool for stocks in history.
Ploutos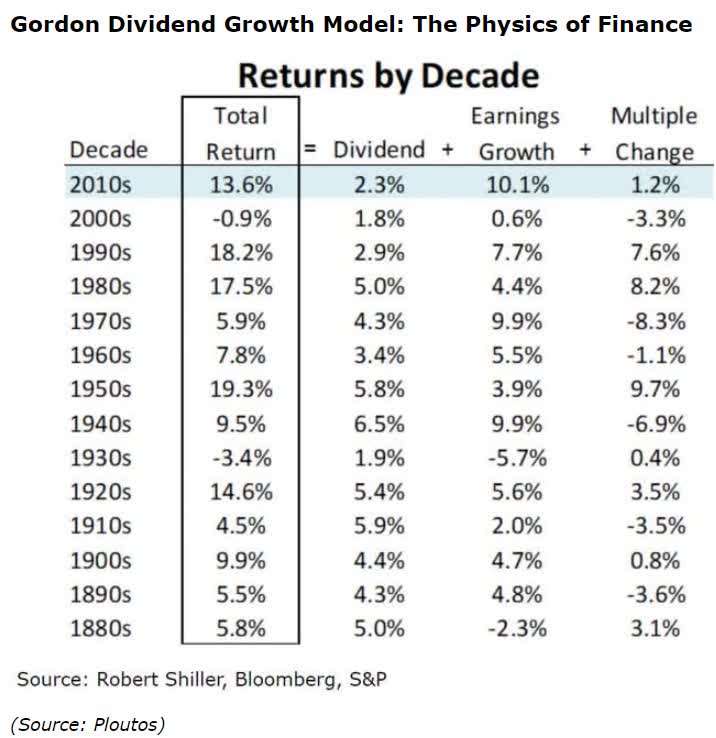
Over the long-term valuation changes cancel out, as long as fundamentals remain relatively similar.
Thus total returns ultimately prove a function of starting long-term yield growth.
But while many investors know this famous formula, which has been made popular on Seeking Alpha by Chowder, you might not know that it also predicts income growth rates over time.
The margins of error are a bit wider, but basically, if you have a 4% yielding portfolio with about 10% growth (my family hedge fund), then you can expect about 14% returns over time and 12% to 16% income growth.
- last year 18% vs 11% S&P 500
This is the secret sauce to what I call triple income compounding.
- dividends growth exponentially over time along with earnings and cash flow
- dividends buy exponentially more shares over time
- growth stocks (through rebalancing) buy exponentially more income stocks
This last part is critical to turbocharging your income growth and maximizing safe dividends in retirement.
After 10+ years, growth stocks can deliver such gains, that through annual rebalancing, they can purchase far more high-yield blue-chips than you could ever afford to on your own.
Don’t believe me? Let’s consider an example using Apple, Autodesk, and VYM as a proxy for high-yield blue-chips.
Total Return Since 2006
Portfolio Visualizer Premium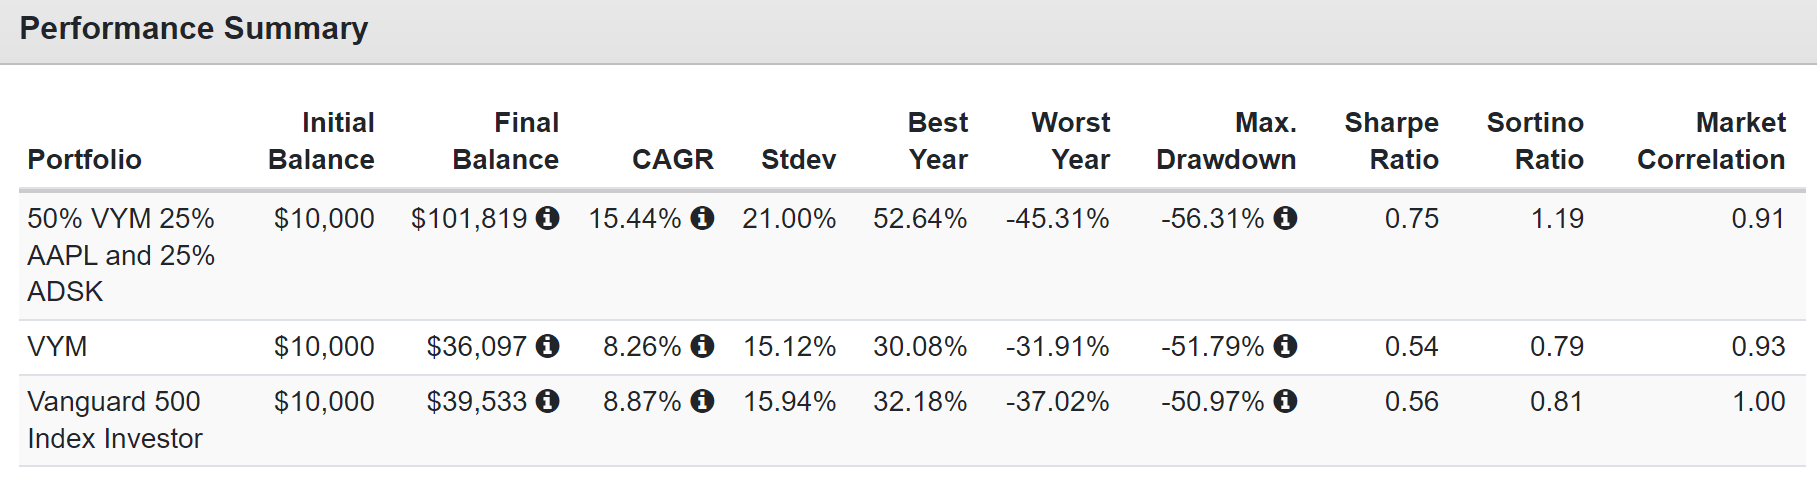
It’s no surprise that adding two of the best growth stocks in history doubled annual returns, and tripled long-term returns.
It’s also no surprise that given a decade-long growth rally, value and yield didn’t outperform the S&P.
But what might surprise you is what kind of income growth these portfolios delivered over the last 15 years.
Income Growth Since 2007
Portfolio Visualizer Premium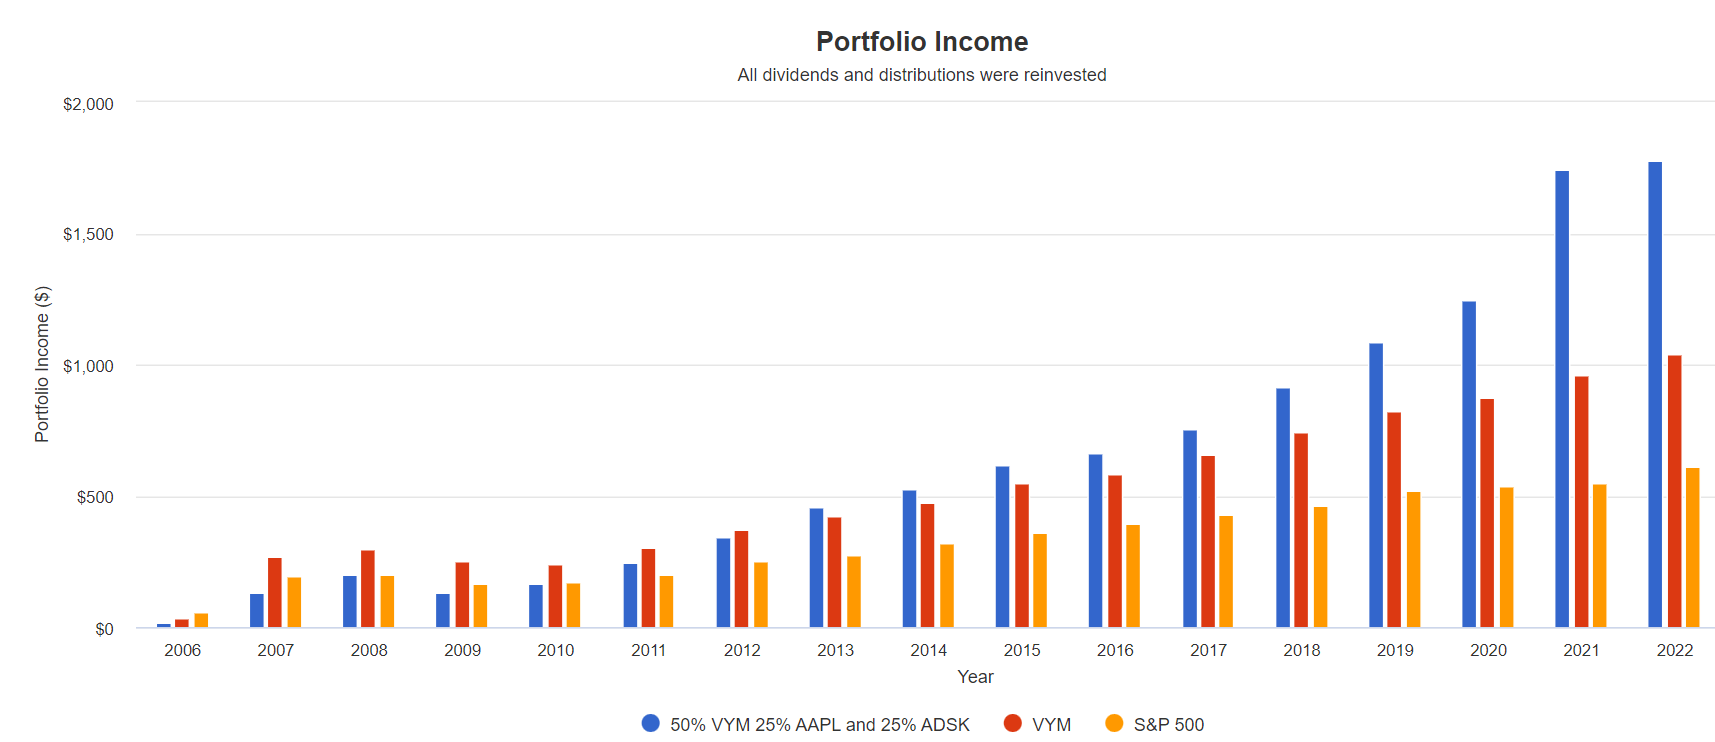
Cumulative Dividends Since 2007 Per $1,000 Investment
| Metric | S&P 500 | Vanguard High Dividend ETF | ADSK + AAPL + VYM |
| Total Dividends | $562 | $885 | $1,100 |
| Total Inflation-Adjusted Dividends | $382.31 | $602.04 | $748.30 |
| Annualized Income Growth Rate | 8.1% | 9.5% | 19.1% |
| Total Income/Initial Investment % | 0.56 | 0.89 | 1.10 |
| Inflation-Adjusted Income/Initial Investment % | 0.38 | 0.60 | 0.75 |
| More Inflation-Adjusted Income Than VYM | 0.64 | NA | 1.24 |
| Starting Yield | 1.9% | 2.7% | 1.3% |
| Today’s Annual Dividend Return On Your Starting Investment (Yield On Cost) | 6.1% | 10.5% | 17.8% |
| 2023 Inflation-Adjusted Annual Dividend Return On Your Starting Investment (Inflation-Adjusted Yield On Cost) | 4.1% | 7.1% | 12.1% |
(Source: Portfolio Visualizer Premium)
Let me point out that this 50/50 combo of high-yield and growth blue-chips delivered 24% more inflation-adjusted dividends than VYM alone.
The inflation-adjusted yield on cost is also almost twice as high, meaning that going forward, this combo of yield and growth is likely to deliver far more income much faster.
But pay special attention to the growth rate of the dividends themselves. VYM’s was 9.5%, similar to the 8.5% returns it delivered.
And the yield + growth combo of AAPL, ADSK, and VYM delivered a spectacular 19% annual income, much higher than the 15% annual return.
(Source: Portfolio Visualizer Premium)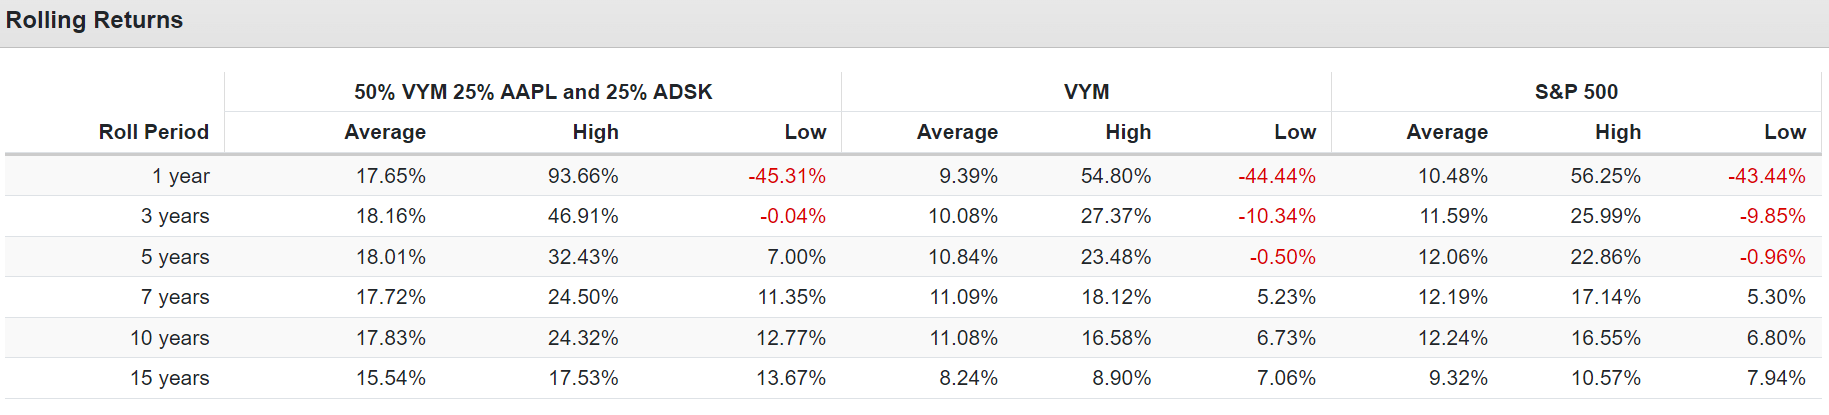
18% average 12-month rolling returns vs. 19% income growth for yield + growth.
9.4% rolling returns for VYM vs. 9.5% income growth.
And about 10% rolling returns for the S&P and 8% income growth.
You see? Maximizing total return and income growth are one and the same.
Now if you’re 85 and need max income today and expect to die in five years? And you’re single and don’t have to worry about a spouse? Then sure, pure high-yield blue-chips might be right for you.
But if you have a decade or more? If you’re 70 years old and retired and married? Then there is a 10% chance you or your spouse will live to 100, and then yield alone shouldn’t be the goal. For almost anyone under the age of 70, maximum safe income over time is important.
So why am I comparing Apple and Autodesk today? Because both are legendary growth world-beaters who have made long-term investors fabulously rich.
Total Returns Since 1985
Portfolio Visualizer Premium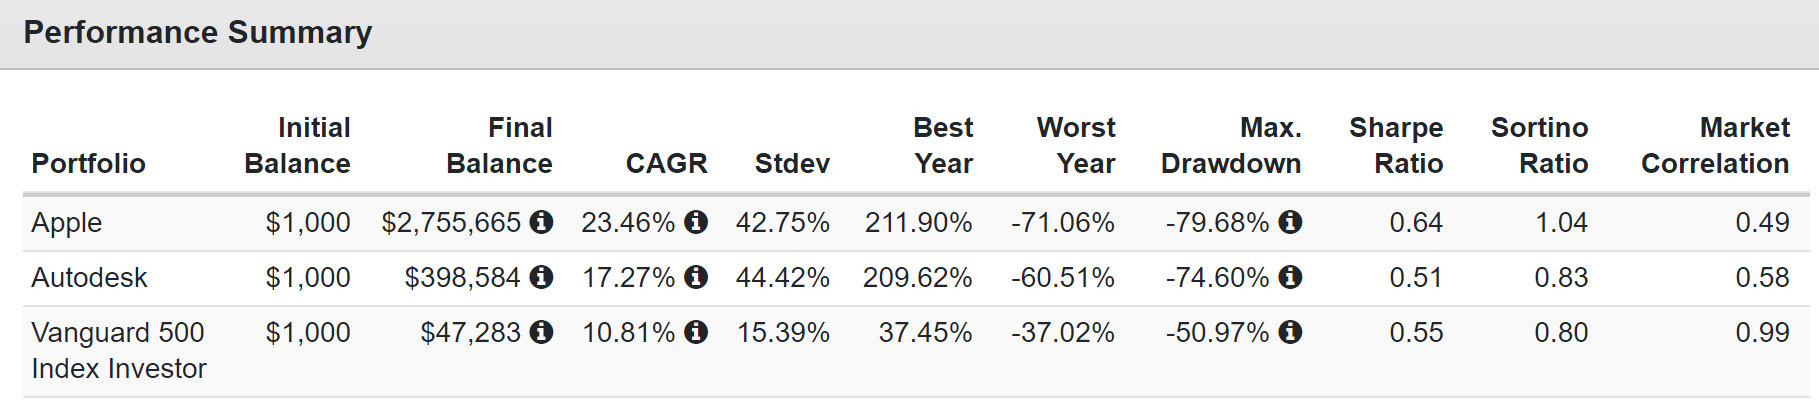
$1 invested in Apple in 1985 is now worth $2800 and $1 invested in Autodesk is now worth almost $400.
Portfolio Visualizer Premium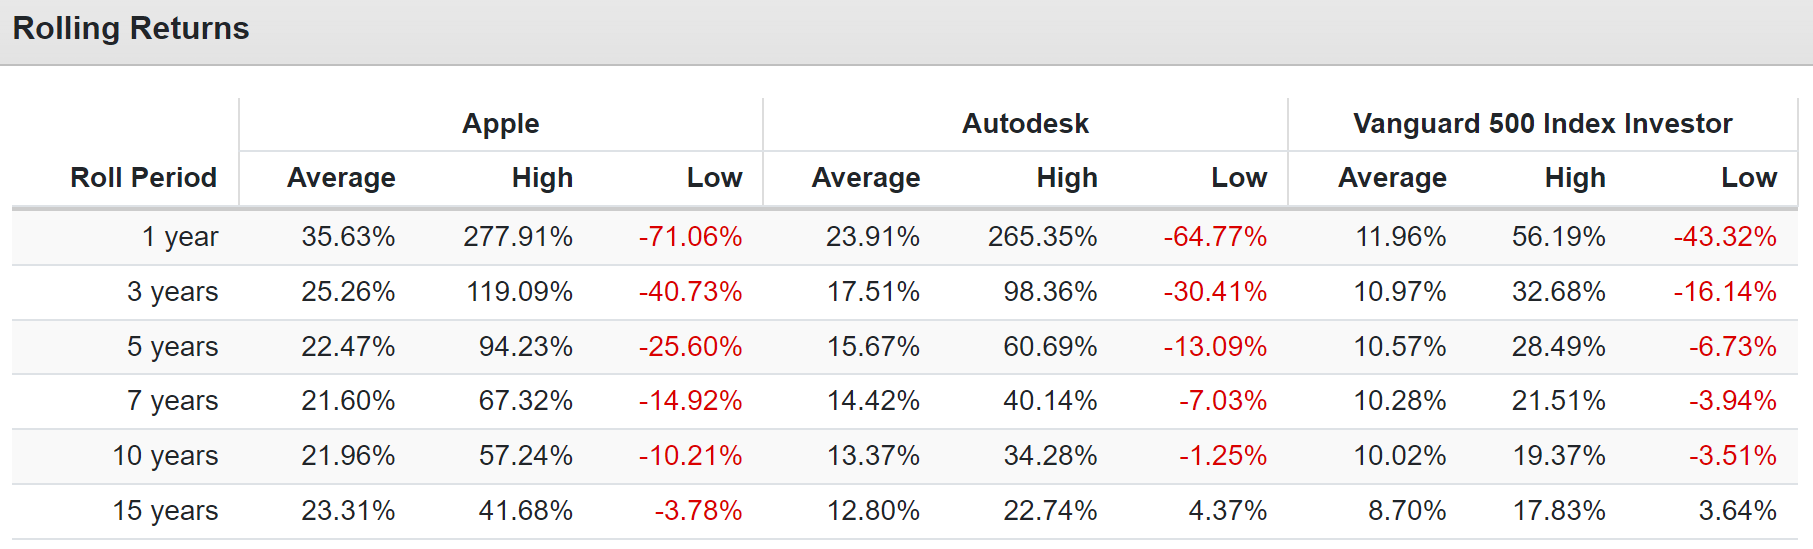
ADSK’s average annual return has doubled the S&P 500’s, and Apple’s has tripled it. But now the growth prospects for Apple and Autodesk have flipped, and that’s something investors in both stocks need to know.
So let’s examine why both Apple and Autodesk are potentially wonderful world-beater growth stocks for your income portfolio.
And I’ll show you why I’m now buying Autodesk for my family hedge fund.
Apple: A Core Dividend Growth World-Beater Almost Everyone Should Own
Apple is the world’s most valuable company, and it’s not hard to see why.
Apple’s moat is the stuff of legend. 64% of iPhone users say they won’t even consider switching to another phone. That’s despite premium prices which customers think are worth it because of Apple’s curated ecosystem.
And ecosystem that Apple has continuously improved and expanded over time.
- iPod
- iPhone
- iPad
- earpods
- Apple Watch
- subscriptions
- now VR headsets
- an upcoming car in a few years
Apple has gone from a tech hardware business to a luxury lifestyle brand, the LVMH of consumer electronics.
And its subscription business, while experiencing slowing growth as we head into recession, is still growing at an impressive rate. For example, in Q4, subscribers hit 935 million, up by 35 million in a single quarter.
- 14% annualized growth rate
Given that Apple has an installed base that just passed 2 billion and a fanatically devoted customer base, it’s quite possible that Apple’s subscriber base could grow to 1.5 billion within a few years, and potentially 2 billion within 10 to 15 years.
For context, Netflix (NFLX) has 231 million subscribers, and Amazon Prime has over 200 million.
Do you know the only company in the world with more subscribers than Apple? China Mobile with 970 million. Apple is expected to hit 1 billion subscribers in 2023 or 2024, two years earlier than China Mobile, and then keep padding its lead from there.
FactSet Research Terminal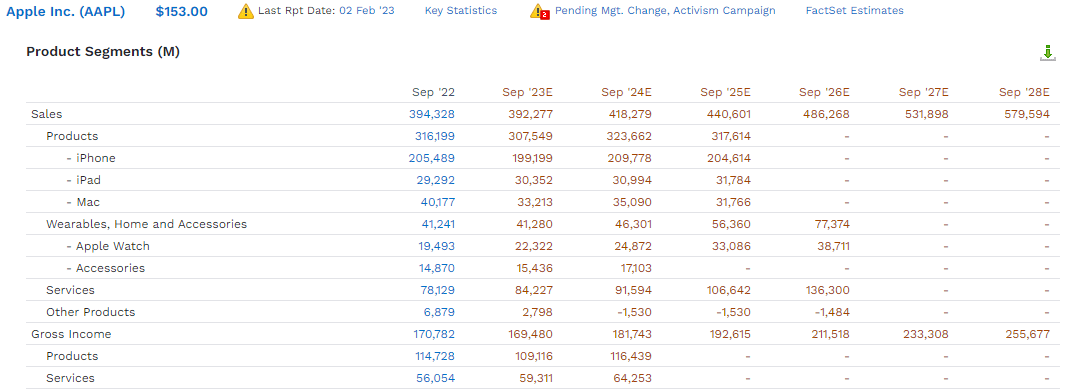
Thanks to that nearly 1 billion subscriber base Apple’s services revenue is expected to grow from $78 billion in 2022 to $136 billion in 2026, a nearly 15% annualized growth rate.
That’s important because it costs Apple very little to run that high-margin business. How high? Service gross margins are expected to be 70% in 2024 compared to 36% for hardware sales.
While Apple TV + isn’t expected to turn a profit anytime soon, given the aware winning quality of that content, and a subscriber base of almost 1 billion, I have little doubt that Apple will survive and thrive after the streaming wars are over.
Apple TV+, which has been around for less than three years, has earned 52 total Emmy nominations across 13 different titles in 2022. HBO and HBO Max notched 140 nominations combined and Netflix received 104.” – CNBC
In other words, Apple TV+ is the new HBO, and Apple TV+ has the potential to become one of the most dominant streamers in the world. That would allow it to eventually become profitable, unlike most smaller streamers.
Meanwhile, wearables, which I was highly skeptical of when they came out, is crushing it. Sales are expected to go from $41 billion in 2022 to $77 billion in 2026, a 17% annualized growth rate.
And, of course, we can’t forget Apple’s incredible free cash flow.
FactSet Research Terminal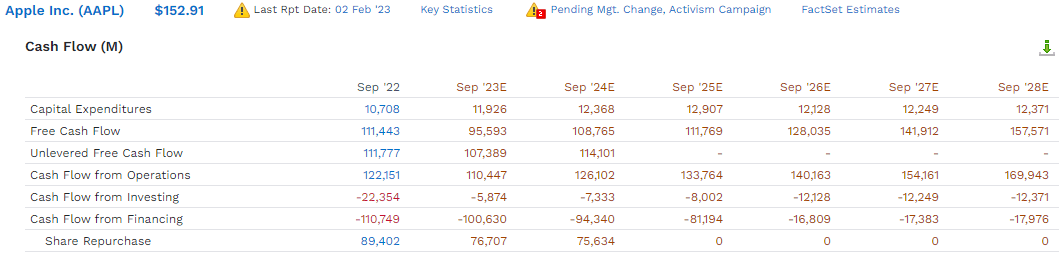
Apple’s free cash flow in 2022 was $111 billion, almost as large as the GDP of Kuwait.
By 2028 it’s expected to grow to $158 billion. That free cash flow is helping Apple be the most generous company in history when it comes to dividends and buybacks.
In 2022 they bought back $89 billion in stock, or $418 million each day the stock market was open.
- $64 million per hour the stock market was open
- over $1 million per minute
Buybacks are expected to slow a bit to “just” $75 billion annually over the next two years.
But remember that Apple is also paying the world’s largest dividend, a glorious $15 billion per year. That’s $90 billion per year in shareholder returns. But remember, Apple is generating over $100 billion per year in free cash flow, meaning its cash position is growing.
FactSet Research Terminal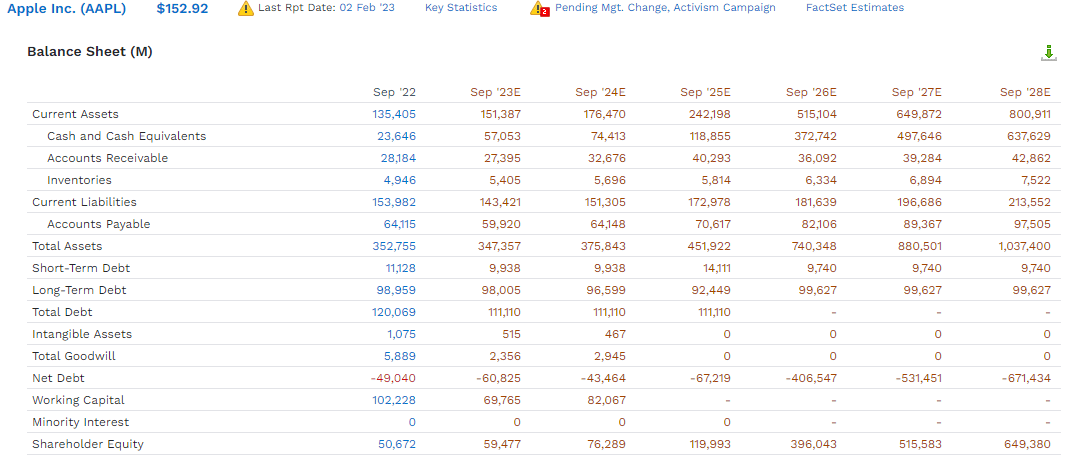
Analysts expect Apple’s net cash position to approach $700 billion in 2028. Those are consensus cash reserves larger than all but three nations on earth.
Wikipedia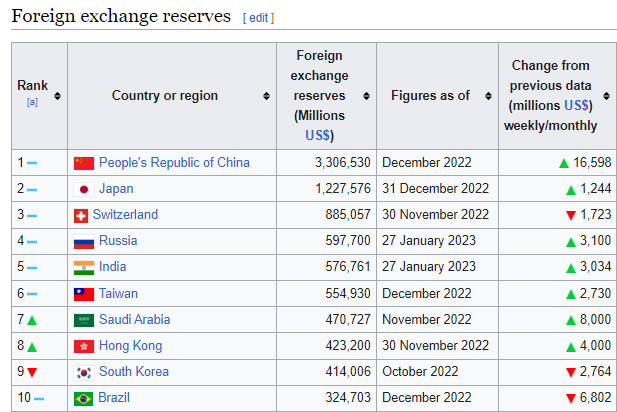
Yes, Apple could end up with the 4th largest net cash reserves on earth in just a few years. And that’s after spending an unbelievable amount on dividends and buybacks over the last decade.
Apple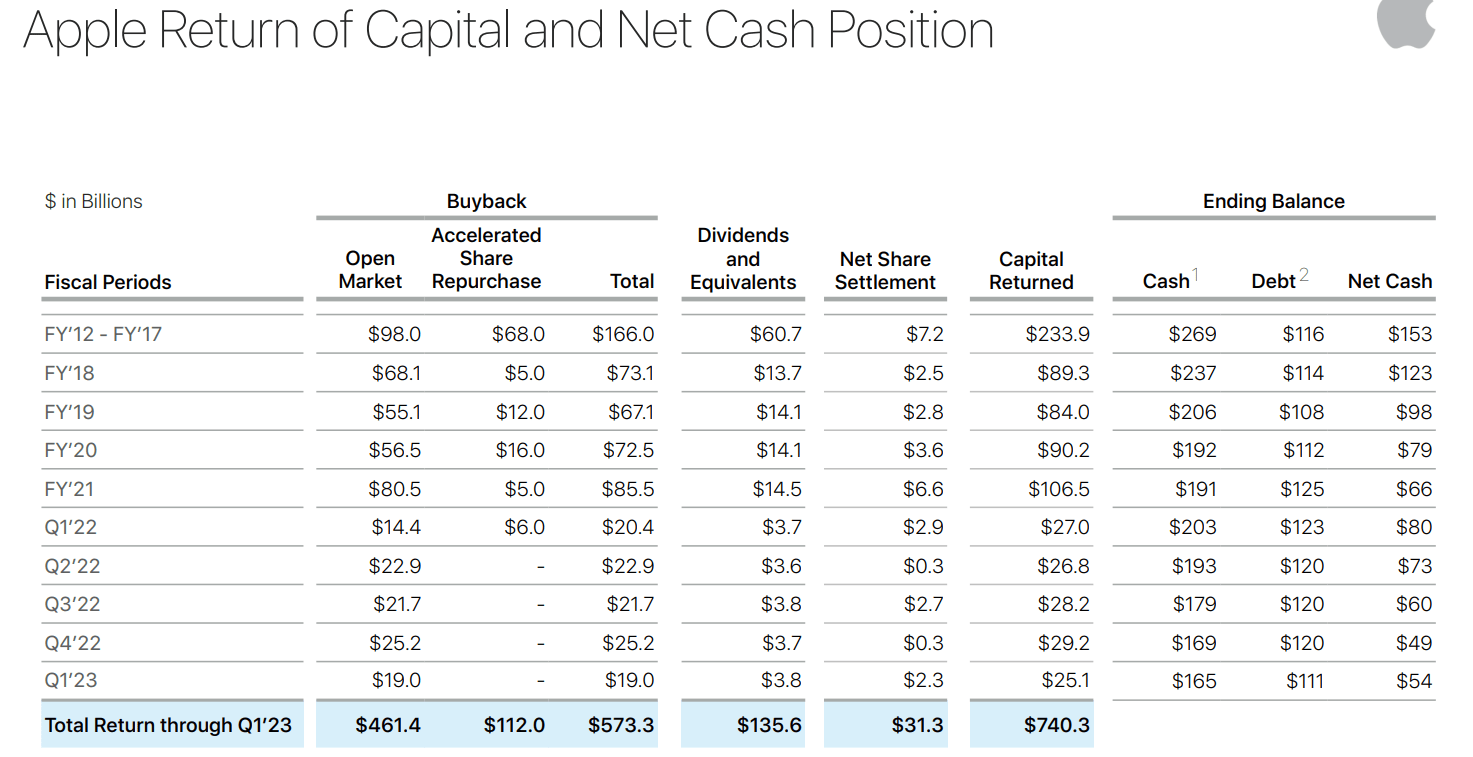
Apple has spent $740 billion on buybacks and dividends over the last decade and is expected to spend about $600 billion more over the next six years.
AND after returning $1.3 TRILLION to shareholders over 16 years, it’s expected to still have almost $700 billion in net cash.
This means over these 16 years, Apple is expected to have generated about $2 trillion in free cash flow.
- $125 billion per year on average
Can you see why Berkshire (BRK.B) has 40% of its portfolio in Apple? This isn’t so much a hardware company as it is a nation unto itself.
In fact, Apple’s AA+ stable credit rating, which implies a 0.29% 30-year default risk, is stronger than almost every country on earth.
Wikipedia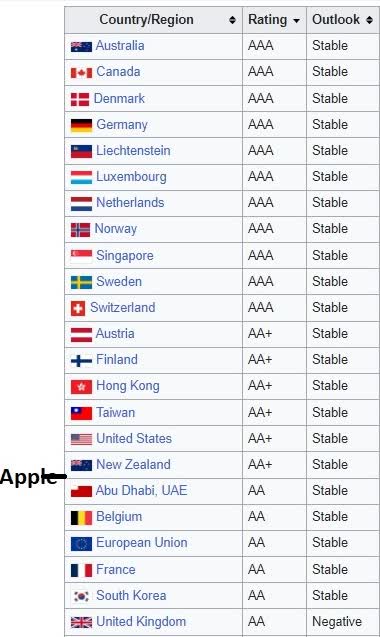
Apple’s credit rating is better than the EU’s, the UK’s, and, according to S&P, as good as America’s!
Just ten countries in the world have stronger credit ratings than Apple.
While no stock is technically “risk-free” Apple sure comes close, assuming you own it for the next 30 years.
OK, so obviously, you’re recommending we all buy Apple today right? This company is absolutely amazing. A money-minting luxury brand that’s all but unsinkable right?
Apple Is A Reasonable Buy
FAST Graphs, FactSet Research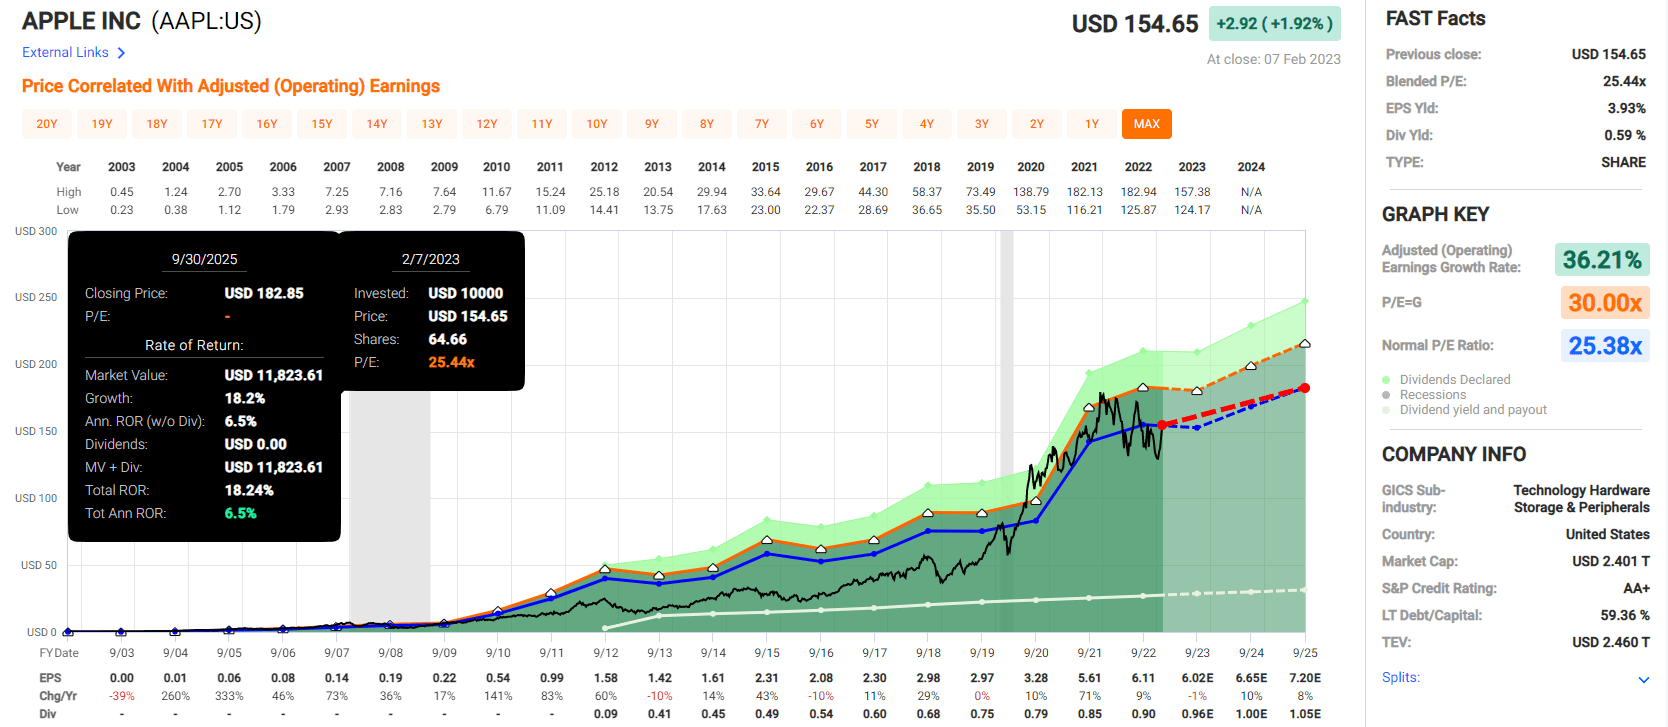
Apple is indeed a reasonable buy, trading at about 25X earnings, in-line with the historical growth rates of GOOG, MSFT, and AMZN (cash flow). It’s cash-adjusted PE is 20X, a Buffett-style wonderful company at a fair price.
- fair value: $158.49
- current price: $152
- discount 4%
- DK rating: potentially reasonable buy
Just remember that Apple’s growth rates aren’t expected to be very good in 2023 -1%. Growth is expected to return to about 9% by 2024; long-term, it’s expected to be 10% to 11%.
FactSet Research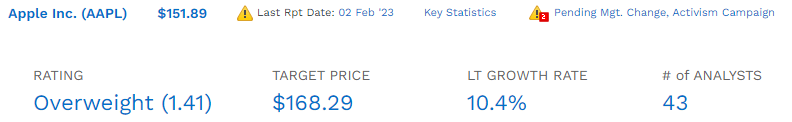
0.6% yield + 10.4% growth means about 11% long-term return potential, 10% more than the S&P 500.
That might be disappointing to long-time investors in Apple who are used to Buffett-like returns. But remember that this is one of the safest companies on earth, with financial fundamentals superior to even the European Union!
Apple Isn’t Perfect
Does that mean that Apple is perfect? Not at all. For example, its long-term risk management rating from S&P is 34th percentile.
| Classification | S&P LT Risk-Management Global Percentile |
Risk-Management Interpretation |
Risk-Management Rating |
| BTI, ILMN, SIEGY, SPGI, WM, CI, CSCO, WMB, SAP, CL | 100 | Exceptional (Top 80 companies in the world) | Very Low Risk |
| Strong ESG Stocks | 86 |
Very Good |
Very Low Risk |
| Foreign Dividend Stocks | 77 |
Good, Bordering On Very Good |
Low Risk |
| Ultra SWANs | 74 | Good | Low Risk |
| Dividend Aristocrats | 67 | Above-Average (Bordering On Good) | Low Risk |
| Low Volatility Stocks | 65 | Above-Average | Low Risk |
| Master List average | 61 | Above-Average | Low Risk |
| Dividend Kings | 60 | Above-Average | Low Risk |
| Hyper-Growth stocks | 59 | Average, Bordering On Above-Average | Medium Risk |
| Dividend Champions | 55 | Average | Medium Risk |
| Monthly Dividend Stocks | 41 | Average | Medium Risk |
| Apple | 34 | Below-Average | Medium Risk |
(Source: DK Research Terminal)
DK uses S&P Global’s global long-term risk-management ratings for our risk rating.
- S&P has spent over 20 years perfecting their risk model
- which is based on over 30 major risk categories, over 130 subcategories, and 1,000 individual metrics
- 50% of metrics are industry specific
- this risk rating has been included in every credit rating for decades
The DK risk rating is based on the global percentile of how a company’s risk management compares to 8,000 S&P-rated companies covering 90% of the world’s market cap.
AAPL scores 34th Percentile On Global Long-Term Risk Management
S&P’s risk management scores factor in things like:
- supply chain management
- crisis management
- cyber-security
- privacy protection
- efficiency
- R&D efficiency
- innovation management
- labor relations
- talent retention
- worker training/skills improvement
- occupational health & safety
- customer relationship management
- business ethics
- climate strategy adaptation
- sustainable agricultural practices
- corporate governance
- brand management
Apple’s empire faces many challenges, and management’s skill at managing those risks is about on par with the likes of:
- Consolidated Edison (ED) dividend aristocrat
- Church & Dwight (CHD) dividend aristocrat
- Broadcom (AVGO)
So now let me share with you why I am buying Autodesk for my family hedge fund.
Autodesk: One Of The Best World-Beater Growth Stocks You Should Own But Probably Don’t
Many investors have never heard of Autodesk but it’s a company most investors want to own if they have.
This company was founded in San Francisco in 1982 and is the world leader in computer-aided design or CAD software.
Autodesk is considered the global industry standard computer-aided design software….
Millions of industry professionals rely on Autodesk software to design and model buildings, manufactured products, animated films, and video games…
We think Autodesk will remain the industry standard as its switching costs and network effect continue to reinforce one another and Autodesk stays at the forefront of industry trends.” – Morningstar
Like Microsoft (MSFT), ADSK has transitioned to a subscription revenue model, creating a very stable recurring cash flow.
What is the major growth catalyst for ADSK? The fact that 70% of its business is from architecture and engineering customers. And 67% of its sales are from outside the US.
Why does that matter? Because according to Bloomberg, over the next 30 years up to $150 trillion in green energy spending might be necessary, creating the 2nd largest investment opportunity in human history.
We consider Autodesk’s Capital Allocation to be Exemplary… We think Autodesk’s internal investment strategy will lead to excellent shareholder returns in the future under CEO Andrew Anagnost….
Anagnost took the helm of Autodesk in 2007 after 20 years working in both technical and strategic positions for the company. ” – Morningstar
Autodesk management has been brilliant at continuing to innovate and disrupt itself, just like Apple has over the years.
That includes buying out its chief rival RevIt in 2002 and pouring money into highly effective R&D to stay one step ahead of the competition.
It also has free educational versions so that university students get trained on its software and then want to keep using it once they get jobs in the construction and engineering industries.
Ycharts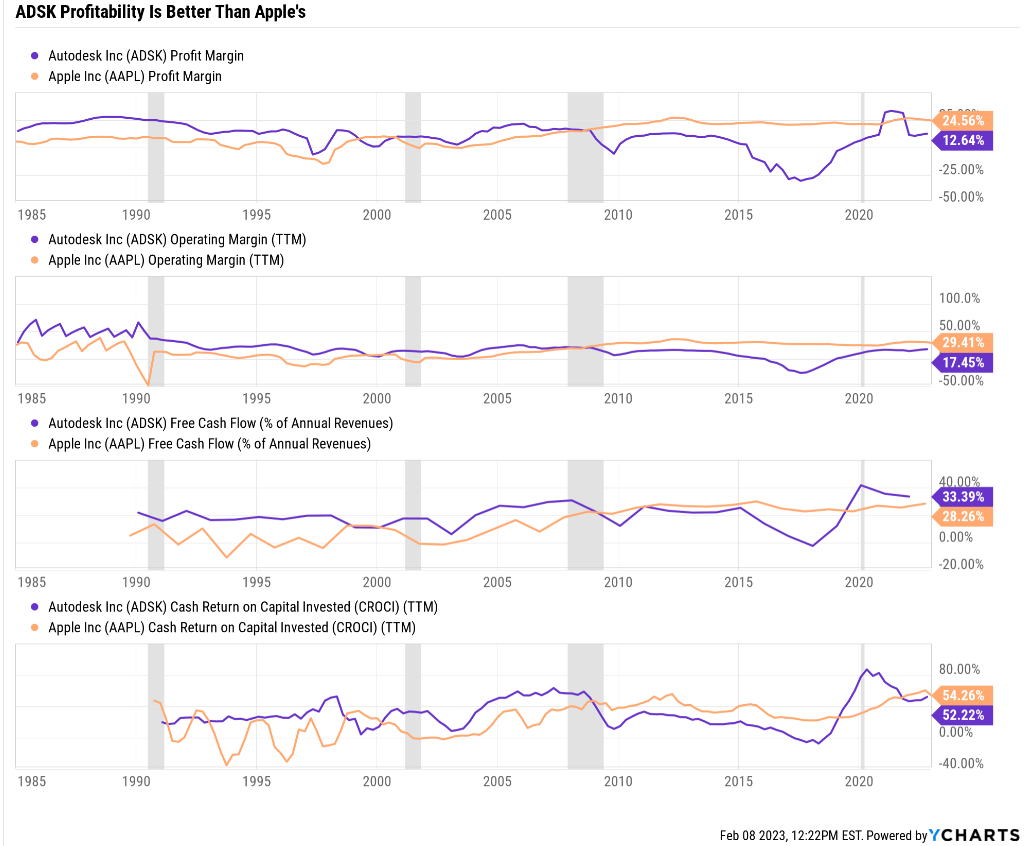
If you like Apple’s profitability, you’ll love Autodesk’s. It’s generating 33% free cash flow margins and cash returns on invested capital of 52%.
And guess what? Analysts expect ADSK’s free cash flow margins to keep improving over the years, reaching 40% in 2026.
That’s free cash flow margins in the top 5% of all companies on earth.
ADSK scores 95th Percentile On Global Long-Term Risk Management
S&P’s risk management scores factor in things like:
- supply chain management
- crisis management
- cyber-security
- privacy protection
- efficiency
- R&D efficiency
- innovation management
- labor relations
- talent retention
- worker training/skills improvement
- occupational health & safety
- customer relationship management
- business ethics
- climate strategy adaptation
- sustainable agricultural practices
- corporate governance
- brand management
S&P considers ADSK one of the best companies on earth at managing its risks, on par with:
| Classification | S&P LT Risk-Management Global Percentile |
Risk-Management Interpretation |
Risk-Management Rating |
| BTI, ILMN, SIEGY, SPGI, WM, CI, CSCO, WMB, SAP, CL | 100 | Exceptional (Top 80 companies in the world) | Very Low Risk |
| Autodesk | 95 |
Exceptional |
Very Low Risk |
| Strong ESG Stocks | 86 |
Very Good |
Very Low Risk |
| Foreign Dividend Stocks | 77 |
Good, Bordering On Very Good |
Low Risk |
| Ultra SWANs | 74 | Good | Low Risk |
| Dividend Aristocrats | 67 | Above-Average (Bordering On Good) | Low Risk |
| Low Volatility Stocks | 65 | Above-Average | Low Risk |
| Master List average | 61 | Above-Average | Low Risk |
| Dividend Kings | 60 | Above-Average | Low Risk |
| Hyper-Growth stocks | 59 | Average, Bordering On Above-Average | Medium Risk |
| Dividend Champions | 55 | Average | Medium Risk |
| Monthly Dividend Stocks | 41 | Average | Medium Risk |
| Apple | 34 | Below-Average | Medium Risk |
(Source: DK Research Terminal)
While ADSK’s balance sheet isn’t AA-rated like Apple’s, its solid BBB+ stable credit means a 5% fundamental risk of losing all your money over the next 30 years.
- credit rating on par with dividend aristocrats and kings such as ENB, ABBV, and LOW
But here is the reason why I added Autodesk to my family hedge fund.
Why Dividend Investors Should Own Autodesk
Adding a stock to any portfolio should improve its fundamentals, whether those be yield, return potential or increasing volatility-adjusted returns.
Don’t just add stocks willy-nilly, because you want to own something. Everything should serve a purpose to avoid “de-worsification.”
FactSet Research Terminal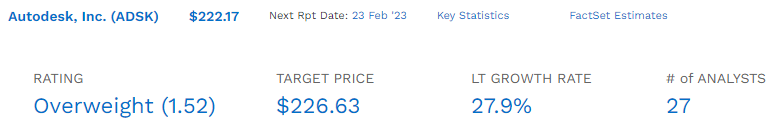
ADSK is the king of hyper-growth among blue-chips, and the fastest growing company we own.
- fair value: $265.50
- current price: $222.34
- discount: 16%
- DK rating: potential good buy
FAST Graphs, FactSet Research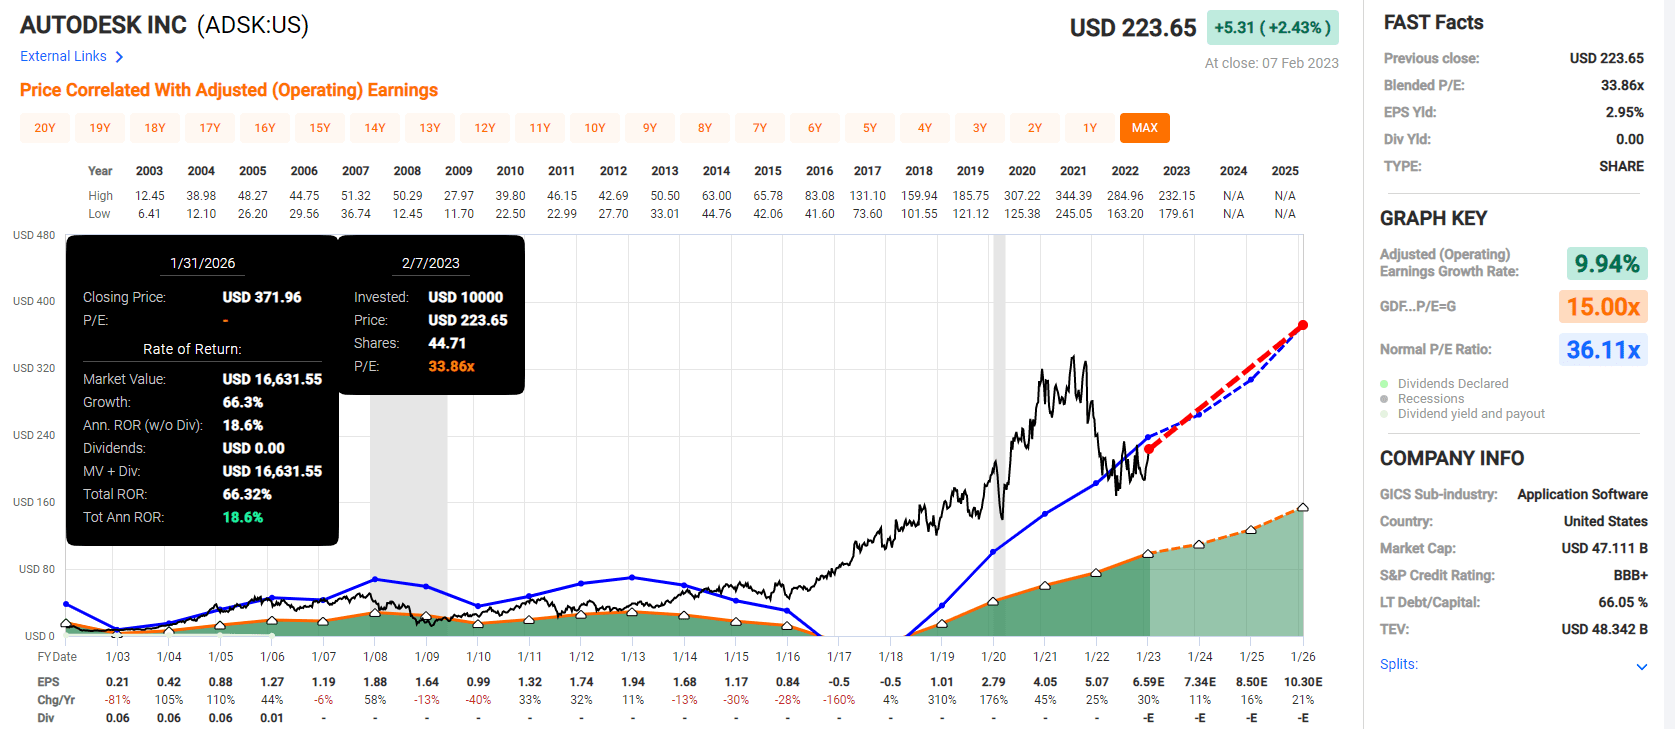
ADSK trades at 24X cash-adjusted earnings for a PEG of 0.86, hyper-growth at a reasonable price.
Adding Autodesk to the hyper-growth blue-chip bucket boosted the return potential by 0.2% and left the yield unchanged.
Dividend Kings ZEUS Income Growth Portfolio: AKA my real money family hedge fund
| Stock | Yield | Growth | Total Return | Weighting | Weighted Yield | Weighted Growth | Weighted Return |
| Dividend Growth ETF Bucket (33.33%) | |||||||
| OMFL | 1.7% | 13.4% | 15.1% | 6.67% | 0.1% | 0.9% | 1.0% |
| VIG | 2.2% | 10.0% | 12.2% | 6.67% | 0.1% | 0.7% | 0.8% |
| SCHG | 0.6% | 12.8% | 13.4% | 6.67% | 0.0% | 0.9% | 0.9% |
| SPGP | 1.2% | 15.2% | 16.4% | 6.67% | 0.1% | 1.0% | 1.1% |
| SCHD | 3.6% | 8.6% | 12.2% | 6.67% | 0.2% | 0.6% | 0.8% |
| Hedging Bucket (33.33%) | |||||||
| EDV | 3.7% | 0% | 3.7% | 10.00% | 0.4% | 0.0% | 0.4% |
| DBMF | 8.5% | 0% | 8.5% | 10.00% | 0.9% | 0.0% | 0.9% |
| KMLM | 9.3% | 0.0% | 9.3% | 13.33% | 1.2% | 0.0% | 1.2% |
| Hyper-Growth Blue-Chip Bucket (16.66%) | |||||||
| AMZN | 0.0% | 28.8% | 28.8% | 3.33% | 0.0% | 1.0% | 1.0% |
| LOW | 2.0% | 20.6% | 22.6% | 3.33% | 0.1% | 0.7% | 0.8% |
| MA | 0.6% | 23.2% | 23.8% | 3.33% | 0.0% | 0.8% | 0.8% |
| ASML | 0.8% | 25.4% | 26.2% | 3.33% | 0.0% | 0.8% | 0.9% |
| ADSK | 0.0% | 27.9% | 27.9% | 3.33% | 0.0% | 0.9% | 0.9% |
| High-Yield Blue-Chip Bucket (16.66%) | |||||||
| BTI | 7.4% | 11.8% | 19.2% | 3.33% | 0.2% | 0.4% | 0.6% |
| ENB | 6.5% | 4.9% | 11.4% | 3.33% | 0.2% | 0.2% | 0.4% |
| MO | 8.0% | 5.5% | 13.5% | 3.33% | 0.3% | 0.2% | 0.5% |
| BAM | 4.1% | 14.6% | 18.7% | 3.33% | 0.1% | 0.5% | 0.6% |
| NEP | 4.4% | 15.0% | 19.4% | 3.33% | 0.1% | 0.5% | 0.6% |
| Total | 3.6% | 13.2% | 16.8% | 100.00% | 4.2% | 9.9% | 14.1% |
(Sources: DK Research Terminal, FactSet, Morningstar)
This portfolio yields 4.2% and has historical and future expected returns of 14.1%.
The long-term income growth is expected to be 12% to 16%, or approximately doubling every five years and quadrupling every decade.
- 8.4% yield on cost in 2033
- 33.6% yield on cost in 2043
- 134% in 2053
Now compare this hedge fund to other popular portfolios and benchmarks.
ZEUS Income Growth vs. 60/40
| Metric | 60/40 | ZEUS High-Yield | X Better Than 60/40 |
| Yield | 2.1% | 4.2% | 2.00 |
| Growth Consensus | 5.1% | 9.9% | 1.94 |
| LT Consensus Total Return Potential | 7.2% | 14.1% | 1.96 |
| Risk-Adjusted Expected Return | 5.0% | 9.9% | 1.96 |
| Safe Withdrawal Rate (Risk And Inflation-Adjusted Expected Returns) | 2.8% | 7.6% | 2.74 |
| Conservative Time To Double (Years) | 26.0 | 9.5 | 2.74 |
(Sources: DK Research Terminal, FactSet, Morningstar)
ZEUS Income Growth vs. 60/40
| Metric | S&P | ZEUS High-Yield | X Better Than S&P 500 |
| Yield | 1.7% | 4.2% | 2.47 |
| Growth Consensus | 8.5% | 9.9% | 1.16 |
| LT Consensus Total Return Potential | 10.2% | 14.1% | 1.38 |
| Risk-Adjusted Expected Return | 7.1% | 9.9% | 1.38 |
| Safe Withdrawal Rate (Risk And Inflation-Adjusted Expected Returns) | 4.9% | 7.6% | 1.56 |
| Conservative Time To Double (Years) | 14.8 | 9.5 | 1.56 |
(Sources: DK Research Terminal, FactSet, Morningstar)
Better return double the yield of a 60/40, double the return potential, almost triple the yield of the S&P, and 40% better return potential.
And with volatility like this.
Riding Over Market Potholes In A Limousine
| Bear Market | ZEUS Income Growth | 60/40 | S&P | Nasdaq |
| 2022 Stagflation | -9% | -21% | -28% | -35% |
| Pandemic Crash | -9% | -13% | -34% | -13% |
| 2018 | -10% | -9% | -21% | -17% |
| 2011 | 4% | -16% | -22% | -11% |
| Great Recession | -20% | -44% | -58% | -59% |
| Average | -9% | -21% | -33% | -27% |
| Average Decline vs. Benchmark | NA | 45% | 28% | 34% |
| Median Decline | -10% | -16% | -28% | -17% |
| Median Decline Vs. Benchmark | NA | 63% | 36% | 59% |
(Sources: Portfolio Visualizer, Charlie Bilello)
During the last five years, this portfolio averaged a peak decline of just 9%, 72% less than the market and 55% less than a 60/40.
Market beating returns, great yield, and not even a correction when the market is down 33%? Sounds too good to be true.
But it’s not.
ZEUS Income Growth Since January 2021 (When KMLM Launched)
(Sources: Portfolio Visualizer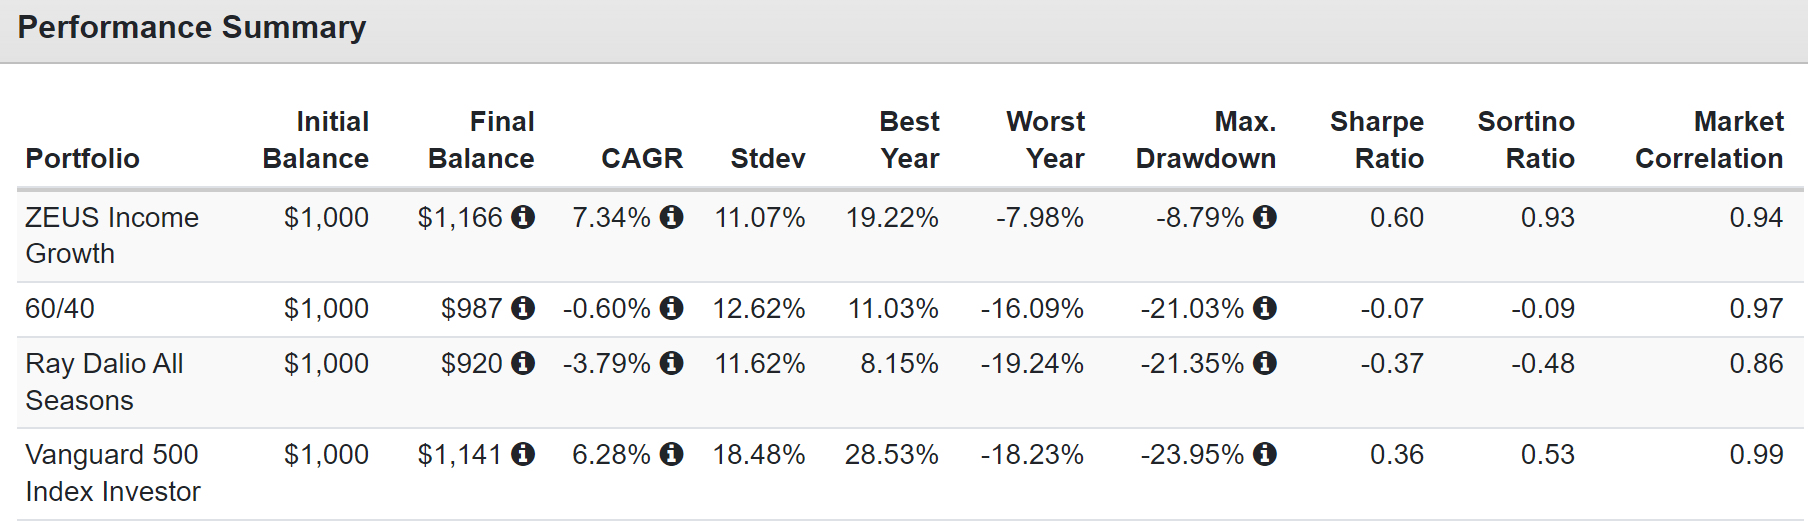
Running circles around the 60/40 and the king of hedge funds, with not even a correction during the stagflationary bear market of 2022.
What kind of income growth did ZEUS Income Growth deliver in 2022?
- 2022 inflation: 8%
- S&P 500: 11%
- dividend growth blue-chips (VIG): 14%
- high-yield blue-chips (SCHD): 18%
- ZEUS Income Growth: 21%
How many of you got a 21% raise last year? Well, my family did, thanks to the eight years of R&D that went into constructing the greatest hedge fund I’ve ever seen.
- 99.97% likely to beat a 60/40 over the next 50 years
- 93.38% likely to beat the S&P 500 over the next 50 years
All told, this portfolio includes 949 of the world’s best blue-chips, representing: s
- small caps
- mid caps
- deep value
- high-yield
- hyper-growth
- Ultra SWAN growth
Bottom Line: Both Apple And Autodesk Can Help Turbocharge Your Income Growth, But Autodesk Is The Far Better Buy Today
Apple and Autodesk are two amazing companies. Today Apple is no longer a hyper-growth Ultra SWAN, but it’s evolved into one of the safest dividend growth stocks on earth.
Its AA+ balance sheet is protected by a mountain of cash, and over $100 billion in annual free cash flow, courtesy of a 2 billion unit installed base and almost 1 billion subscribers.
Its customers are loyal to a fault because the iOS ecosystem is so well-designed and convenient.
It’s become the LVMH of consumer electronics, and today you can buy it at a 4% discount, a classic Buffett- “wonderful company at a fair price.”
In fact, Apple is Buffett’s favorite stock, at 40% of the Berkshire portfolio. Why? Because it’s the arguably the safest way to earn 11% long-term returns on Wall Street.
But for my family’s needs, Autodesk is the hands-down winner, both in terms of valuation and growth.
It’s 12% more undervalued than Apple, trading at a PEG of 0.86, the classic growth at a wonderful price stock.
28% return potential from the world leader in CAD, powered by a $150 trillion mega-trend? Yes, please, I’ll have some of that.
Ultimately both companies are amazing, and we own both, thanks to ETFs like SCHG and soon VIG.
If you trust these companies with your hard-earned savings, I’m confident that you’ll be very happy with the results in 5+ years.
Because what happens in 2023, either with the economy or the stock market, doesn’t matter.
It won’t affect your retirement unless you do something foolish, like panic sell.
But if you’ve built the right diversified Ultra SWAN portfolio for your risk profile and goals? Then having companies like Apple and Autodesk work hard for you is the best way to ensure that one day you won’t have to.
Be the first to comment