

Sean Anthony Eddy
Investment Summary
We’re pleased to report that a number of our healthcare and med-tech longs have started to curl up in H2 FY22. As we roll into the final weeks of the fiscal year, plenty of opportunities remain within these segments. Chief to separating the winners from the losers is identifying the combination of strong return on capital, EPS upside and the ability to clamp surging operating costs (“OpEx”) in our opinion.
We extensively reviewed the investment debate for Apollo Medical Holdings, Inc. (NASDAQ:AMEH) and pulled numerous key findings for this report. Simply, we see flat EPS growth for AMEH into FY23, caused by rising OpEx and the macroeconomic climate. We should note, however, that management have revised their FY22 projections from the top-bottom lines, and its recent acquisitions. Should these pull through to surprise investors come Q4 and FY22 earnings time, this represents key upside risk to the thesis. Hence, whilst rating AMEH a hold at $23.40, at the same time, we are trigger ready on this name. We urge investors to be the same.
AMEH Recent Developments
We note it was a busy period for AMEH on the acquisition front last quarter. In September, it acquired All American Medical Group (AAMG) via its affiliate, along with For Your Benefit (FYB). AAMG is a health care service provider in the San Francisco Bay Area.
Whilst terms of the deal weren’t disclosed, management say it will bring “15,000 Medicare Advantage, Commercial, and Medicaid patients” under AMEH’s umbrella. The deal is expected to close by the end of Q1 FY23′.
Meanwhile, in October, it entered into an agreement to acquire 9 primary care clinics off Valley Oaks Medical Group (VOMG). The clinics are spread between Las Vegas, Houston and Fort Worth. Not only does this expand AMEH’s membership base in these regions, the move now establishes AMEH’s footprint into Nevada and Texas. Investors should note the company expects this deal to finalize by the end of Q4 this year.
Q3 financial results illustrative of multiple growth levers in place
Turning to the quarter, we should note the 40% YoY growth in turnover to $317mm. The growth was underscored by large revenue share to capitated revenue. Specifically, capitated revenues stretched up 53% YoY to $227.6mm, contributing ~72% to the top line in Q3.
Underpinning growth in capitated revenues was organic memberships in AMEH’s core independent growth associations (“IPAs”), and thanks to its Medicare fee for service revenue model.
Switching back to the financial results, we saw OpEx run in with a 53%/$93mm YoY increase to $266.9mm [$6.08/share]. This is a notable size-up that could clamp NOPAT and EPS growth if the company lets this pace continue. We see this as Q3 EPS declined 24% YoY. The increase stemmed as Medicare sequestration reverted back to 2% on July 1st. This, along with the company’s growth in memberships, tacking on more variable expenditure. As mentioned, due to the increased OpEx number, we note that AMEH brought this down to quarterly net earnings of $0.56 [24% decrease vs. $0.74 last year] on adjusted EBITDA of $57.1mm, also down 10.15% YoY.
A summary of AMEH’s operating walk through is observed in Exhibit 1.
Exhibit 1. AMEH continues to push revenue upside with core EBITA growth following suit
Data: HB Insights, AMEH SEC Filings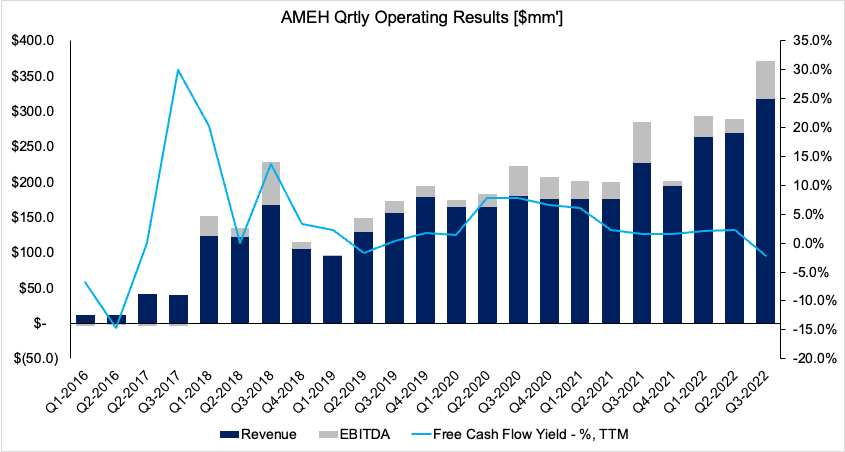
Additional takeouts from the quarter are as follows:
- We observed AMEH recognized a 15.4%, or $48.8mm, gain from shared savings settlement at the revenue ledger. Management said this is due to “participation in an accountable care model for the 2021 performance year”. We surmise the gain is a reflection of the company taking on a higher risk corridor within the accountable care model across 2021. Subsequently, we note this resulted in a $27mm YoY increase from the last year’s shared savings settlement.
- Revenue from risk pool settlements increased ~800bps to $64.8mm, levered by the $27mm gain in shared savings settlements listed above. Notably, there’s still some drag on settlements from the pandemic era. Hence, growth in this metric could be a mid-term tailwind for the company in our opinion.
- In keeping with the above point, we note to investors that turnover from AMEH’s fee for service stream scored 77% higher to $12.9mm. This is well up from $7.3mm the year prior. Spurring the gain, a $4mm gain on the consolidation of Sun Labs in FY21′, along with patient trends normalizing toward pre-pandemic levels.
- It’s also worth noting that AMEH’s membership base increased to 1.2mm managed lives during the period. Around 50% of these fall under capitated arrangements made through the company’s list of core IPAs.
- Finally, we examined the relationship between AMEH’s FCF flows and its trailing return on invested capital [Exhibit 2]. What’s most pleasing to the eye is the divergence in FCF and ROIC since Q4 FY21. To us it spells that AMEH is investing its free cash wisely and accelerating its TTM ROIC, to c.10% in the last quarter. This adds a bullish weight to the risk/reward calculus. Moreover, it is incredibly important looking ahead, particularly as the company’s WACC hurdle lifted to 9.2% last month. Thus, we note that AMEH’s ROIC-WACC spread is just 70-80bps at the minute.
Exhibit 2. Positive divergence in ROIC to FCF. The FCF outflow coupled with stretching ROI is evidence of proficient capital budgeting in our estimation.
Data: AMEH SEC Filings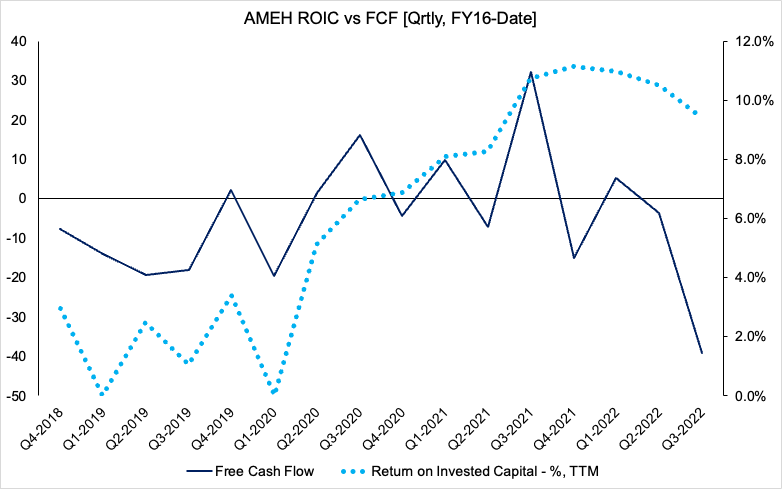
Raised guidance points to upside risk to thesis
Management revised FY22 guidance to the upside, from the top line vertically down the P&L. We note this stems from the strong quarterly performance in Q3. It now foresees a revenue range of $1.095-$1.115Bn [from $1.05-$1.085Bn previously], on revised core EBITDA of $107.5mm-$133.5mm, a 32%-20.3% increase respectively. Meanwhile, it projects net earnings of $67mm at the upper range.
The company forms its growth assumptions from its performance this quarter, that saw its run-rate pick up across the board. We agree with management’s appraisal, and project similar revenue growth levels for this year. Our revenue estimates are $1.11Bn in FY22, stretching up to $1.4Bn by the end of FY24 – a 26% absolute increase across the 2 years.
We’ve also projected FY22′ EPS of $1.16. However, we also opine that AMEH’s operating cost base will continue to lift as it secures new members, coupled with the reinstatement of sequestration at the 2% rate. Alas, we project a decrease in EPS to ~$1.00 in FY23, before a recovery to $1.44 the following year.
You can see our forward AMEH revenue and EPS assumptions in Exhibit 3 and 4 respectively.
Exhibit 3.
Data: HBI estimates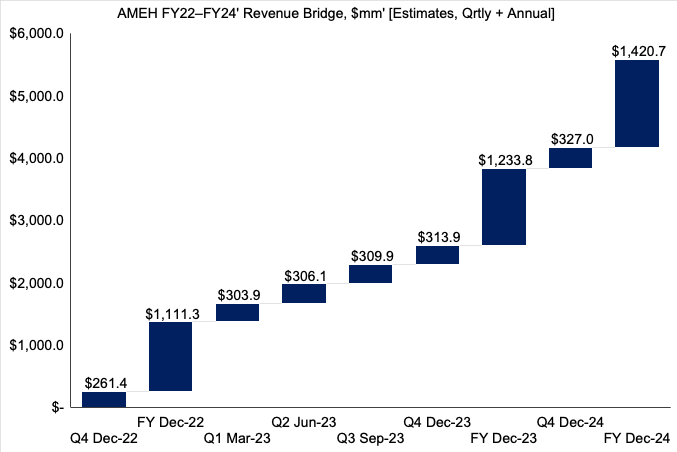
Exhibit 4.
Data: HBI Estimates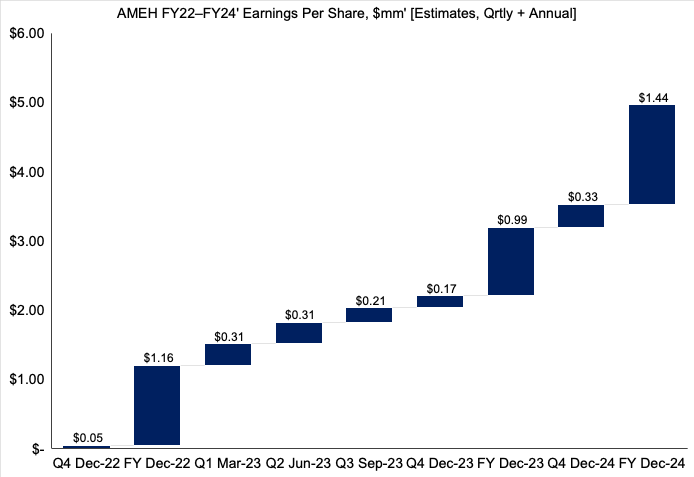
Valuation and conclusion
It’s worth advising that consensus values AMEH at 23.5-25.8x forward P/E, ahead of the S&P 500 forward estimate of 18.18x. Hence, the market has priced the stock to outperform the benchmark looking ahead. We agree with this sentiment. However, the question really is what the forecasted decrease in EPS means specifically for AMEH’s outlook on the chart.
Rolling our FY22 EPS assumptions forward, we see AMEH trading on a fair forward P/E of 20.15x, below consensus [Exhibit 5].
Alas, we believe AMEH has the potential to re-rate to ~$23.40. This supports our neutral viewpoint as well. We acknowledge the argument that investors may have already priced in this EPS decline into the AMEH share price. If that is the case, however, there’s still little to attach onto in the form of EPS upside or broad market bullishness when looking ahead.
Exhibit 5. Fair forward P/E x FY22′ EPS Est. = $23.40.
Note: Fair forward price-earnings multiple calculated as 1/fair cost of equity. This is known as the ‘steady state’ P/E. For more and literature see: [M. Mauboussin, D. Callahan, (2014): What Does a Price-Earnings Multiple Mean?; An Analytical Bridge between P/Es and Solid Economics, Credit Suisse Global Financial Strategies, January 29 2014]. (Data: HBI Estimates)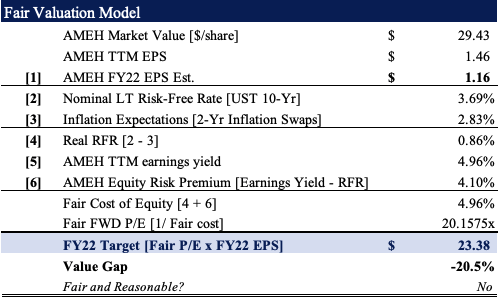
Net-net, with little supportive EPS growth downstream [from internal forecasts], coupled with potential OpEx pressures looking ahead, we see AMEH valued fairly at $23.40. However, there’s still plenty to like about this name. Given the imbalance in forecasted revenue growth to EPS growth, there’s still reason to remain trigger-ready in this name. Rate hold, price target $23.40.
Be the first to comment