

Maks_Lab/iStock via Getty Images
By John R. Mousseau, CFA
Another Bad Quarter for Bonds — some of the usual suspects to blame but some hope going forward.
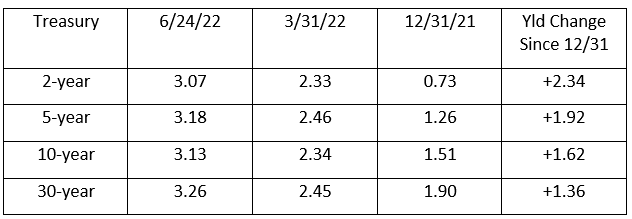
The second quarter of 2022 was another brutal one for fixed-income instruments, with yields rising across the board.
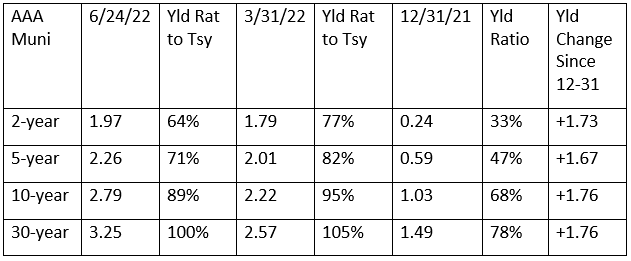
The story was even worse for tax-free munis. Here are the AAA tax-free muni yields and their yield ratios to Treasuries.
Let’s round up the usual suspects.
The Federal Reserve
The Fed began to raise short-term interest rates in response to the stubborn inflation numbers starting in March. In our opinion, this hiking of the fed funds target rate should have started last summer — when we had already started to see the rise in the inflation rate post-pandemic.
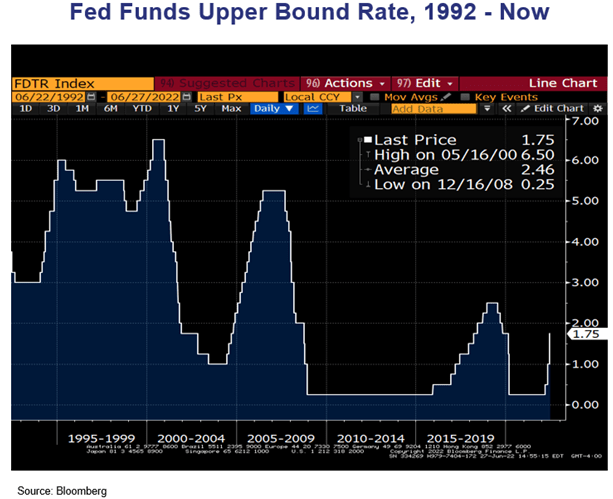
The Fed is on the SHARPEST upward movement in the fed funds target rate since 1994, as is displayed in this graph. The Fed’s hiking, coupled with their sharply more hawkish rhetoric, has spooked all bond markets since March and through the second quarter. The hike of 75 basis points this month is expected to be met by another one next month. At the same time, the Fed has ended their quantitative easing. (Again, in our opinion, this ended about six months before it should have.) Of course, the raising of short-term rates is felt across the economy, from adjustable-rate loans to credit card finance rates and in the mortgage market.
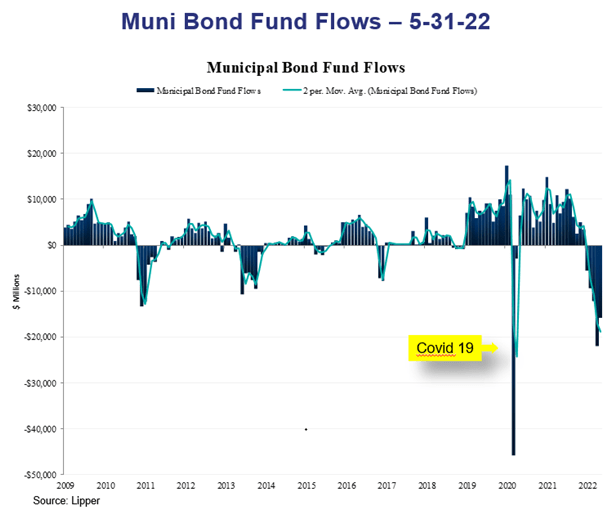
Bond fund liquidations
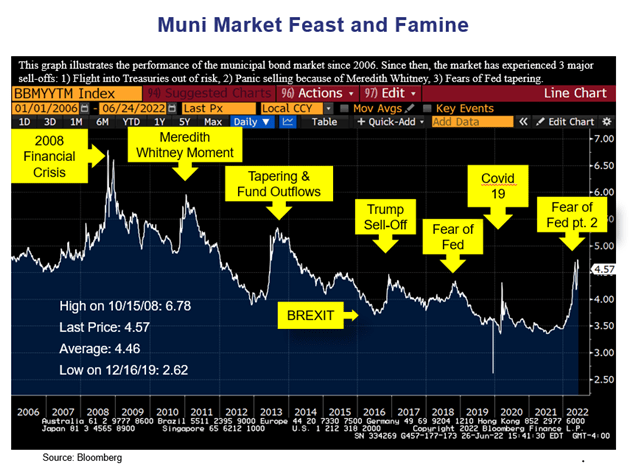
As the chart below shows, bond fund liquidations have been severe. With the exception of the sharp selloff triggered by COVID (followed by a quick rebound), liquidations have been the worst in recent history. Bond fund liquidations tend to feed on themselves and are often fueled by significant inflows preceding the outflows (as seen in 2021). Recently we have begun to see outflows slow down (become less negative). All the muni bond fund selloffs in the “Muni Feast and Famine” chart below have the common denominator of fund outflows.
Inflation
There is no question that inflation and inflation expectations have also spooked the bond markets.
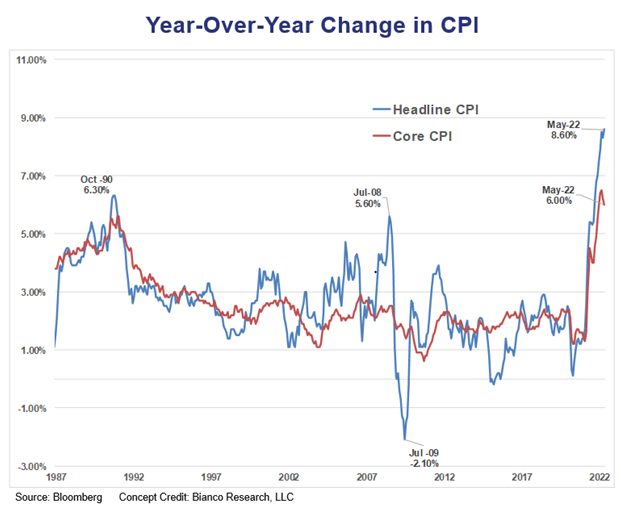
Both CPI and CORE CPI are at elevated levels. The Federal Reserve pulled back on their “transitory” characterization of inflation several months ago, and this shift has gone hand in hand with the increased pace of short-term rate hikes.
Is there a light at the end of the tunnel? We think so.
Though inflation is elevated, the bond market DERIVED expectation of inflation through breakeven inflation rates is much lower. The chart below shows the 10-year breakeven inflation rate.
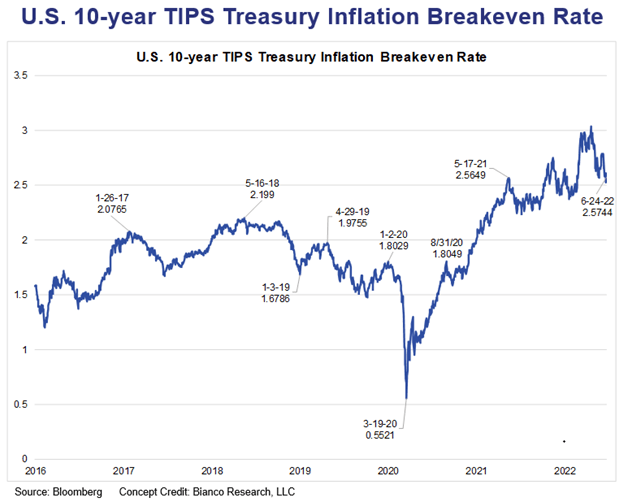
But the markets’ EXPECTATION of inflation is much closer to the longer-term run rate of inflation. The breakeven inflation rate, derived from the difference in yields between the real yield on a 10-year Treasury Inflation-Indexed Bond (TIP) and the nominal yield on a 10-year US Treasury is hovering at around 2.6%; and while that is much higher than during COVID, it is only marginally higher than a year ago. In other words, the markets believe that the Fed should be reasonably successful in fighting inflation going forward. While this indicator is not necessarily a better predictor of inflation than other measures are, it is market-derived. This is a testament to the Fed’s success over the past 40 years of lowering long-term inflation expectations.
Commodity prices have started to soften.
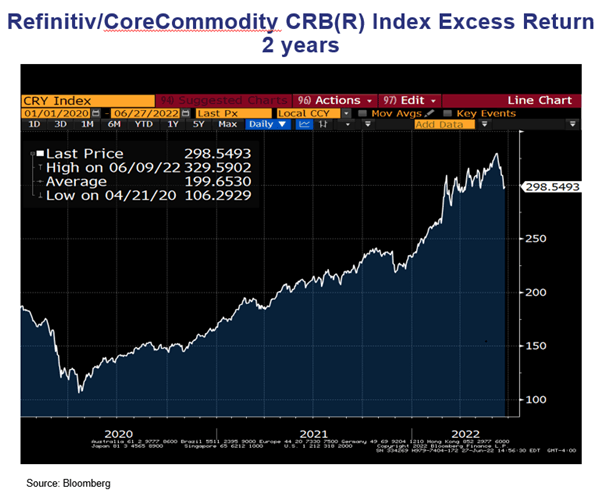
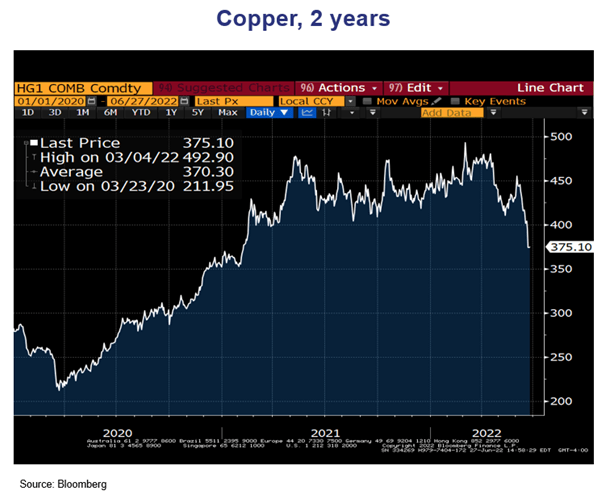
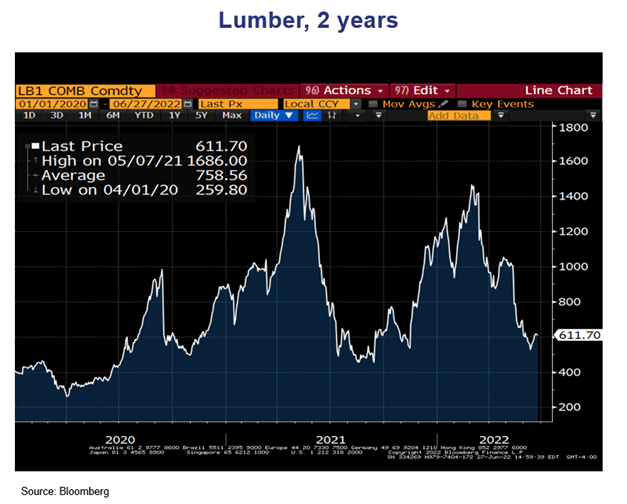
Inflation itself is a lagging indicator — an indicator that may stay on a trend while the economy has turned on another trend. In addition to lumber, copper, and commodities in general, things like shipping rates have also started to drop. In other words, inflation may have peaked, though clearly food and fuel prices have been driven up by the war in Ukraine.
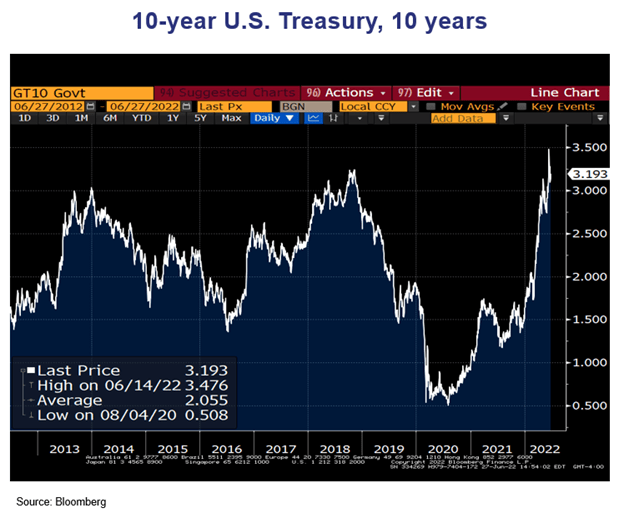
Bond yields are now much higher than they were. Tax-free municipal bonds are very cheap, in our opinion, with 4%-plus yields offering taxable equivalent yields ranging from 6.3% to over 8% depending on state taxes and exemption. That is certainly a different environment than we had been in since the summer of 2020. And it is important to remember that these higher par coupon levels, when reinvested, can contribute mightily to longer-term returns on bond portfolios. This is not to discount the damage the bond market has undergone. But we feel that, from these levels, bonds are more attractive than they have been in quite a while.
It is our contention that the meltdown in the muni market was not caused so much by the level of interest rates (indeed 10- and 30-year Treasuries are at yield levels where they were at the end of 2018). Rather, it is the swiftness of the increase in rates that spooked bond fund investors.
So, as we start the third quarter of the year, we believe we will see some reversion to the mean in bond yields, particularly with tax-free bonds. Backing this expectation up is the turndown in commodity prices and drops in housing starts, sales of both existing and new homes, retail sales, etc. All of these trends suggest that the sharp uptick in yields we witnessed in the first half of this year should begin to moderate — with help from the usual suspects.
Editor’s Note: The summary bullets for this article were chosen by Seeking Alpha editors.
Be the first to comment