

sarawuth702
By Emerald Yau, Head of Equity Index Product Management Asia and Miko Huang, Manager, Equity Index Product Management Asia
Resilient growth despite a challenging environment globally
Against the challenging environment and increasingly dimming economy globally in 2022 – from a slowing China economy in the east to a very hawkish Fed in the west, to geopolitical tensions from Ukraine to Asia – Southeast Asian countries represent a rare part of the world that have delivered impressive resilience.
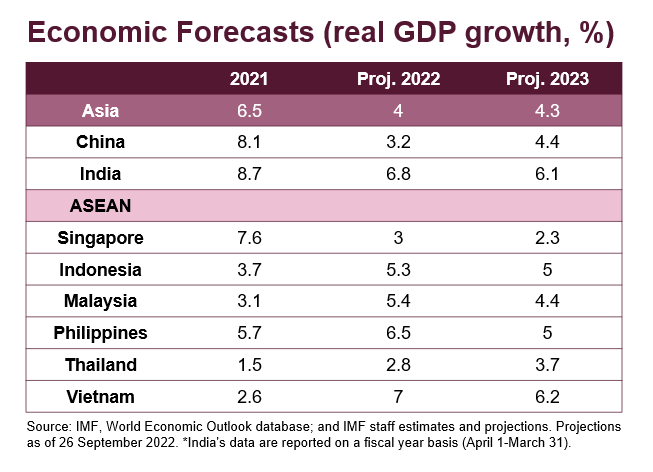
These countries – sometimes together known as the ASEAN region – have reopened post-Covid. Growth normalized or even rebounded strongly. The International Monetary Fund (IMF) projects that the ASEAN economy will grow 5.6% in 2022 and 6% in 2023, outpacing the projected growth of global GDP (3.2% and 2.9% in 2022 and 2023 respectively). ASEAN equities together is increasingly emerging as a distinct asset class.
The ASEAN region consists of a diverse group of Southeast Asian countries benefiting from various growth drivers. Vietnam, gaining from the global supply chain diversification and transforming into another manufacturing powerhouse, is the best performing economy in Asia in 2022, expecting a 7% growth in 2022. The Philippines is forecast to see a 6.5% expansion this year, helped by factors like tourism recovery and infrastructure spending. Indonesia and Malaysia benefited from strong commodity prices earlier this year and are expected to see growth topping 5%. Thailand is expected to grow faster next year, driven by a pickup in the vital tourism sector after reopening.
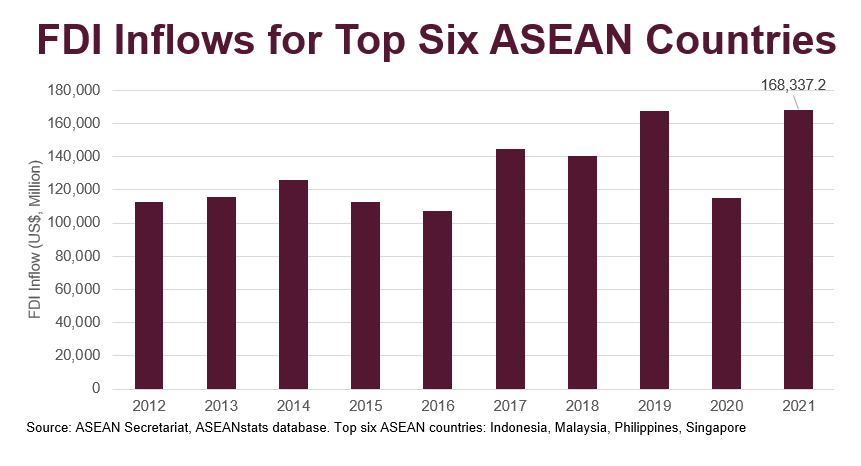
Favorable structural tailwinds, such as supply chain relocation, favorable demographics, and supportive policy to invest in infrastructure are all helping ASEAN propel forward. Foreign direct investment (FDI) inflows into ASEAN continue to be an engine of growth. FDI into the six largest ASEAN economies – Indonesia, Malaysia, the Philippines, Singapore, Thailand, and Vietnam – rose to $168 billion in 2021, the pre-pandemic record. Singapore is the largest FDI recipient. Vietnam also receives strong technology manufacturing-related inflows as major multinationals like Samsung (OTCPK:SSNLF) are building and expanding their presence in the country.
Complementary mix of opportunities
The FTSE ASEAN Index, an index under the FTSE Global Equity Index Series and comprises of large- and mid-cap companies listed in the original five ASEAN countries, reflects the unique opportunities presented by each economy.
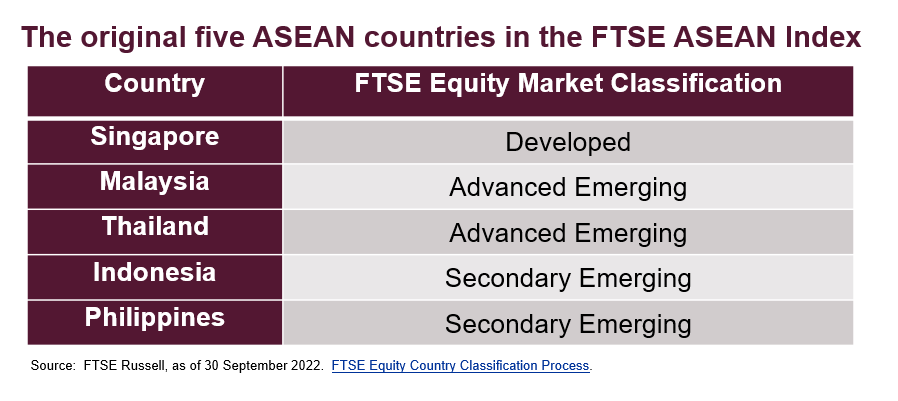
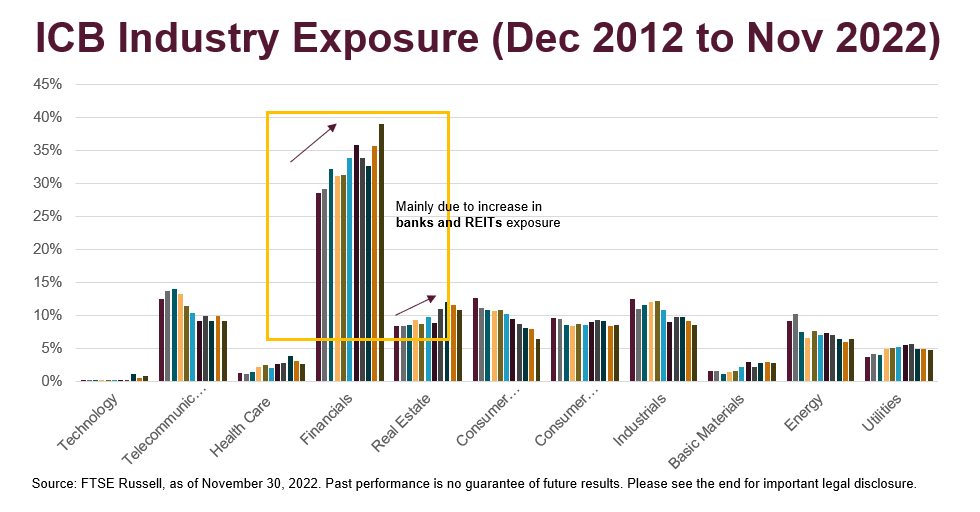
Being at different stages in terms of their economic advancement, these countries tend to offer complementary rather than competing opportunities. For example, Singapore is home to dominating regional banks and dividend-generating REITs. Thailand houses a few large energy and utility companies, including a few focusing on renewable energy. Indonesia and Malaysia see more consumer companies, particularly related to auto, food producers, and palm oil businesses. Meanwhile, the Philippines offers a more even opportunity set across industries.
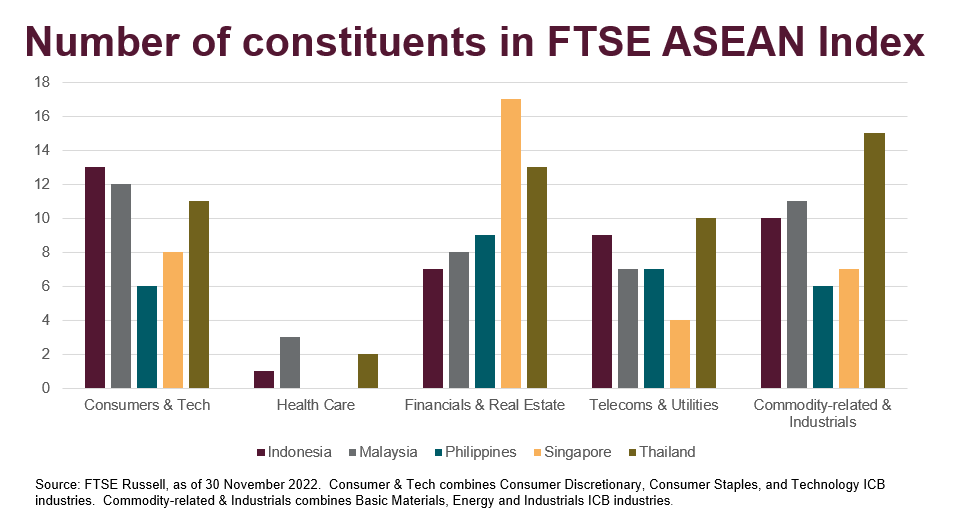
Overall, the Financials and Real Estate industries display a heavy weight of almost 50% in the FTSE ASEAN Index as of 30 November 2022, with the largest five constituents in the index being top banks from Singapore and Indonesia.
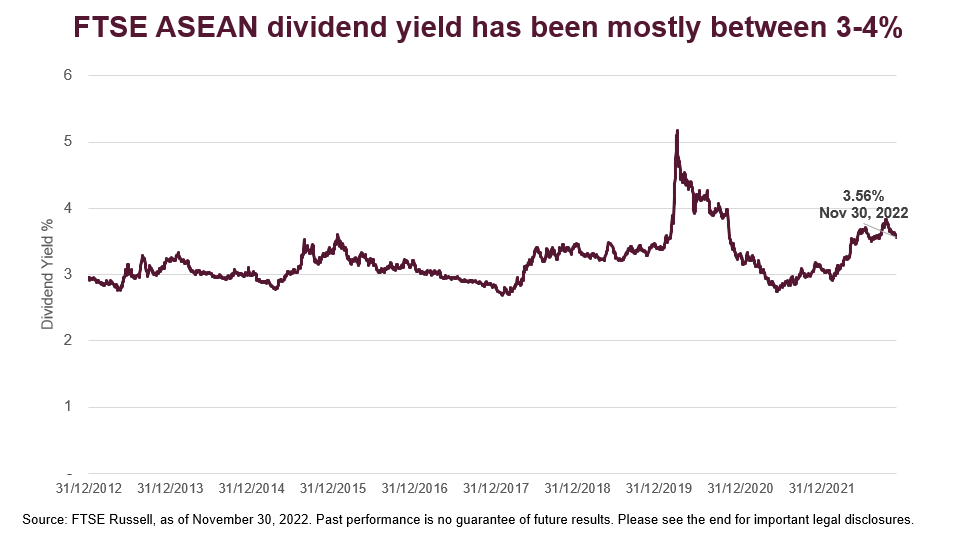
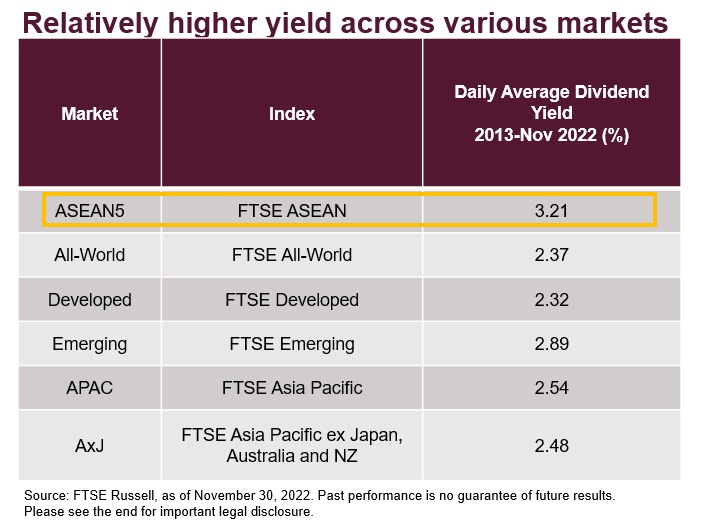
The heavier exposure to value-driven sectors also leads the FTSE ASEAN Index to deliver a relatively higher yield than the broader global markets. In the past decade, the dividend yield of the index has hovered between 3% to 4%.
Meanwhile, Vietnam remains a Frontier country as per the FTSE Equity Country Classification. The relocation of multinational supply chains and strong FDI inflows have lifted consumption and real estate demand in Vietnam. These two areas see the most exposure (61.2% in terms of weighting as of 30 November 2022) in the FTSE Frontier Large Mid Cap Vietnam Index, which measures the performance of large and mid-cap companies traded in Vietnam.
A relative bright spot post-Covid
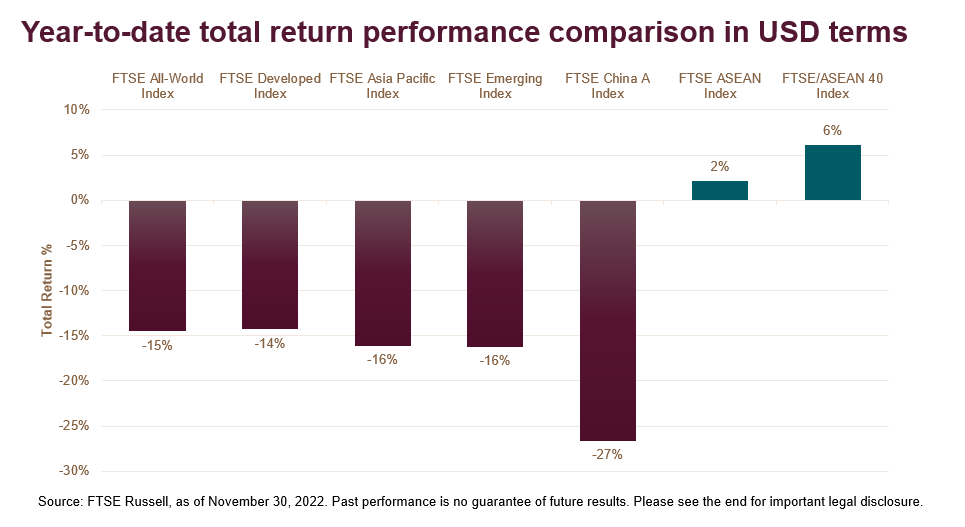
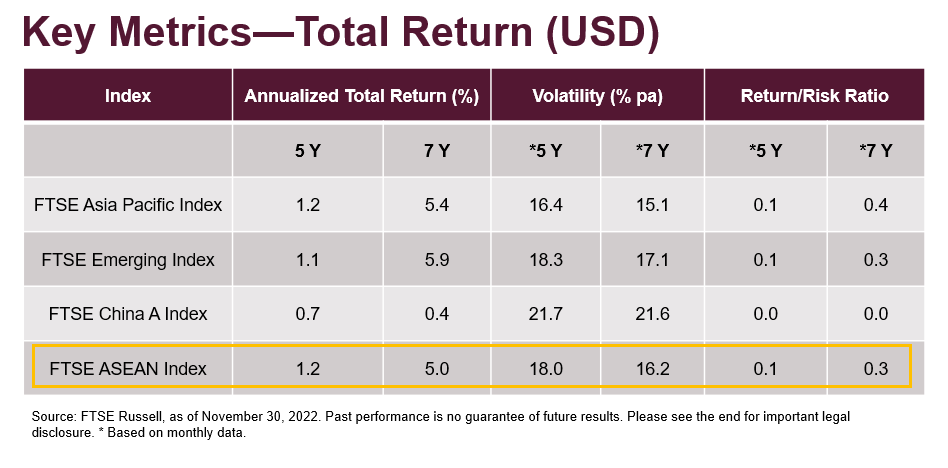
This year has been characterized by rising geopolitical tensions, higher inflation and monetary tightening around the world. While many markets are suffering a double-digit decline year-to-date, the FTSE ASEAN Index earns a positive return of 2% in US dollar terms with the support of reopening post-Covid, the positive projected growth of GDP and the resilient FDI. Over a longer-term horizon, at the time of writing, the FTSE ASEAN Index delivered comparable return and volatility, compared to the benchmark indices of APAC, emerging and China A-share.
Not without risk, but a rising asset class in Asia
ASEAN has emerged as a vibrant asset class, with a basket of countries complementary to one another given them being in different stages within the lifecycle. While the value and cyclical industries like financials, real estate and telecommunications currently dominate in ASEAN, these countries are now diversifying their economies with a push into innovation, such as technology, digitalization and e-commerce.
Just like any investment decision-making, investing in ASEAN would also require thorough studies by investors. Rising inflation pressure, tighter financial conditions, potentially weaker global demand under a recessionary scenario, and impact on exports are some of the challenges that investors should be aware of.
That said, the combination of tradition and innovative business development lifts the potential for ASEAN to become an economic force to be reckoned with in the world. This overlooked gem in Asia has shone in 2022.
© 2022 London Stock Exchange Group plc and its applicable group undertakings (the “LSE Group”). The LSE Group includes (1) FTSE International Limited (“FTSE”), (2) Frank Russell Company (“Russell”), (3) FTSE Global Debt Capital Markets Inc. and FTSE Global Debt Capital Markets Limited (together, “FTSE Canada”), (4) FTSE Fixed Income Europe Limited (“FTSE FI Europe”), (5) FTSE Fixed Income LLC (“FTSE FI”), (6) The Yield Book Inc (“YB”) and (7) Beyond Ratings S.A.S. (“BR”). All rights reserved.
FTSE Russell® is a trading name of FTSE, Russell, FTSE Canada, FTSE FI, FTSE FI Europe, YB and BR. “FTSE®”, “Russell®”, “FTSE Russell®”, “FTSE4Good®”, “ICB®”, “The Yield Book®”, “Beyond Ratings®” and all other trademarks and service marks used herein (whether registered or unregistered) are trademarks and/or service marks owned or licensed by the applicable member of the LSE Group or their respective licensors and are owned, or used under licence, by FTSE, Russell, FTSE Canada, FTSE FI, FTSE FI Europe, YB or BR. FTSE International Limited is authorised and regulated by the Financial Conduct Authority as a benchmark administrator.
All information is provided for information purposes only. All information and data contained in this publication is obtained by the LSE Group, from sources believed by it to be accurate and reliable. Because of the possibility of human and mechanical error as well as other factors, however, such information and data is provided “as is” without warranty of any kind. No member of the LSE Group nor their respective directors, officers, employees, partners or licensors make any claim, prediction, warranty or representation whatsoever, expressly or impliedly, either as to the accuracy, timeliness, completeness, merchantability of any information or of results to be obtained from the use of FTSE Russell products, including but not limited to indexes, data and analytics, or the fitness or suitability of the FTSE Russell products for any particular purpose to which they might be put. Any representation of historical data accessible through FTSE Russell products is provided for information purposes only and is not a reliable indicator of future performance.
No responsibility or liability can be accepted by any member of the LSE Group nor their respective directors, officers, employees, partners or licensors for (a) any loss or damage in whole or in part caused by, resulting from, or relating to any error (negligent or otherwise) or other circumstance involved in procuring, collecting, compiling, interpreting, analysing, editing, transcribing, transmitting, communicating or delivering any such information or data or from use of this document or links to this document or (b) any direct, indirect, special, consequential or incidental damages whatsoever, even if any member of the LSE Group is advised in advance of the possibility of such damages, resulting from the use of, or inability to use, such information.
No member of the LSE Group nor their respective directors, officers, employees, partners or licensors provide investment advice and nothing in this document should be taken as constituting financial or investment advice. No member of the LSE Group nor their respective directors, officers, employees, partners or licensors make any representation regarding the advisability of investing in any asset or whether such investment creates any legal or compliance risks for the investor. A decision to invest in any such asset should not be made in reliance on any information herein. Indexes cannot be invested in directly. Inclusion of an asset in an index is not a recommendation to buy, sell or hold that asset nor confirmation that any particular investor may lawfully buy, sell or hold the asset or an index containing the asset. The general information contained in this publication should not be acted upon without obtaining specific legal, tax, and investment advice from a licensed professional.
Past performance is no guarantee of future results. Charts and graphs are provided for illustrative purposes only. Index returns shown may not represent the results of the actual trading of investable assets. Certain returns shown may reflect back-tested performance. All performance presented prior to the index inception date is back-tested performance. Back-tested performance is not actual performance, but is hypothetical. The back-test calculations are based on the same methodology that was in effect when the index was officially launched. However, back-tested data may reflect the application of the index methodology with the benefit of hindsight, and the historic calculations of an index may change from month to month based on revisions to the underlying economic data used in the calculation of the index.
This document may contain forward-looking assessments. These are based upon a number of assumptions concerning future conditions that ultimately may prove to be inaccurate. Such forward-looking assessments are subject to risks and uncertainties and may be affected by various factors that may cause actual results to differ materially. No member of the LSE Group nor their licensors assume any duty to and do not undertake to update forward-looking assessments.
No part of this information may be reproduced, stored in a retrieval system or transmitted in any form or by any means, electronic, mechanical, photocopying, recording or otherwise, without prior written permission of the applicable member of the LSE Group. Use and distribution of the LSE Group data requires a licence from FTSE, Russell, FTSE Canada, FTSE FI, FTSE FI Europe, YB, BR and/or their respective licensors.
Editor’s Note: The summary bullets for this article were chosen by Seeking Alpha editors.
Be the first to comment