


ferrantraite
Earnings of Ameris Bancorp (NASDAQ:ABCB) will partially recover next year on the back of moderate loan growth. Further, the recent improvement in the deposit mix and the up-rate cycle will let the margin expand in future quarters. Overall, I’m expecting Ameris Bancorp to report earnings of $5.11 per share for 2022, down 5.5%, and $5.24 per share for 2023, up 2.5% year-over-year. Compared to my last report on the company, I’ve increased my earnings estimates following the third quarter’s stronger-than-expected loan growth. The December 2023 target price suggests a high upside from the current market price. Therefore, I’m maintaining a buy rating on Ameris Bancorp.
Raising the Loan Balance Estimate
Ameris Bancorp’s loan growth remained at a remarkably high level in the third quarter, which beat my expectations. The portfolio increased by 7.1% during the quarter, leading to a growth of 18.6% for the first nine months, or 25% annualized.
The outlook for loan growth is mixed. The company’s loan portfolio is well diversified among loan segments, as shown below.
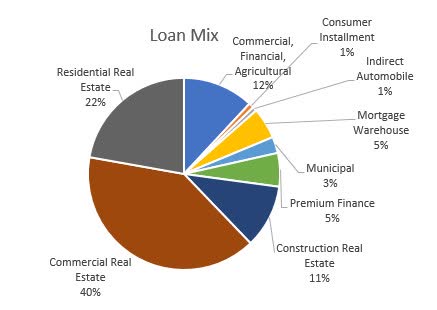
3Q 2022 10-Q Filing
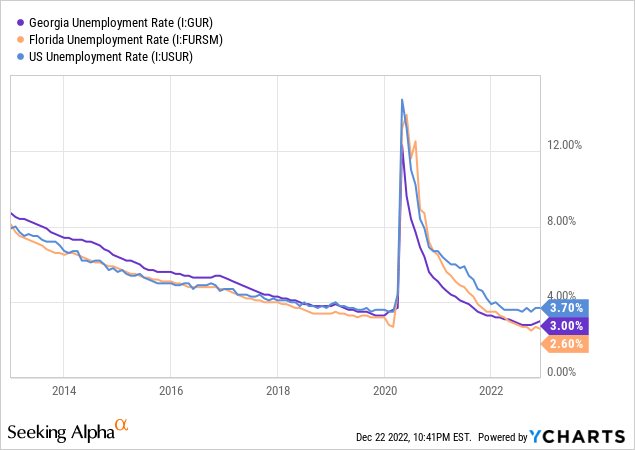
With the exception of residential mortgages, the outlook is bright for all loan segments. Residential mortgages will suffer from higher borrowing costs. On the other hand, other loan segments will benefit from robust economic activity. Ameris Bancorp operates in southeastern markets, with a concentration in Atlanta GA, and Jacksonville FL. Both Georgia and Florida currently have lower unemployment rates than the national average, which bodes well for loan growth.
Moreover, the consumer confidence index rose to 108.3 in December from 101.4 in November 2022, according to The Conference Board’s website. This is good news for not only consumer loans but also commercial loans as consumer spending and economic activity depend on consumer confidence.
Considering these factors, I’m expecting the loan portfolio to grow by 2.0% in the last quarter of 2022, leading to full-year loan growth of 21%. For 2023, I’m expecting the loan portfolio to grow by 8%. Compared to my last report on Ameris Bancorp, I haven’t changed my loan growth estimates. However, my loan balance estimates are higher than before because of the third quarter’s above-expected performance. The quarter’s exceptional growth has raised the base for the percentage.
Meanwhile, I’m expecting deposits to grow in line with loans. The following table shows my balance sheet estimates.
| Financial Position | FY18 | FY19 | FY20 | FY21 | FY22E | FY23E |
| Net Loans | 8,483 | 12,780 | 14,282 | 15,707 | 18,994 | 20,560 |
| Growth of Net Loans | 40.9% | 50.7% | 11.7% | 10.0% | 20.9% | 8.2% |
| Other Earning Assets | 1,836 | 3,503 | 4,093 | 5,731 | 2,820 | 2,877 |
| Deposits | 9,649 | 14,027 | 16,958 | 19,666 | 19,856 | 21,493 |
| Borrowings and Sub-Debt | 261 | 1,547 | 561 | 872 | 836 | 771 |
| Common equity | 1,456 | 2,470 | 2,647 | 2,966 | 3,168 | 3,460 |
| Book Value Per Share ($) | 33.7 | 42.1 | 38.1 | 42.5 | 45.7 | 49.9 |
| Tangible BVPS ($) | 20.7 | 24.7 | 23.7 | 26.2 | 29.3 | 33.6 |
| Source: SEC Filings, Earnings Releases, Author’s Estimates(In USD million unless otherwise specified) | ||||||
Deposit Mix Improvement to Enable Further Margin Expansion
After growing by 31 basis points in the second quarter, the margin grew by another 31 basis points in the third quarter of 2022. Most of the margin expansion was achieved by keeping deposit costs depressed. The deposit beta was only 10% in the quarter, as opposed to a normal beta of 23%, as mentioned in the conference call. The beta cannot remain depressed for much longer because of competition. Depositors might start moving their funds to other banks to get a higher return. Therefore, Ameris Bancorp will need to raise rates to retain depositors.
On the plus side, Ameris Bancorp continued to improve its deposit mix in the third quarter, which will benefit the deposit beta going forward. Non-interest-bearing deposits increased to 42.9% by the end of September from 42.0% at the end of June 2022 and 39.5% at the end of December 2021.
On the other side of the balance sheet, the assets are not highly rate-sensitive because variable-rate loans make up just 32% of total loans, as mentioned in the earnings presentation. The management’s interest-rate sensitivity model shows that a 200-basis points hike in interest rates could boost the net interest income by 5.7% over twelve months, as mentioned in the presentation.
Considering these factors, I’m expecting the margin to grow by 10 basis points in the last quarter of 2022 and another 10 basis points in 2023.
Expecting Earnings to Recover by 2.5% Next Year
The anticipated loan growth and margin expansion discussed above will drive earnings through the end of 2023. On the other hand, salary expenses will likely continue to surge because of high inflation as well as a tight labor market. The management mentioned in the conference call that many peer banks are actively recruiting new talent. The competition to retain talent will push up salary expenses.
Meanwhile, I’m expecting provisioning for expected loan losses to remain at a level slightly above the historical average due to the high-inflation environment and threats of a recession. I’m expecting the net provision expense to make up 0.25% of total loans in 2023, as opposed to an average of 0.16% from 2017 to 2019.
Overall, I’m expecting Ameris Bancorp to report earnings of $5.11 per share for 2022, down 5.5% year-over-year. For 2023, I’m expecting earnings to recover by 2.5% to $5.24 per share. The following table shows my income statement estimates.
| Income Statement | FY18 | FY19 | FY20 | FY21 | FY22E | FY23E |
| Net interest income | 343 | 505 | 638 | 655 | 799 | 937 |
| Provision for loan losses | 17 | 20 | 145 | (35) | 52 | 52 |
| Non-interest income | 118 | 198 | 447 | 366 | 299 | 254 |
| Non-interest expense | 294 | 472 | 599 | 560 | 579 | 662 |
| Net income – Common Sh. | 121 | 161 | 262 | 377 | 354 | 363 |
| EPS – Diluted ($) | 2.80 | 2.75 | 3.77 | 5.40 | 5.11 | 5.24 |
| Source: SEC Filings, Earnings Releases, Author’s Estimates(In USD million unless otherwise specified) | ||||||
In my last report on Ameris Bancorp, I estimated earnings of $5.00 per share for 2022 and $5.19 per share for 2023. I’ve increased my earnings estimates because of the third quarter’s above-expected loan growth.
My estimates are based on certain macroeconomic assumptions that may not come to fruition. Therefore, actual earnings can differ materially from my estimates.
High Price Upside Warrants a Buy Rating
Ameris Bancorp is offering a dividend yield of 1.27% at the current quarterly dividend rate of $0.15 per share. The earnings and dividend estimates suggest a payout ratio of 11.5% for 2023, which is close to the five-year average of 15.9%. Therefore, I’m not expecting an increase in the dividend level next year.
I’m using the historical price-to-tangible book (“P/TB”) and price-to-earnings (“P/E”) multiples to value Ameris Bancorp. The stock has traded at an average P/TB ratio of 1.57 in the past, as shown below.
| FY19 | FY20 | FY21 | Average | ||
| T. Book Value per Share ($) | 24.7 | 23.7 | 26.2 | ||
| Average Market Price ($) | 38.5 | 28.7 | 50.4 | ||
| Historical P/TB | 1.56x | 1.21x | 1.92x | 1.57x | |
| Source: Company Financials, Yahoo Finance, Author’s Estimates | |||||
Multiplying the average P/TB multiple with the forecast tangible book value per share of $33.6 gives a target price of $52.5 for the end of 2023. This price target implies an 11.4% upside from the December 22 closing price. The following table shows the sensitivity of the target price to the P/TB ratio.
| P/TB Multiple | 1.37x | 1.47x | 1.57x | 1.67x | 1.77x |
| TBVPS – Dec 2023 ($) | 33.6 | 33.6 | 33.6 | 33.6 | 33.6 |
| Target Price ($) | 45.8 | 49.2 | 52.5 | 55.9 | 59.2 |
| Market Price ($) | 47.1 | 47.1 | 47.1 | 47.1 | 47.1 |
| Upside/(Downside) | (2.8)% | 4.3% | 11.4% | 18.5% | 25.7% |
| Source: Author’s Estimates |
The stock has traded at an average P/E ratio of around 10.3x in the past, as shown below.
| FY19 | FY20 | FY21 | Average | ||
| Earnings per Share ($) | 2.75 | 3.77 | 5.40 | ||
| Average Market Price ($) | 38.5 | 28.7 | 50.4 | ||
| Historical P/E | 14.0x | 7.6x | 9.3x | 10.3x | |
| Source: Company Financials, Yahoo Finance, Author’s Estimates | |||||
Multiplying the average P/E multiple with the forecast earnings per share of $5.24 gives a target price of $54.0 for the end of 2023. This price target implies a 14.5% upside from the December 22 closing price. The following table shows the sensitivity of the target price to the P/E ratio.
| P/E Multiple | 8.3x | 9.3x | 10.3x | 11.3x | 12.3x |
| EPS 2023 ($) | 5.24 | 5.24 | 5.24 | 5.24 | 5.24 |
| Target Price ($) | 43.5 | 48.7 | 54.0 | 59.2 | 64.5 |
| Market Price ($) | 47.1 | 47.1 | 47.1 | 47.1 | 47.1 |
| Upside/(Downside) | (7.7)% | 3.4% | 14.5% | 25.6% | 36.8% |
| Source: Author’s Estimates |
Equally weighting the target prices from the two valuation methods gives a combined target price of $53.2, which implies a 13.0% upside from the current market price. Adding the forward dividend yield gives a total expected return of 14.3%. Hence, I’m maintaining a buy rating on Ameris Bancorp.
Be the first to comment