

baona/iStock via Getty Images
Thesis: Q3 recap and Q4 outlook
Advanced Micro Devices, Inc. (NASDAQ:AMD) just reported its Q3 results. Both the top line and bottom-line missed the preliminary guidance provided in early Oct. To wit, AMD reported an EPS of $0.67 in Q3 and total revenue of $5.57B. Compared to the preliminary guidance it provided on October 7 ($0.70 EPS and $5.6B sales), its EPS missed by 3 cents (or 4.3%), and its revenues missed by about $30M (less than 1%). The above miss was largely due to the weakness in the PC sector. Its sales of PC products fell by 40% YOY to $1B only.
Looking forward, I anticipate the global PC demands to remain softened due to several factors. First, as argued in my earlier article, manufacturers such as AMD have built a large inventory during global supply chain congestions in anticipation of supply shortages. And such hoarding will take some time to clear. Second, the boost in demand unexpectedly catalyzed by the COVID pandemic has come to an end. The pandemic created a surge in PC-related products due to people’s sudden need for remote work. And now with the COVID boost over, demand has renormalized as PC volumes were largely driven by commercial refreshes as analyzed in this IDC report.
As such, for Q4 of 2022, AMD expects revenue to be ~$5.5 billion, representing about 14% growth YoY and flat sequentially. To put things into perspective, AMD’s quarterly revenue growth has been above 40% YoY and reached as high as almost 90% in the past few quarters since 2020. These headwinds are causing negative sentiment, as shown in the consensus estimates in the chart below. As seen, out of 33 analysts who provided estimates for AMD, 32 provided down revisions and only 1 provided an up revision in the last 3 months.
When the overall sentiment is negative, it is usually a good time to take a step back and take a long view. And indeed, the remainder of this article will argue that the near-term risks have been fully priced in already, and the stock now provides a very attractive return profile in the next 5 years from a combination of valuation expansion, organic growth, and potential share repurchases too.
Source: Seeking Alpha data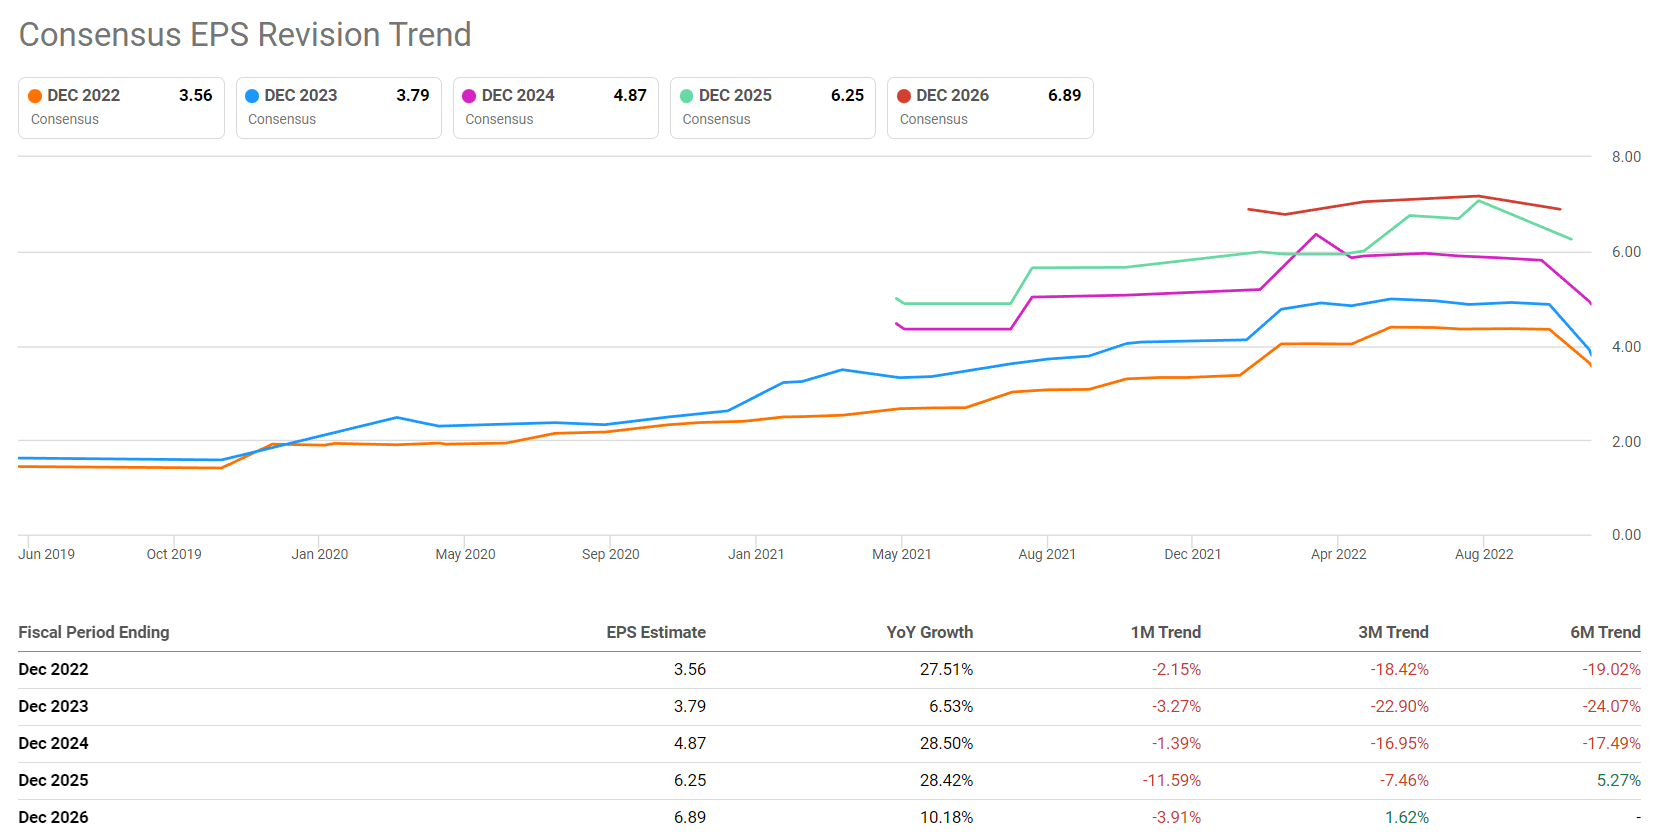
AMD’s historical return drivers
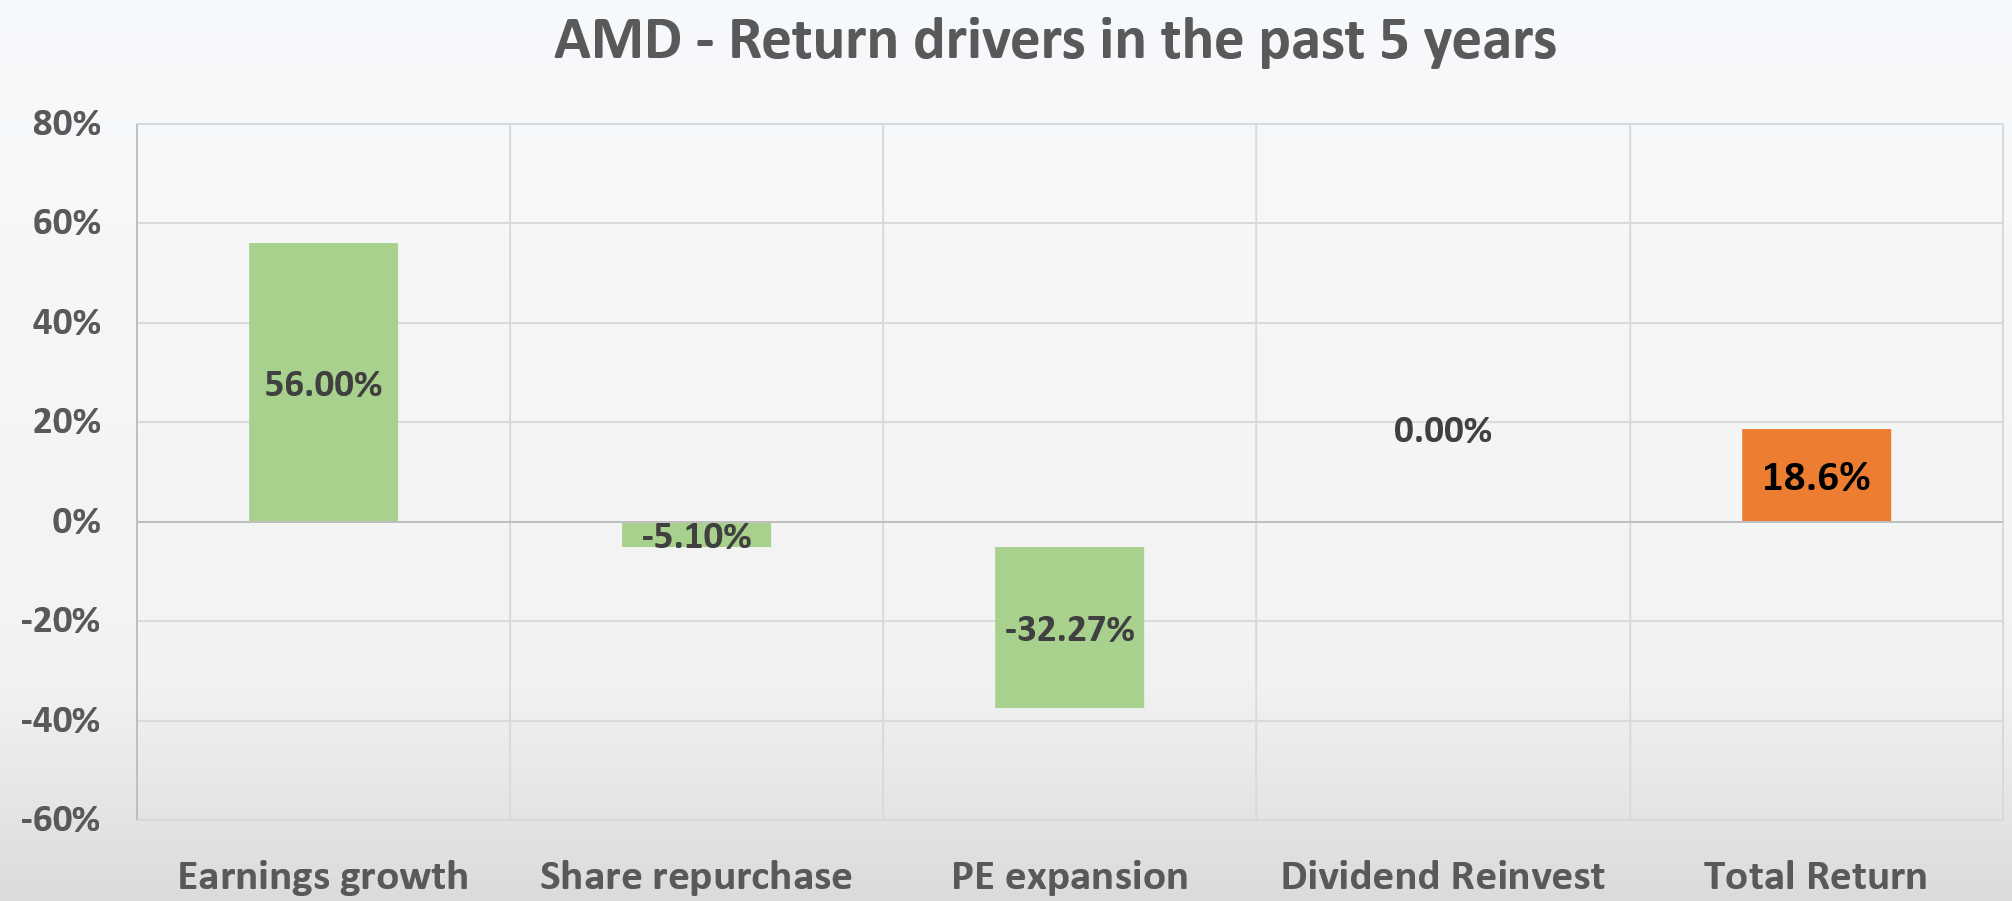
AMD investors have enjoyed a fabulous ride in the past till 2022. As seen in the chart below, the decline since 2022 erased more than half of the gain that AMD had accumulated since 2018. Still, even after such a nosedive, AMD managed to deliver a terrific total return of 452% since 2018, translating into an annual return of 18.6%. In contrast, the overall market gained a total of 62.8% in the same period, completely dwarfed by AMD.
Source: Seeking Alpha data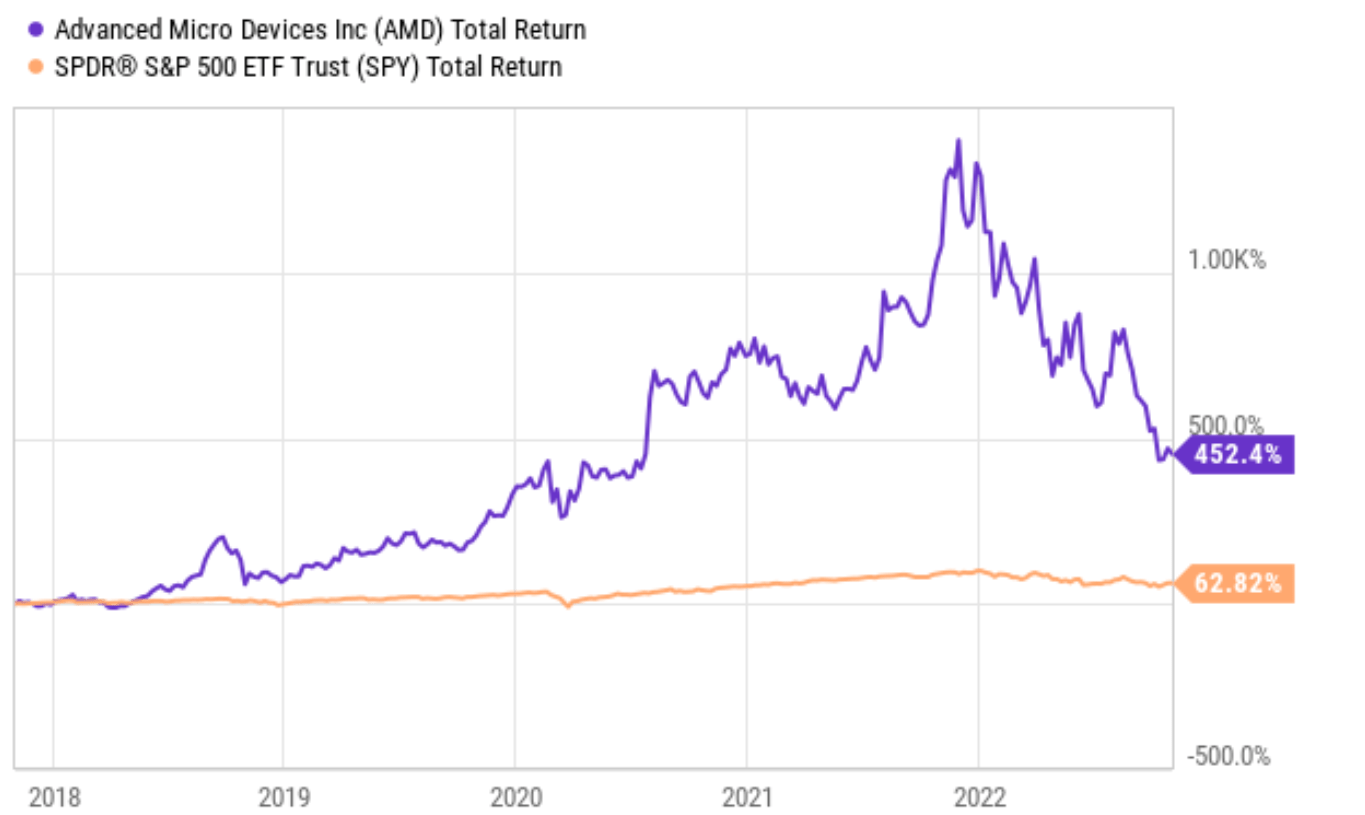
The fundamental engine driving AMD’s past returns is, of course, growth. Over the past 5 years, AMD was able to grow its earnings at a neck-breaking rate of 56% CAGR, from $337M to $3.13B, as seen in the chart below.
Then, looking a bit closer, a few other factors canceled off some of the earnings growth. First, share dilution. As seen in the bottom portion of the following chart below over the past five years, AMD’s outstanding share count climbed from 952M shares to 1.229 billion shares, an annual dilution rate of 5.1% CAGR. As a result, its EPS growth rate was about 50.1% (56% total profit growth rate minus 5.1% share dilution). Then valuation multiple changes canceled the bulk of the growth by a 32.27% contraction. The stock turned from a hypergrowth stock in 2018, when people were willing to pay any price to get their hands on it (with a P/E of more than 300x back then), to a stock that people are fearful to hold even at FW P/E of ~16x.
Now looking forward, the logical question is: would these return drivers remain the same in the next 5 years, or would they change?
And my short answer is no. And you will see that even though I still think AMD can outperform the overall market by a significant margin, my view is that the outperformance will be caused by a different combination of return drivers.
Source: Author based on Seeking Alpha data Source: Author based on Seeking Alpha data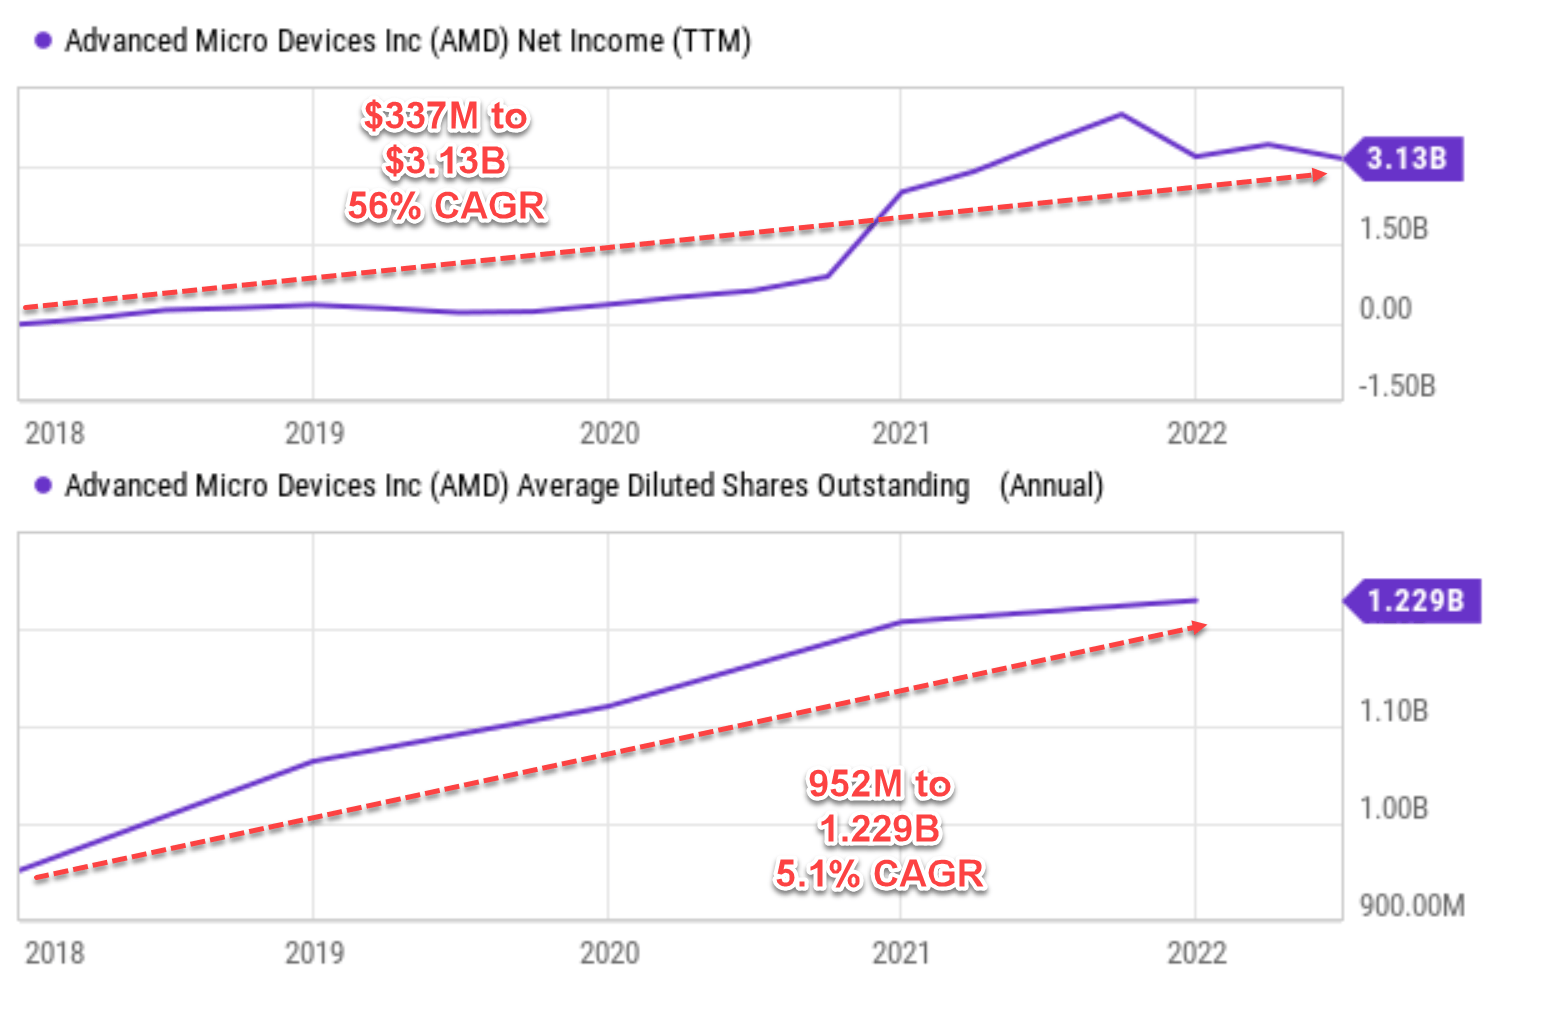
AMD: How would its valuation change in the next 5 years?
In short, I anticipate its P/E multiple to reverse course and expand. The following charts show its P/E multiple over the past 5 years in comparison to its close peer Nvidia (NVDA) and also the overall semiconductor sector represented by the VanEck Semiconductor ETF (SMH).
As seen from the top panel, the current P/E for AMD is only 25.6x. It is not only far below its historical average, but it is also near its bottom level (23.5x observed very recently) and well below NVDA’s 45.3x P/E. In terms of FW P/E, it’s even lower at only 16.79x. And it is at an even large discount from NVDA (somewhere between ½ and 1/3 of NVDA’s 41.1x FW P/E). It is even below the PE of the sector average as represented by the SMH fund (17.04x based on Yahoo Finance data), even though AMD is far superior to the sector average in almost every aspect (growth potential, technical lead, financial strength, et al.) the way I see things.
Source: Author based on Seeking Alpha data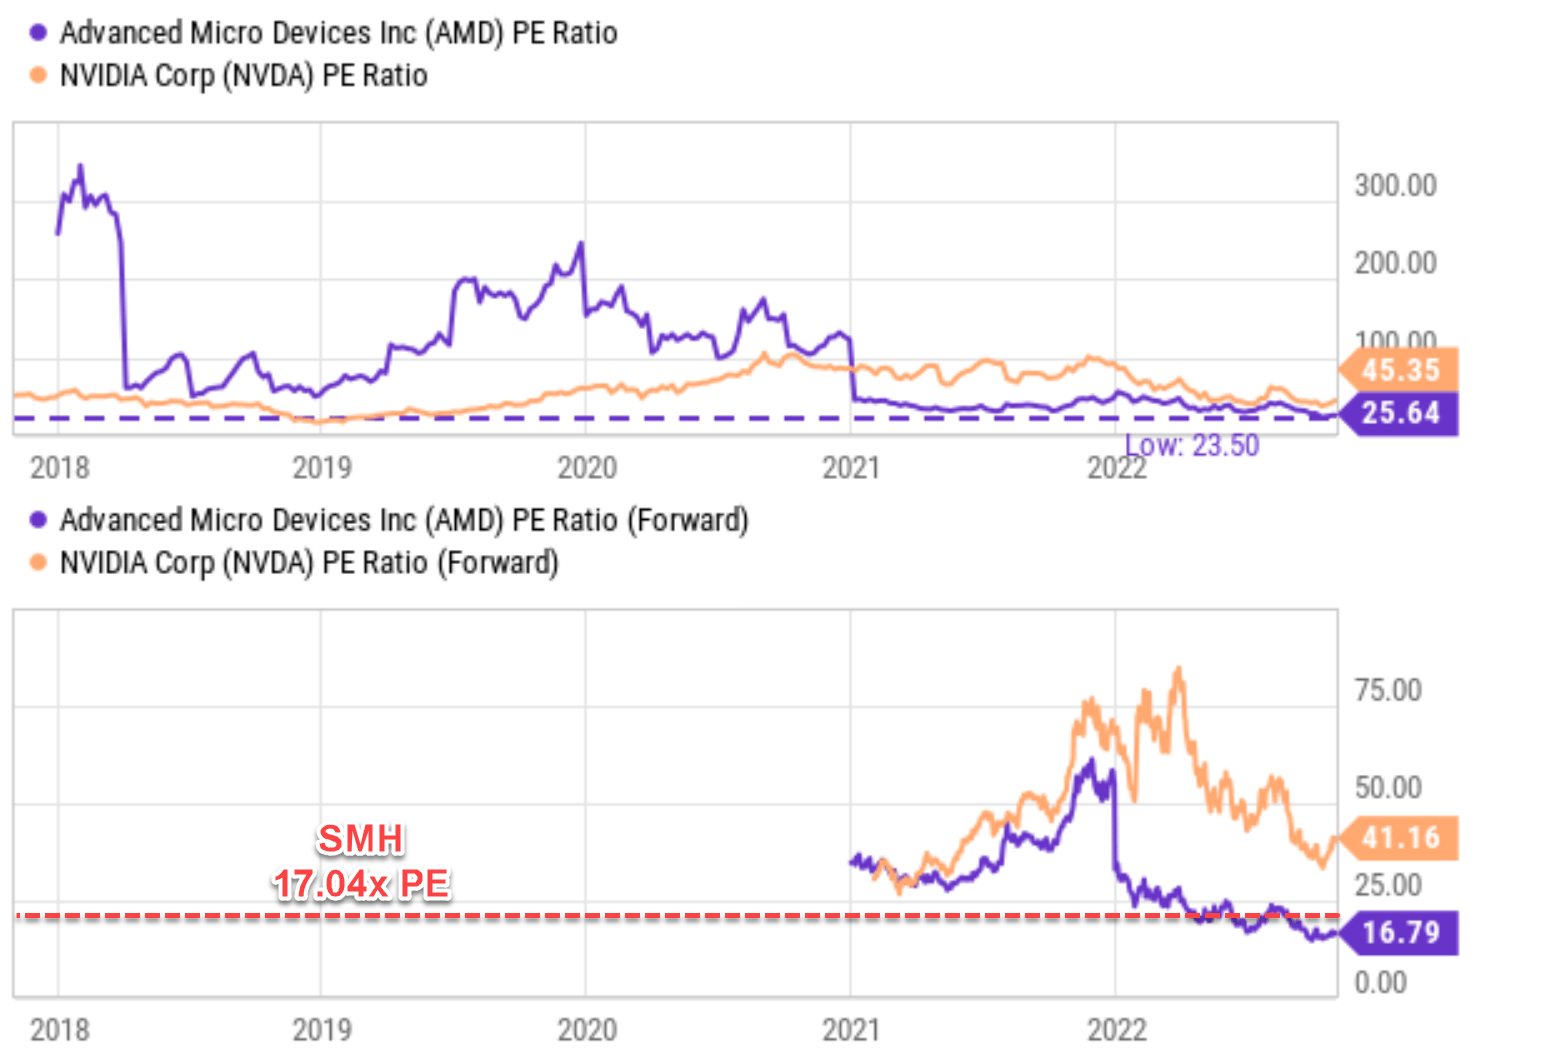
Would the EPS growth continue?
My answer is a definitive YES. Consensus estimates project a 14.1% CAGR for its EPS growth in the next 5 years, as you can see from the chart below. The projected EPS would reach $6.89 in 2026. Next, you will see that my estimate, made from a completely independent approach, is about 10.8% CAGR. It is a bit more conservative than the consensus estimates. But, at its current valuation, you will see a ~10% growth rate is more than enough to drive a market-beating return.
Source: Author based on Seeking Alpha data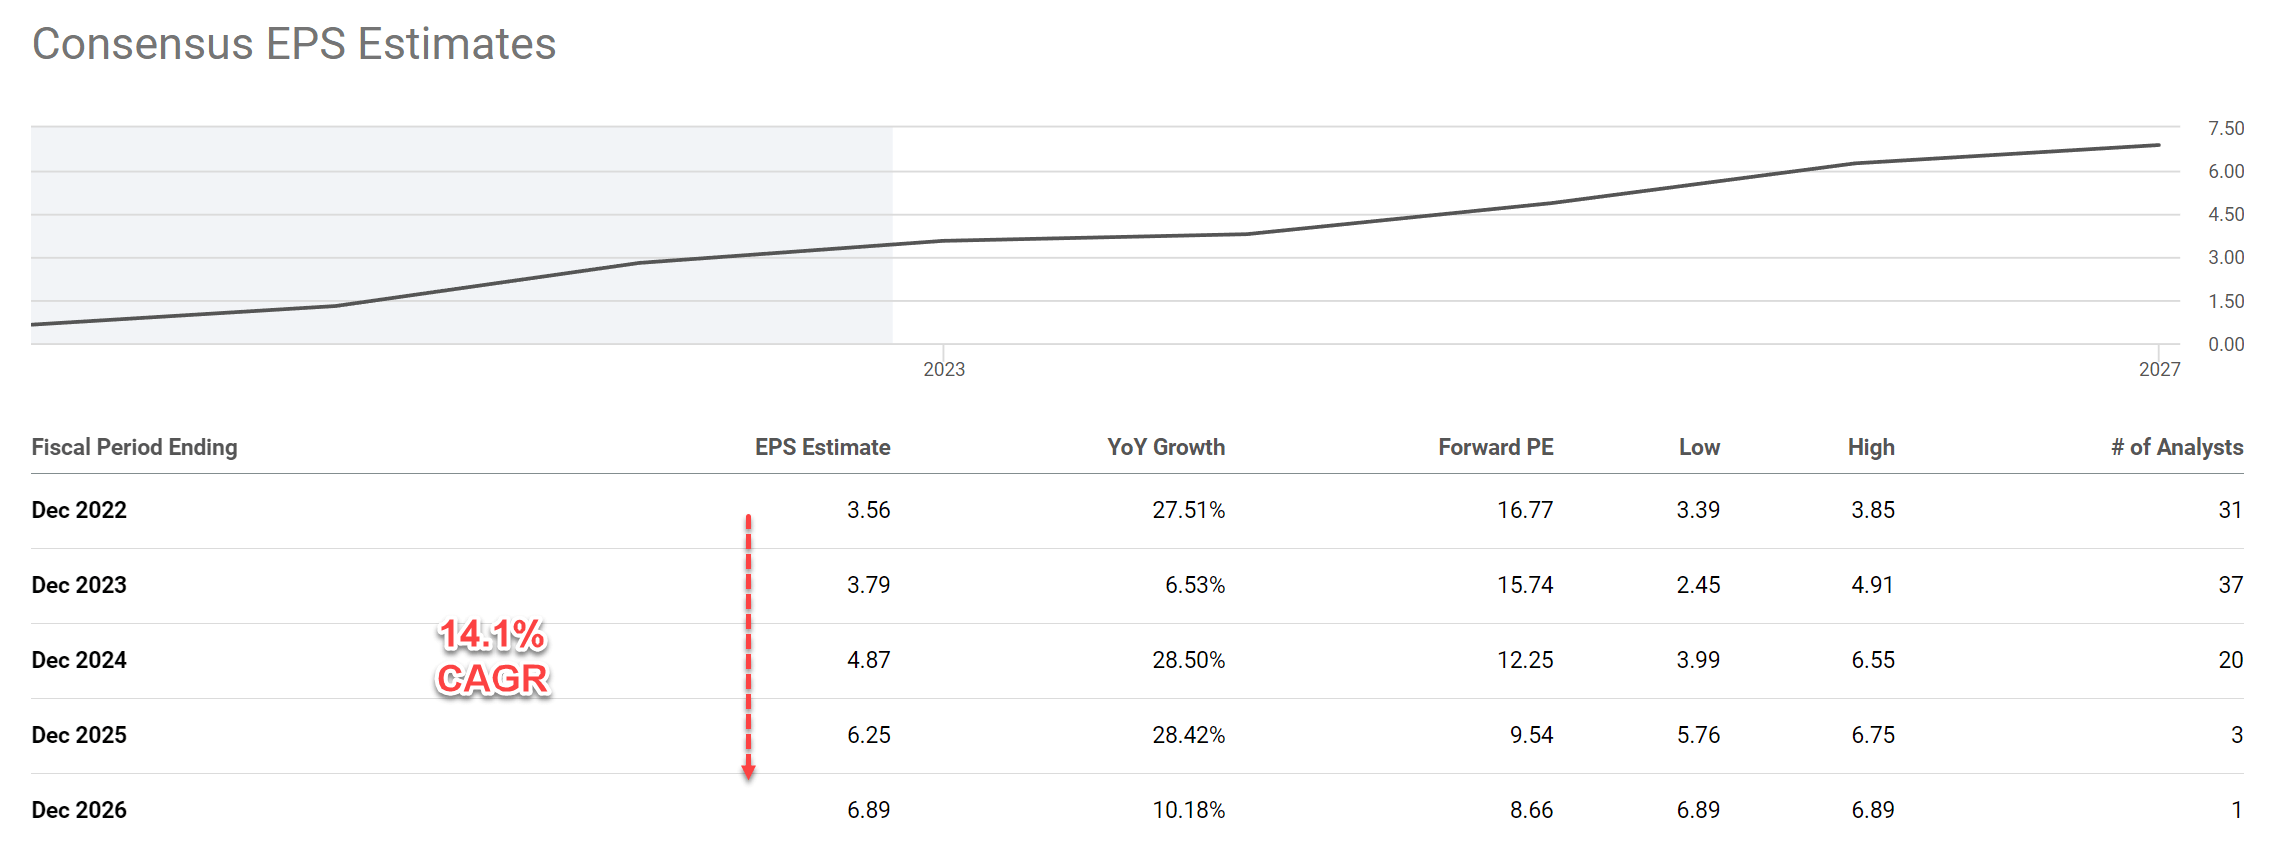
As detailed in my other articles:
For a time frame sufficiently long (like 5 years or above), I use the following framework to estimate the growth rate:
Long-Term Growth Rate = ROCE * Reinvestment Rate
ROCE stands for the return on capital employed. The method for analyzing ROCE has been detailed in my early article and I will just directly quote the results in the chart below.
AMD was able to maintain a ROCE on average of about 45% currently. The chart also shows the ROCE of other stocks in the FAAMG group to provide a reference. As seen, AMD’s current 45% ROCE (which I think is a base case) compares favorably against this group. Furthermore, I think there is a good chance for its ROCE to further expand into the 71% range given the catalysts analyzed in my earlier articles. To recap, these catalysts include its new chip Zen4 to strengthen its product lineup, the integration of Xilinx to unlock new addressable markets, and also secular support from the CHIPS act.
Source: Author based on Seeking Alpha data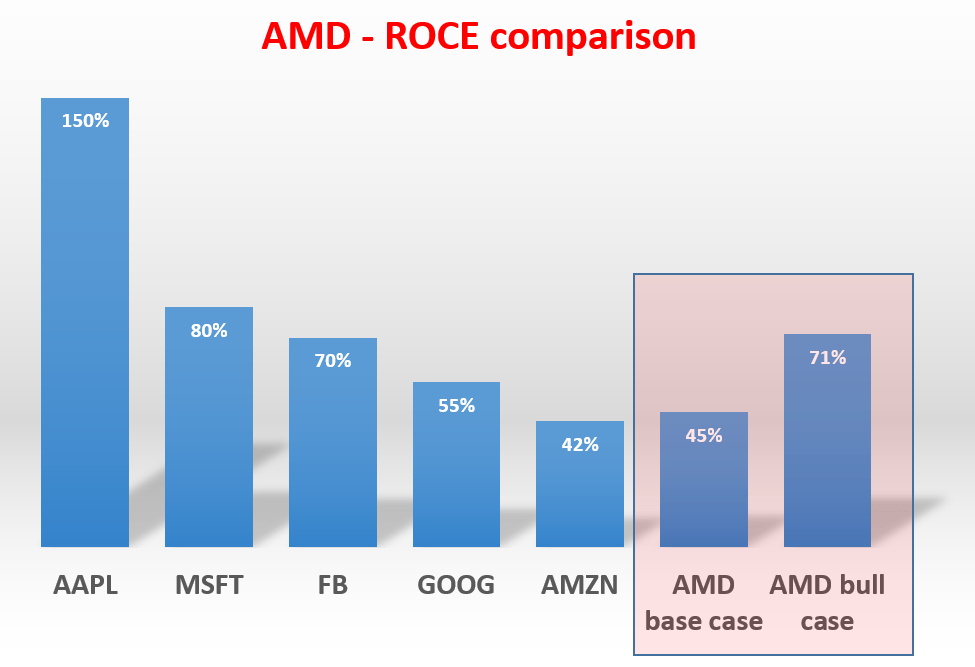
As to the reinvestment rate (“RR”), the company has been maintaining a RR of about 10% in recent years. And thanks to the help from the CHIPS act, I anticipate its RR to effectively expand to the 15% range due to tax credits on R&D expenses and the consideration that many of its R&D needs will be met by national labs and universities sponsored by the CHIPS act going forward.
The next chart shows the long-term growth rate at different combinations of ROCE and RR. To wit, I expect long-term growth rates in the upper single-digit to double-digit range (in the range from ~7.5% to ~10.8%). Note that I added a 2.5% inflation escalation factor in these estimates.
Source: Author based on Seeking Alpha data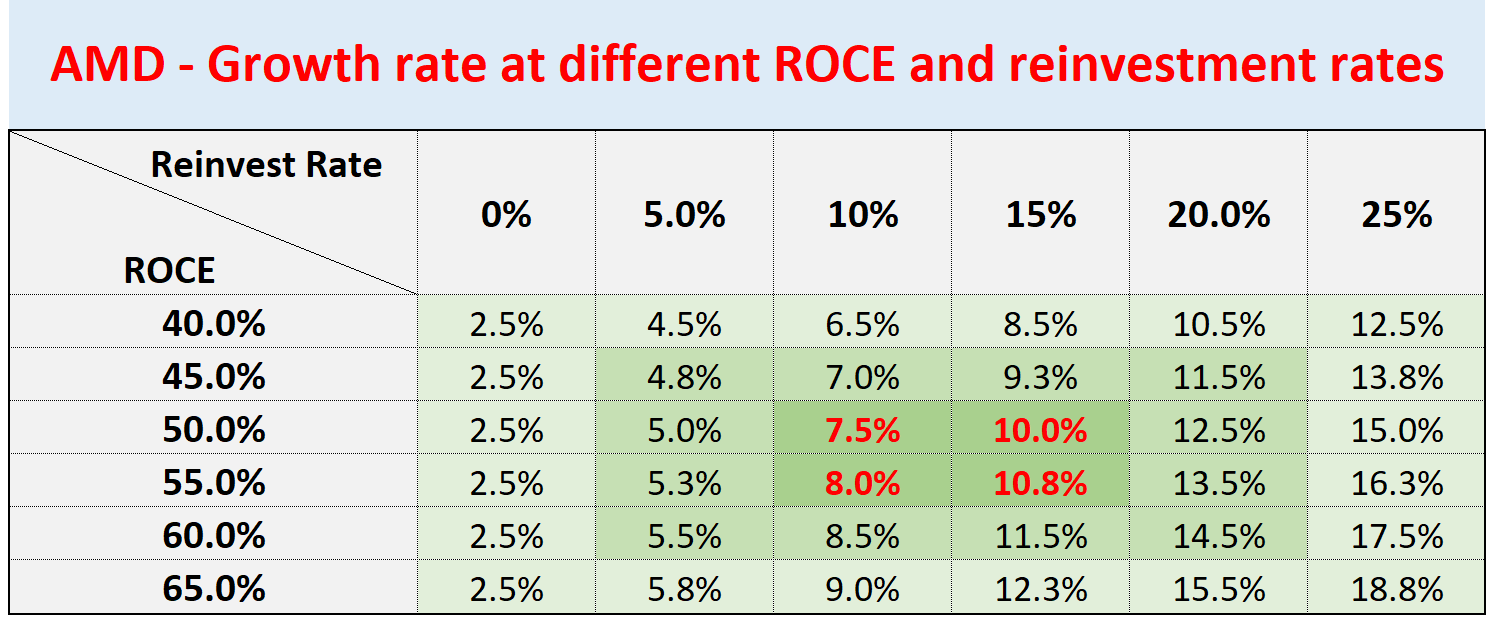
AMD’s return potential for the next 5 years
As aforementioned, my above independent estimate projects an upper bound of 10.8% CAGR, lower than the consensus estimates of 14.1%. But as you can see from the next chart, at its current valuation, a 10.8% growth rate is enough to drive an expected return of 14.4%. A few key observations:
- This estimate assumes a 10.8% growth in total profit as obtained from the previous section. In this estimate, I assumed no net change in its share counts in the next few years (i.e., no significant share repurchases or dilution). Thus, the growth in EPS would be the same 10.8% as the total profit growth.
- A P/E change to 20x. As argued earlier, I do not anticipate its P/E to further contract from or sit at 16.8x. I anticipate an expansion to about 20x, which would contribute about 3.60% of annual ROI. To put things under perspective, the average P/E of SMH over recent years has been above 20x and the overall tech sector represented by QQQ is now trading at 22x P/E. Considering the many catalysts mentioned above for AMD and its leading position, I think a terminal 20x P/E is on the conservative side.
Source: Author based on Seeking Alpha data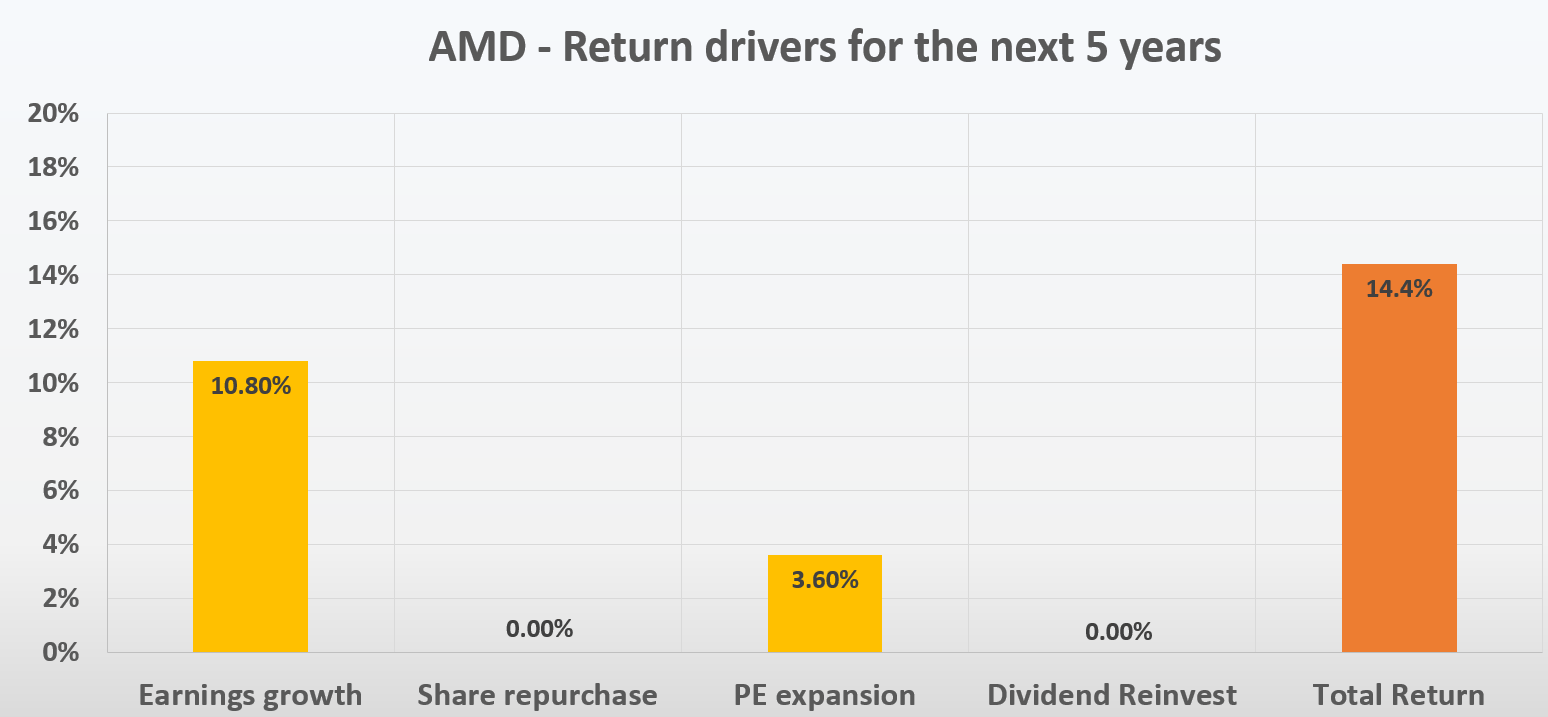
Risks and final thoughts
AMD certainly faces many risks in the near term. And its Q3 earnings report has reiterated these risks clearly. More specifically, I anticipate the global PC demands to remain softened in the near future. Manufacturers such as AMD will take time (plus the possibility of price discounts) to clear their existing inventory. At the same time, the boost in PC demand unexpectedly caused by the COVID pandemic has come to an end and the demand has renormalized. These factors have caused the overall sentiment to be extremely negative, as reflected in the consensus estimates and also its valuation of 16.7x FW P/E. Such a level is nearly the bottom in its entire history and also cheap compared to its peers and the overall semiconductor sector.
To conclude, when the overall sentiment is so negative, it is usually a good time to take a long view and look past the immediate issues. And what I see for the next 5 years is a rosy return profile. The stock is poised to deliver ~14% annual ROI even under conservative assumptions about profit growth and P/E expansion. Finally, my projections assumed its share counts to remain constant, which is also on the conservative side. In its Q3 earnings report, AMD reported that in August, it repurchased $617M worth of its own stocks. And looking out, it has $6.8 billion remaining in its current repurchase plan. Such repurchases are admittedly relatively small when compared to its market cap (around $100B as of this writing), but they nonetheless provide a further boost to long-term return, especially when made under the currently very compressed valuations.
Be the first to comment