

Jlende/iStock Editorial via Getty Images
Thesis
Amazon (NASDAQ:AMZN) has become a frequent Q&A topic among our readers and members of our marketplace service. In this article, I want to consolidate my responses and thoughts more cohesively. And I will do so by focusing on a macroscopic level, an approach motivated by two reasons.
First, AMZN is such a diversified company with so many complicated parts (retailer, AWS, hardware, et al). Each part merits an in-depth article and plenty of articles (including some of my own articles) have been written on the parts. So it makes sense to write an article at a macroscopic level with the hope of gaining a panoramic view at the cost of losing some of the details. This article will also complement the other pieces that other SA authors wrote about its segments.
Second, taking a macroscopic approach also helps to elucidate the core strategy and foundational concepts we use in our research and marketplace. So that you might be able to extend the methodology to other stocks of interest to yourself beyond AMZN. In particular, we will use the Fama French method in this article to analyze AMZN.
Under this context, the main conclusions of this article are twofold:
- Its profitability is less competitive than other peers. And I see inflation and supply chain pressures keep challenging its operating environment in the second half of 2022. In particular, the cost of fuel should lead operating expenses to increase during the remainder of the year. At the same time, the picture for overseas container costs remains mixed.
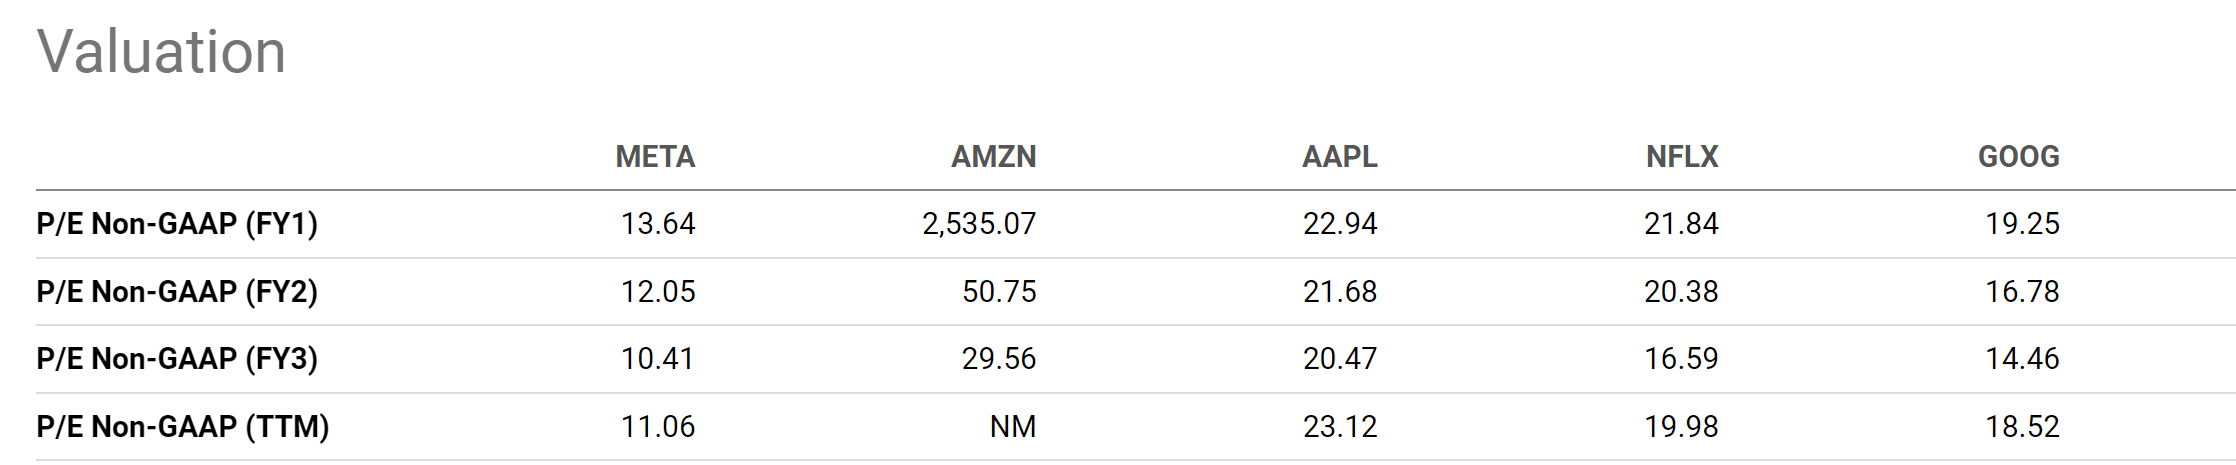
- While at the same time, its valuation is still quite expensive, both in absolute terms and relative terms. Due to its current negative cash flow and negligible accounting EPS, valuation metrics in terms of bottom lines are not meaningful for AMZN. Its GAAP FW P/E is quoted at about 2531x. Even looking 2 years out, at its current price, its FY2 P/E of 50.75x is still too high when compared to the FAAMG group – which also has far better profitability metrics than AMZN.
All told, I see a $90 stock price possible in the near future for AMZN given its historical volatility and its current elevated P/E. And that level, it would be much more reasonably valued and would be worthy of another close look.
Shipping situation remains mixed
AMZN faces a multitude of headwinds, ranging from high fuel cost, inflation, foreign exchange rates, et al. And all have been detailed in other SA articles. Here I will focus on one aspect not often mentioned: the mixed outlook of shipping costs.
On the positive side, the overseas shipping cost has gone down dramatically since its peak reached around September and October 2021 as you can see from the following chart (based on Drewry’s data). The shipping container costs peaked above $10k during that time. It has been continuously declining since then. The Drewry’s composite World Container Index decreased by 8% alone last week to the current $3,688. Compare to its peak level about 1 year ago, the current price is almost 1/3 of the peak price. To further corroborate the picture, the second chart below shows the trade routes from Shanghai to other key port cities in the world (also based on Drewry’s data). As seen, the costs have also been declining, almost continuously, since 2021 September too. Take the trade routes between Shanghai and New York as an example. The costs have declined by almost ½ from around $15k a year ago to the current level of about $7k.
However, on the negative side, the impacts of China’s COVID lockdown may still take time to clear up, and new lockdowns are very possible given the recent resurgence in key Chinese cities. At the same time, gasoline prices remain near a historical high. According to YCharts data shown below, the national average price per gallon of unleaded gasoline is $3.91. It is about 23% below the peak of $5.1 reached recently, but still among the highest level since 1995 as seen.
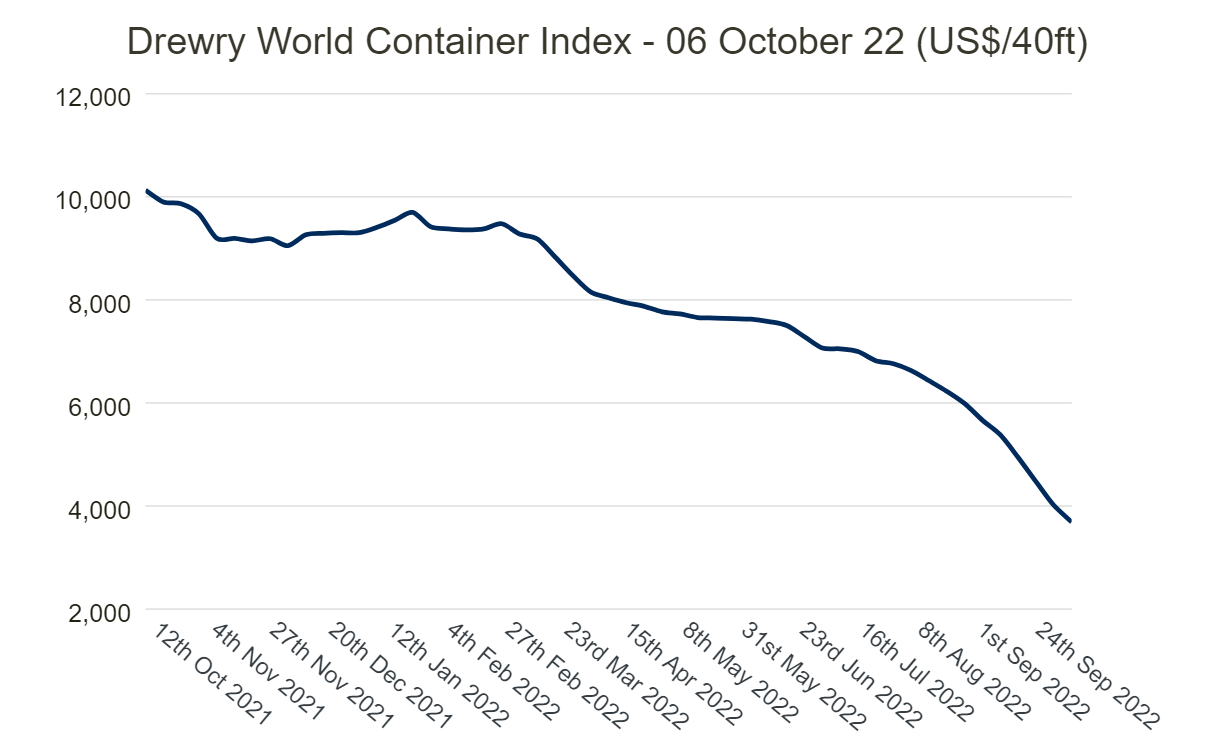
Source: Drewry’s data
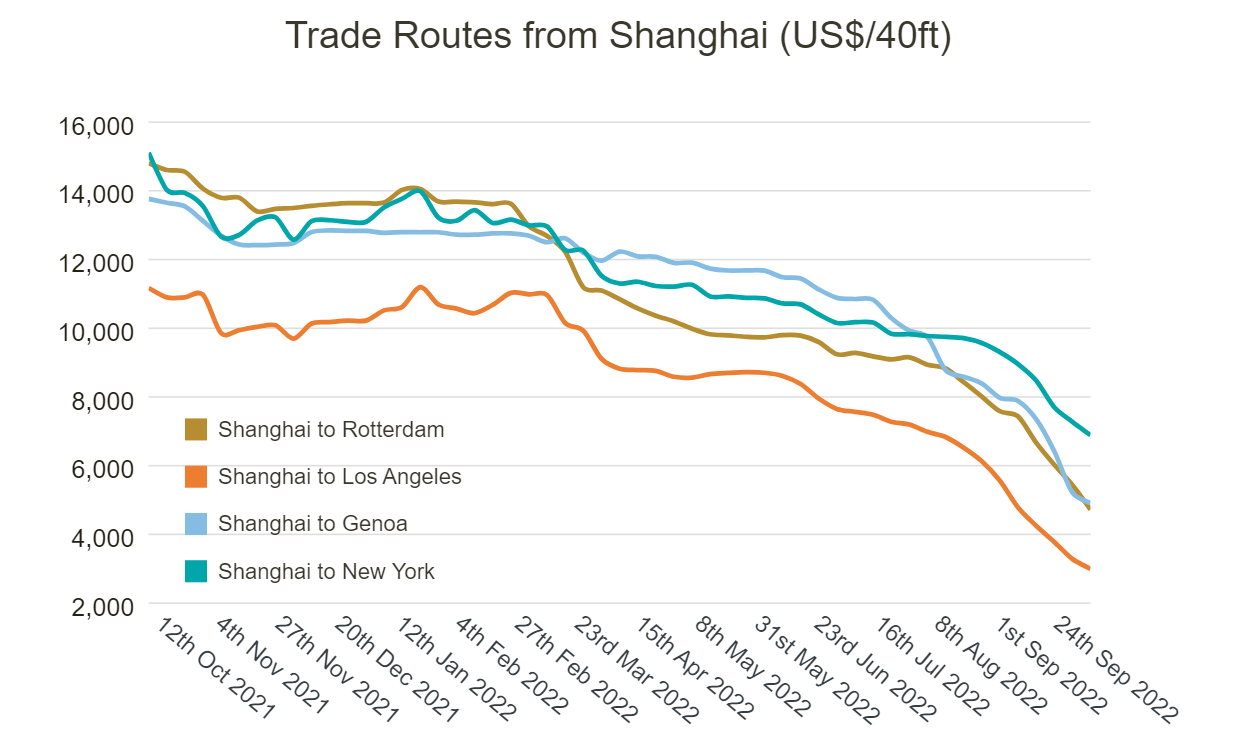
Source: Drewry’s data

Source: Seeking Alpha data
AMZN profitability examined by Fama French
The factors above will keep their pressure on AMZN’s margins and profitability, which is not that impressive to start with as shown by a Fama French analysis below. The background of the Fama French has been provided in our earlier article. A brief recap is provided here for ease of reference (especially for readers who do not have access to our past articles).
The method is named after Eugene Fama and Ken French. In 2013, Eugene Fama shared the Nobel Prize in economics with Lars Peter Hansen and Robert Shiller for their work on asset prices. The Fama French method is considered a significant improvement over the CAPM method because it adjusted for outperformance tendency.
The raw data used in this article were pulled from the Dartmouth Tuck Business School database. We then analyzed the raw data using a simplified version of the Fama French method.
The following two charts show two of AMZN’s factors (operation profitability and valuation) compared to the general market. Past results have shown that these two factors have truly held up over all time periods.
- The OP factor (Operating Profitability). The operating profitability factor in period t is defined as the operating income divided by the sum of book equity and minority interest for the last fiscal year ending in time period t-1.
- The P/E factor (the Price/Earnings ratio). The P/E factor is based on total earnings before extraordinary items, from Compustat.
AMZN’s scores on these two factors are shown below. The first chart shows the OP factor of AMZN compared against all the other stocks in the market by percentile. As you can see, AMZN is not highly profitable by the OP metric (not a horrible one either). Its OP has oscillated the top 25% and the market median most of the time in recent years. Its current OP is 17.9%, actually slightly below the market median OP of 19.5%.
Another metric that we always like to check is the return on capital employed (“ROCE”), just in case for some businesses, the capital employed deviates from their equity substantially. And as seen, in AMZN’s case, there is a noticeable difference. Its ROCE (the thicker cyan line) has been consistently better than its OP, suggesting that its equity overrepresents its capital actually employed. But currently, its ROCE hovers around 16.4%, also below the market median as seen.
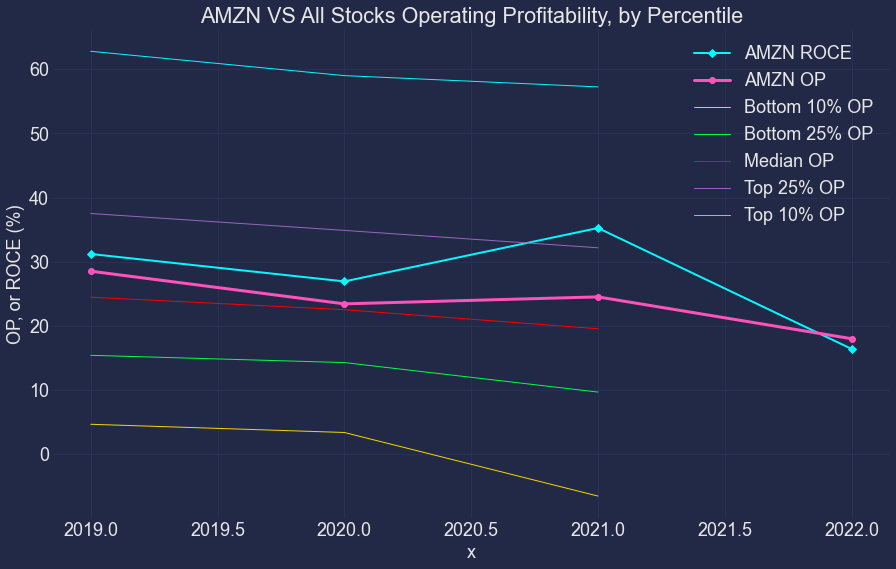
Source: Author
AMZN valuation examined by Fama French
Now move on to the valuation factor. As aforementioned, due to its current negative cash flow and negligible accounting EPS, valuation metrics in terms of bottom lines are not meaningful for AMZN (FY1 GAAP P/E is 2531x). Even its FY2 P/E of 50.75x is still too high when compared to the FAAMG group: more than 4x higher than META, 3x higher than GOOG, and 2x higher than AAPL and NFLX.
Source: Seeking alpha data
The next chart shows AMZN’s P/E factor is also much higher than the overall market. Again, here you need to ignore the large gyrations because of the large fluctuations in its accounting EPS over the years. However, currently, its 50+ FY2 P/E would make it among the most expensively valued stocks on the market.
To provide some reference points, the top 5% percentile P/E in the market is currently 117x, and the top 10% percentile is 69.9x. So regardless of which P/E you want to pick for AMZN, its current valuation is near the top 5% or the 10% percentile, a stark contrast to its below-average profitability.

Source: Author
Risks and final thoughts
To recap, despite large price corrections, I still see a mixed picture for AMZN under its current conditions. AMZN faces a multitude of headwinds, including shipping cost, inflation, foreign exchange rates, et al. I anticipate these headwinds to keep their pressure on its profitability, which is not super-competitive to start with. Its profitability, either measured by OP or ROCE, has oscillated between the top 25% and the market median most of the time. And they are currently slightly below the market median.
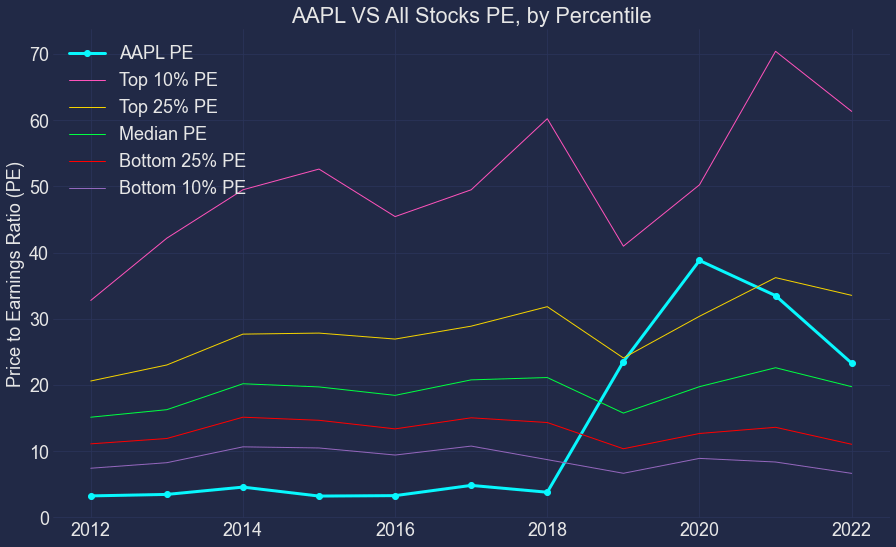
As such, under current conditions, we see better alternatives even within the FAAMG group. For example, the following two charts show the OP and P/E scores for Apple (AAPL). You can see the picture is completely the opposite when compared to AMZN. AAPL’s profitability, either measured by OP or ROCE, is far superior to the overall market as shown in the first chart. Yet, its valuation is only slightly above the market median.
All told, I see a $90 stock price possible for AMZN in the near future given its historical volatility and its current elevated P/E. A $90 stock price would translate into a 40x P/E based on its FY2 EPS forecast. Still not cheap by any standard. But it is more reasonable and close to the top 25% percentile of the overall market. And a $90 level, it would be worthy of another close look given its growth potential (driven by its eCommerce, AWS, and healthcare initiatives for example).

Source: Author
Source: Author
Be the first to comment