

Klaus Vedfelt/DigitalVision via Getty Images
Thesis and Background
A frequent question we receive these days in our marketplace service is “how to fight the Fed”. We totally understand the question is metaphorical and the word “fight” can have different interpretations for different investors (ranging from hedging the Fed’s next move to outsmarting its next move). And we also fully appreciate the urgency of the question given the recent turmoil – both in the equity and bond markets – caused by the surprise caused by the latest inflation data and Fed’s latest dot-map.
However, we feel quite presumptuous for us to even attempt offering suggestions on “fighting” the Fed – regardless of what you mean by “fighting” – for several reasons. First, what ordinary individual investors can do in the face of macroeconomic or geopolitical forces are truly limited. When inflation is high and rates are rising, all asset classes suffer (bonds, equity, gold, and even cash). There is simply no place to hide, let alone fight. And second, trying to predict (let alone outsmart) Fed’s next move seems a non-starter to us. To a good degree, the Fed itself probably does not know what its next move will be. The economy has become so intricately connected and the Fed itself has to follow a wait-and-see or even trial-and-error approach.
Therefore, our suggested approach is much less ambitious. Instead of fighting, we are content to just stay out of Fed’s way. And here, we will recommend two stocks, Altria (NYSE:MO) and British American Tobacco (NYSE:BTI), to help you just do that. Admittedly, both stocks are facing uncertainties ahead, and we will elaborate on that in the final section. But over a long period of time (say 20 years, the timeframe investment cycle for a retirement account), both stocks have demonstrated remarkable resilience as you can see from the following chart.
Seeking Alpha Data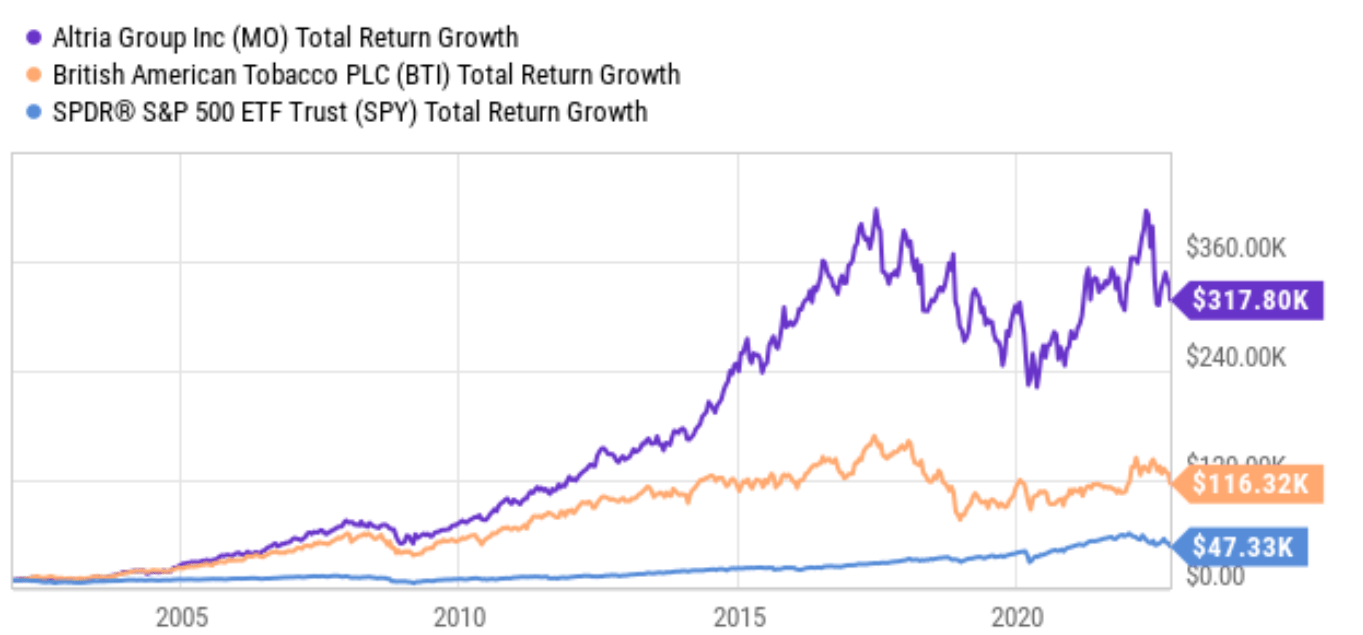
To wit, this chart shows the total return of both stocks compared to the SP500 index over the past 20 years since 2002. And remind you, the market has gone through a lot over the past 20 years: the bursting of the dot.com bubble, the Great Recession, COVID, multiple wars, et al. Yet, both stocks came out not only ok but outperforming the SP500 by a wide margin. Specifically, SPY delivered a solid total return of 473%, translating into a return of 8.08% per year when annualized. In contrast, MO delivered a total return of 3178%, translating into a return of 18.8% per year when annualized. And BTI delivered 1163%, translating into a return of 13.0% per year when annualized.
In the remainder of the article, you will see why I anticipate such past performance and outperformance to continue in the future also. In my view, the economics of both stocks are still the same today as they were 20 years ago: superb profitability, extremely low capital requirements, and shareholder-friendly management. Furthermore, at this point, both stocks are paying dividend yields far above their historical average as seen in the chart below. Such generous yield provides immediate support for the investment. As detailed later, about ½ of the total return potential is supported by the dividends alone. Such peak yields also indicate a wide margin of safety at this point.
Seeking Alpha Data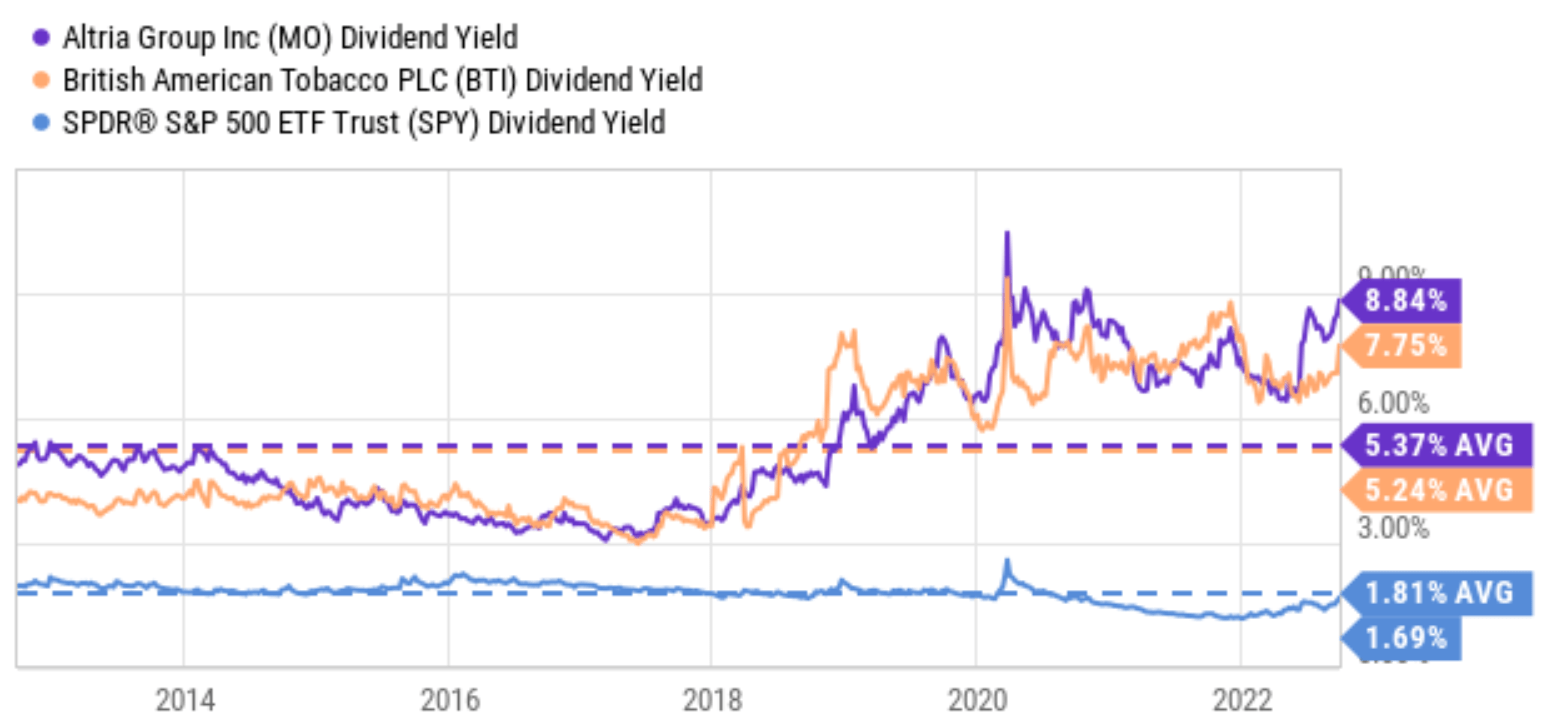
Profitability and Moat
In the long run, the only way to fight inflation (or the Fed if that is what you mean by “fighting the Fed”) is profitability which is both above-average and sustainable. And both MO and BIT are poster boys for both traits. The key to their superb and stable profitability probably is best summarized by the quote from Warren Buffett below:
“I’ll tell you why I like the cigarette business. It costs a penny to make. Sell it for a dollar. It’s addictive. And there’s fantastic brand loyalty.”
What Buffett said is still true today. Comparing profitability is ultimately subjective but the picture is quite clear here overall in my mind. To cite a few key metrics, MO enjoys a gross margin of 67%, and BTI even higher, 82%. To put things under perspective, the following table also shows the gross profit margin of Apple (AAPL) and AbbVie (ABBV). The goal is not to compare apples against oranges here. I am picking AAPL here because it is often cited as the most profitable company and the textbook example of premium pricing. Similarly, ABBV is a representative example of the pharmaceutical sector, another sector famous (or notorious) for its pricing power and high margins. As seen, MO’s gross margin is more than 1.55x higher than AAPL’s 43% and is on par with ABBV. BTI’s gross margin is almost 2x higher than AAPL’s 43% and about 12% higher than ABBV.
In terms of bottom line metrics, the tobacco sector’s margin is also equally impressive. MO enjoys an average net margin of around 20% in recent years (the current 8.45% shown below is an outlier data point) and BTI about 20.5%. These levels are again competitive even when compared to the most profitable stocks like AAPL (25.7% net margin) and ABBV (22% net margin). To broaden the comparison a bit more, the average profit margin for the overall economy fluctuates around 8% and rarely goes above 10%.
In addition to this snapshot of various metrics, next, we will examine a more fundamental profitability measure over a longer period of time.
Seeking Alpha Data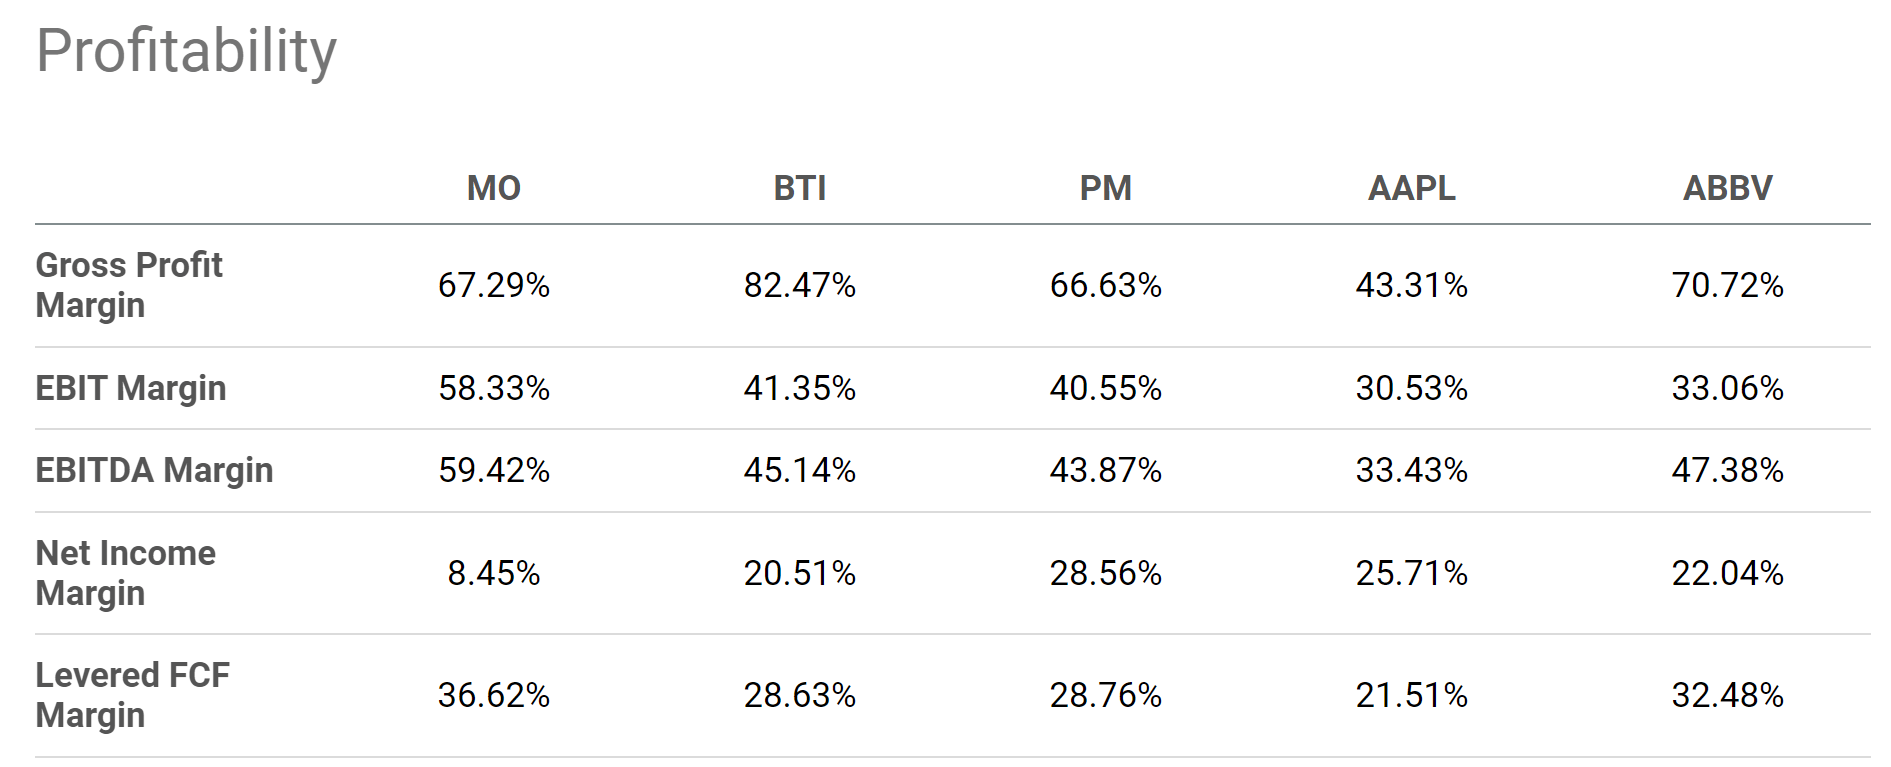
Return on Capital Employed
As explained in our earlier writings, to us, the most important profitability measure is ROCE (return on capital employed) because it considers the return of capital actually employed. I have analyzed the ROCE for both MO and BTI ROCE in our earlier articles, and here, I will just directly quote the results in the chart shown below.
As seen, MO was able to maintain a remarkably high and stable ROCE over the long term (on average 158% in the recent few years since 2017). BTI was able to maintain a superb ROCE over the long term too. On average, its ROCE has been 92% in the recent few years since 2017. To put things under perspective, the average ROCE for the FAANG group has “only” been about 55% in recent years.
Next, we will see that such superb ROCE, when combined with their capital requirement, can create outsized returns in the long term.
Author Based on Seeking Alpha Data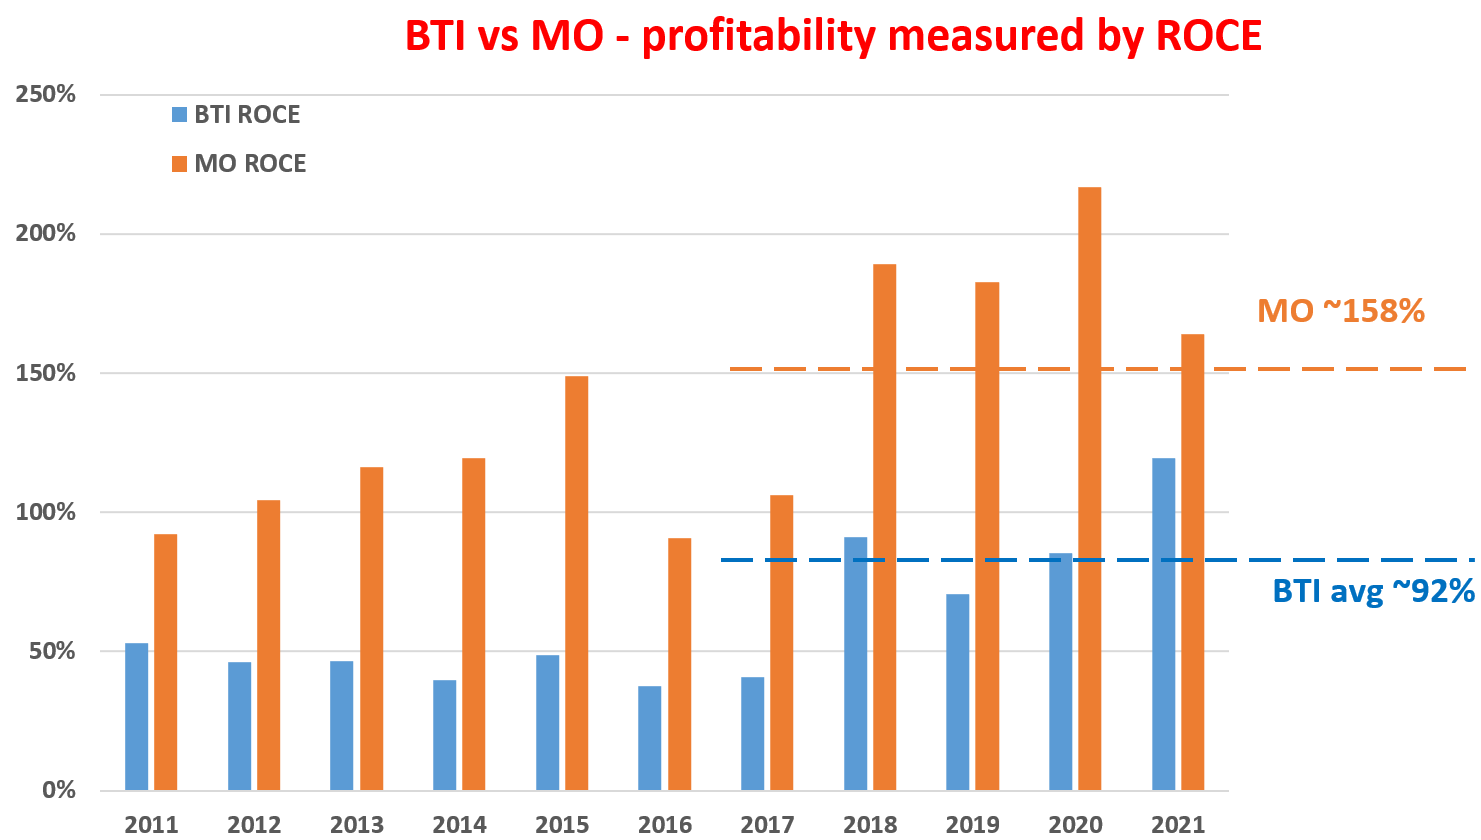
Long-term Return and Perpetual Growth Rate
As detailed in my earlier article:
If you, like us, subscribe to the concepts of owner’s earning and perpetual growth rate, then the long-term return is simple. The long-term return is “simply” the summation of the owner’s earning yield (“OEY”) and the perpetual growth rate (“PGR”), i.e.,
Long-Term ROI = OEY + PGR
The PGR term is governed by two factors – reinvestment rate and ROCE. More specifically, it will be a product of these two factors, i.e.:
PGR = Reinvestment Rate * ROCE
The reason is straightforward and intuitive. If a business earns more profit on every $1 of capital employed, then it only needs to plow back a smaller fraction of its earnings to further grow its future earnings, and vice versa.
Since we have analyzed their ROCE above already, here we will examine their capital allocation and reinvestment rates. The capital allocation picture for MO in recent years is shown below. The picture shows its capital allocation in terms of the percentage of its OPC (operating cash flow). And the picture is quite simple here: MO earns a load of cash organically from its operations but does not need to spend much. To wit, MO has been using, on average, only ~4% of the OPC as maintenance CAPEX. All the remainder cash, more than 96% of its organic cash flow, can be deployed freely. As a dividend champion, it has been using about 87% of the OPC to pay dividends. It also uses a small part of the OPC to repurchase its own shares from time to time. All told, I anticipate the reinvestment rate to be about 5% going forward.
Author Based on Seeking Alpha Data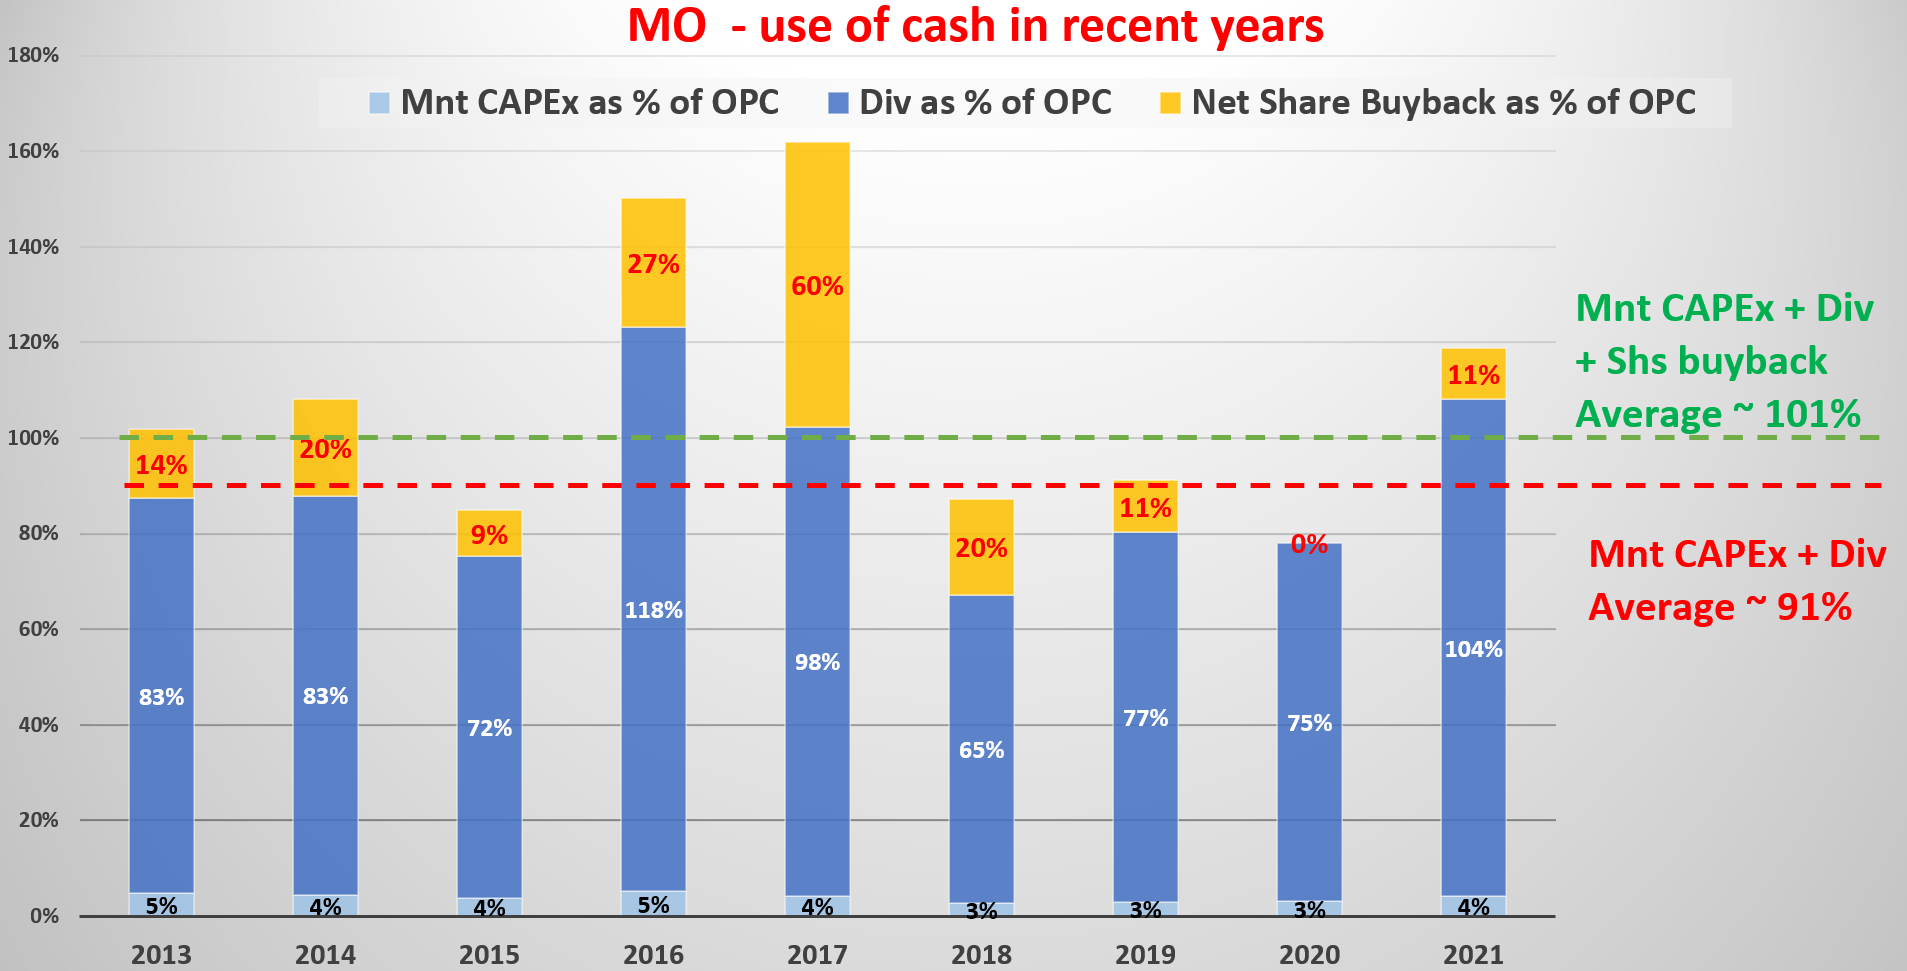
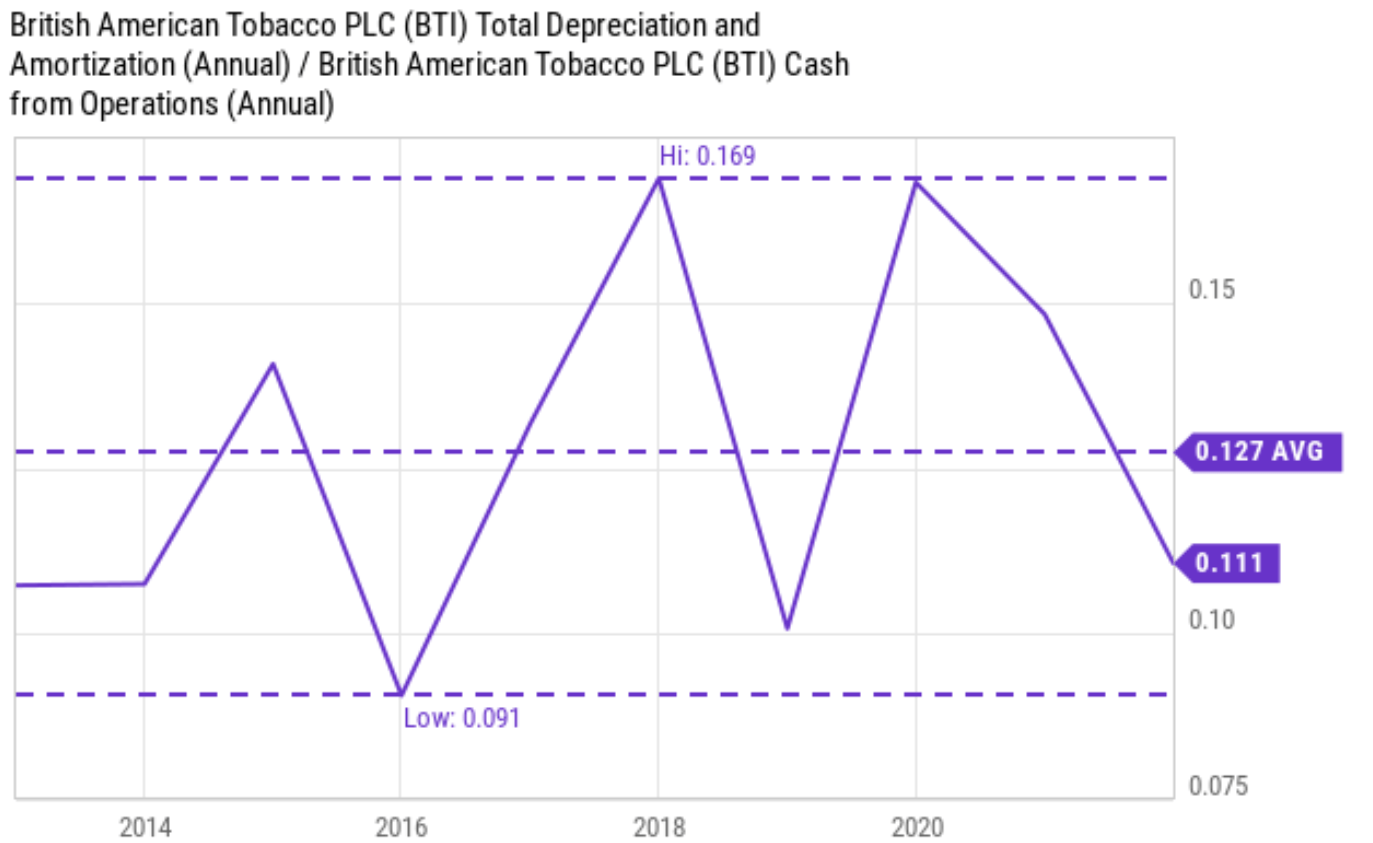
The capital allocation picture for BTI is very similar. And I also anticipate 5% reinvestment rates going forward for BTI. Finally, I want to draw your attention to the extremely low requirement for capital expenditures for both companies before I leave this section. The next two charts show their total depreciation and amortization as a percentage of their OPC. If we use the total depreciation amortization to approximate their maintenance CAPEX requirements, then the maintenance CAPEX requirement is only about 4% of its OPC for MO and only about 12.7% for BTI in the long term. And also note that their current levels of maintenance CAPEX are both below the historical average by a good margin (more than 100 basis points).
Seeking Alpha Data Seeking Alpha Data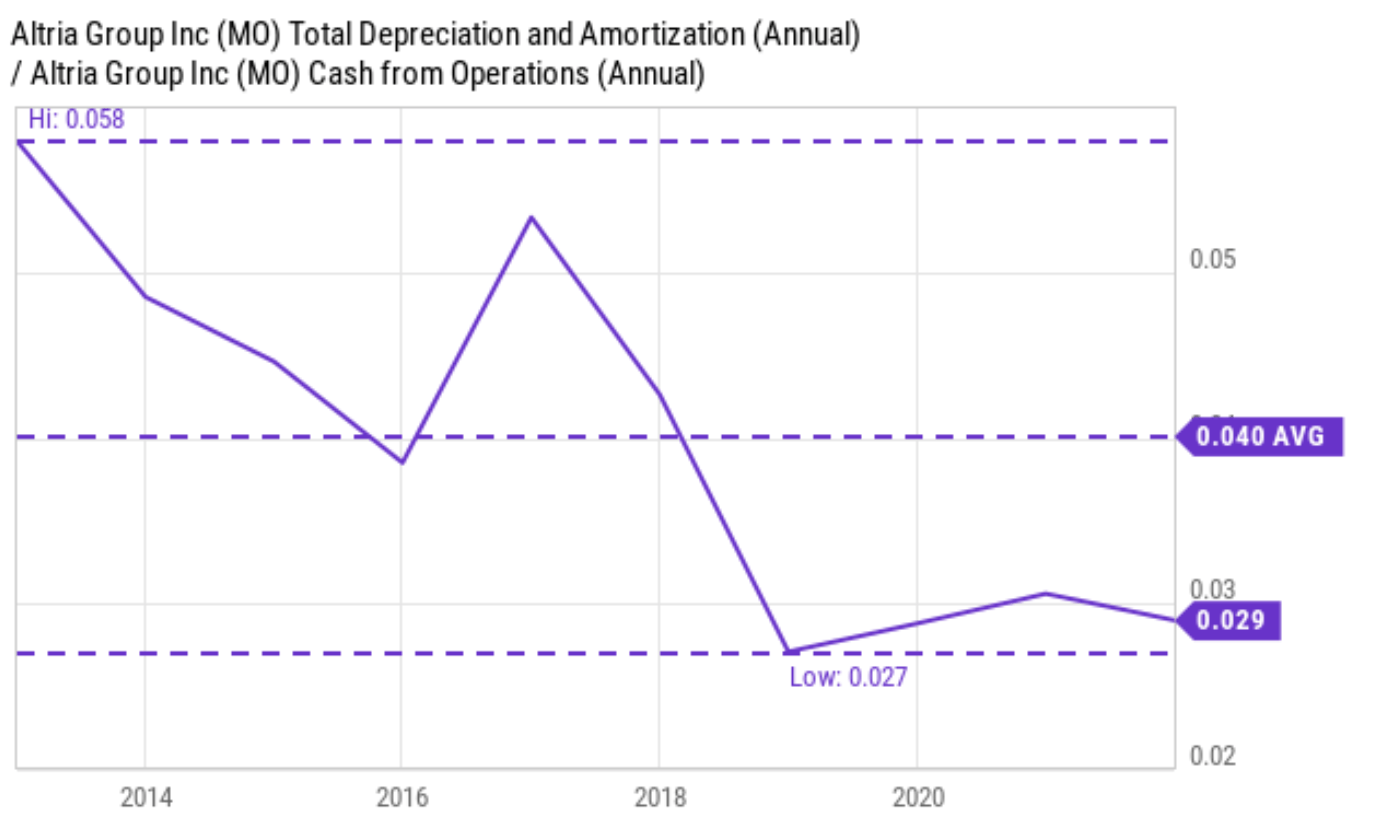
Perpetual Growth Rate and Long-Term Return
The superb ROCE, when combined with capital allocation flexibility, can create outsized returns in the long term as shown in the chart below. At its current price levels, the OEY for both of them is estimated to be ~11.7% (the inverse of their PE around 8.5x). For MO, the PGR is estimated to be about 4.75% (95% ROCE * 5% reinvestment rates). So, the total return in the long term at the current valuation is almost 16.5%. And again, about half of this total return is immediately supported by its current dividend yield of 8.84%.
For BTI, the PGR is a bit lower because of its lower ROCE. It is estimated to be about 4.00% (80% ROCE * 5% reinvestment rates = 4% PGR). So, the total return in the long term at the current valuation is almost 15% (11.7% OEY plus 4% growth). In this case, more than half of this total return is immediately supported by its current dividend yield of 7.75%.
Author Based on Seeking Alpha Data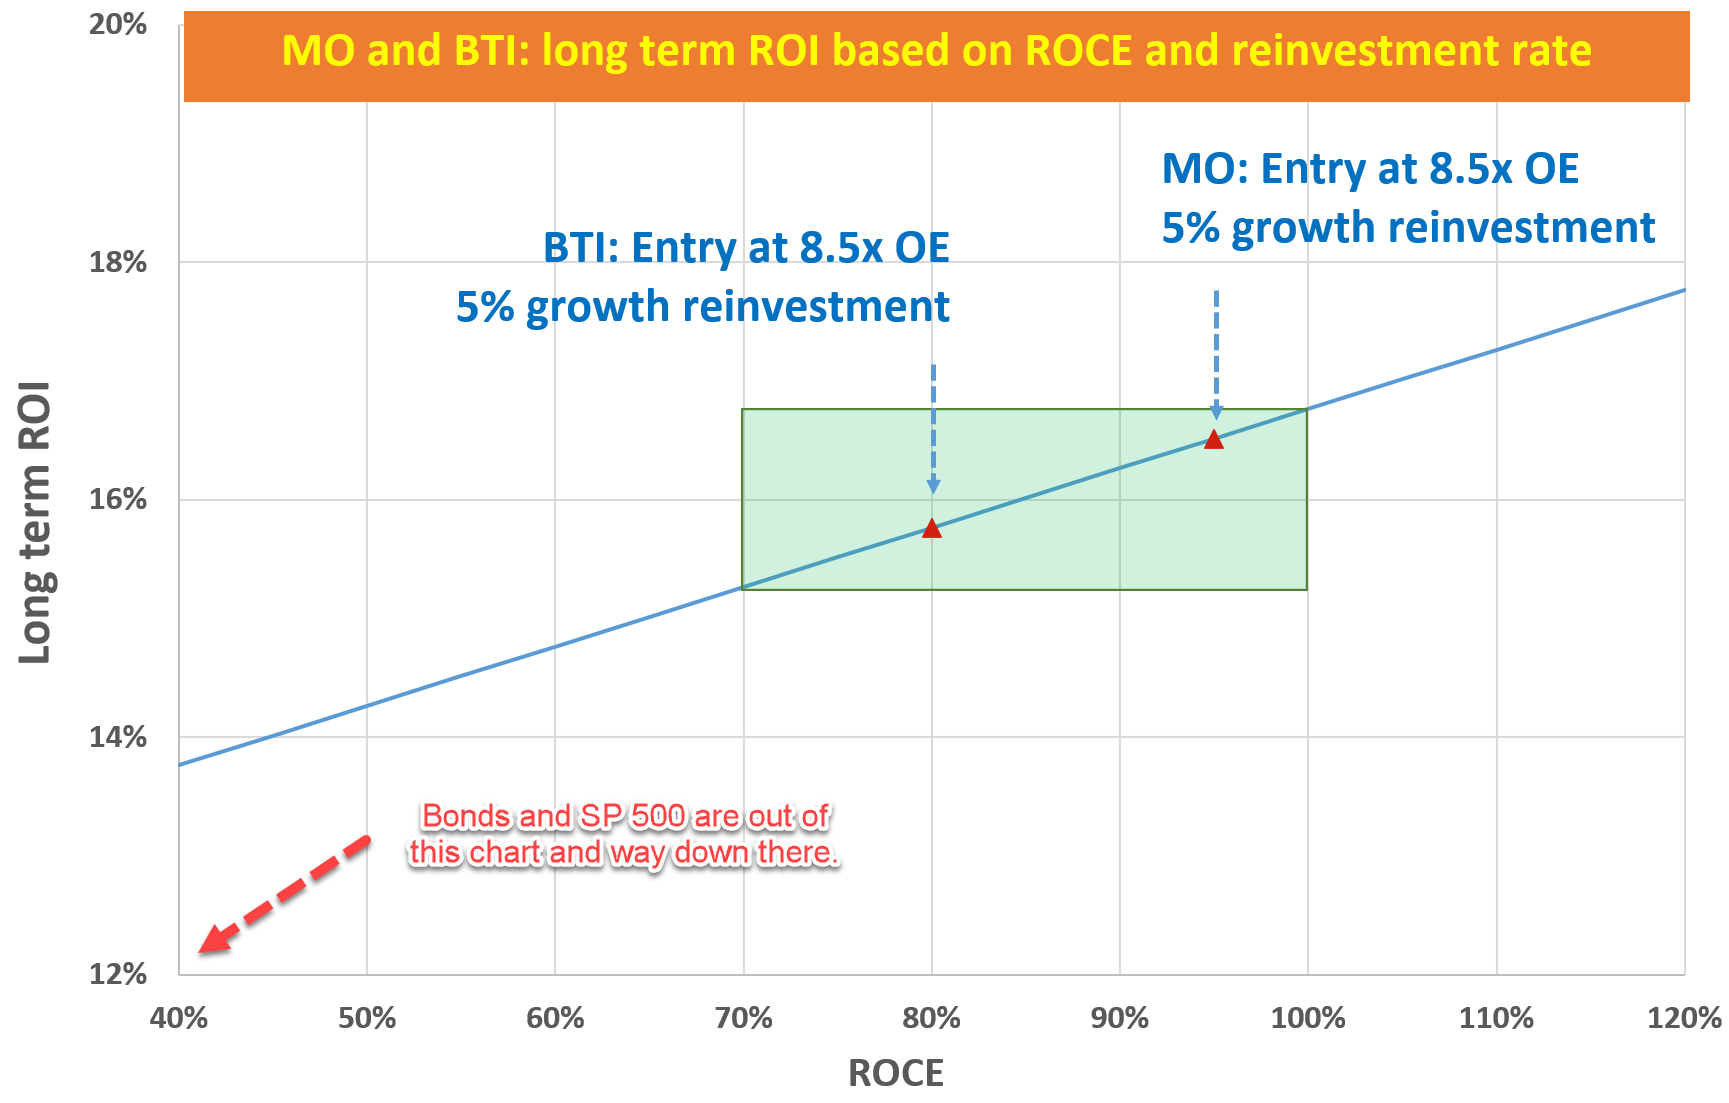
Risks and Final Thoughts
Both MO and BTI face some risks both in the near term and long term. In the long term, both have been dealing with the secular decline of their traditional combustible products. However, both have been demonstrating the pricing power to keep profits stable even when volume decreases; and both have been actively pursuing replacement products and have achieved some success (especially in the case of BTI). In the shorter term, as a global business, BTI is exposed to foreign currency exchange risks and geopolitical risks. As its Group Finance & Transformation Director Tadeu Marroco commented in its recent earnings report (abridged and emphases added by me):
The FX headwind on both group and new category revenue was significant at around 9%. Based on current exchange rates, we would expect a headwind to revenue of around 8% on a full year basis. Our portfolio transformation is accelerating. 15% of our revenue in developed markets is in non-combustibles.
All told, we think these risks are more than compensated by their return potential and their long-term resilience. Their expected returns are far superior to the overall bond market or the stock market. The treasury bond markets currently provide about a 4% return with no growth. And the S&P 500 offers a return potential of around 7.5% in the long term due to its lower OEY and also lower growth rates. The OEY from the S&P 500 is projected to be 5.5%, with a PE of 18.5x as of this writing. And the growth rate is projected to be about 2% with an average ROCE of 20% and an average reinvestment rate of 10%. In contrast, BTI and MO offer about 8% of dividend yield alone, with about 5% organic growth built in.
Final words: do not try to fight the Fed. Just sit on good stocks like BTI or MO and stay out of Fed’s way.
Be the first to comment