

winhorse/iStock Unreleased via Getty Images
Introduction
Headlines note that Alibaba (NYSE:BABA) has higher operating margins than JD (JD) and Amazon (AMZN) since they’re not burdened with a meaningful low-margin first-party (“1P”) business. My thesis is that Alibaba’s asset-light logistics approach is another key reason as to why they have higher commerce operating margins than JD and Amazon.
We look at FY22 for Alibaba through March 2022 and compare it with FY21 for JD and Amazon.
At the time of this writing, 100 RMB equals $15.
The Numbers
Alibaba’s logistics subsidiary, Cainiao, had FY22 revenue of RMB 66,808 million before inter-segment elimination. 69% of this was from external customers outside the Alibaba marketplace ecosystem such that revenue was RMB 46,107 million after inter-segment elimination. The difference, RMB 20,701 million, is what we’re interested in to see how things measure up against Alibaba’s GMV of RMB 8,317 billion. Once caveat is that we assume the logistics economics for internal and external customers do not have night and day differences. Operating losses for the RMB 46,107 million revenue from external customers are RMB 3,920 million such that RMB 50,027 million or 108.5% of this revenue goes to the cost of revenue and operating expenses. If we assume the economics are close to this on the internal side then on an operating level, about RMB 22,461 million was spent on logistics or RMB 20,701 million*1.085. This is miniscule relative to Alibaba’s GMV; it is only 0.27% or RMB 22,461 million/RMB 8,317 billion. In other words, viewed through an operating income lens, for every $100 of GMV, Alibaba/Cainiao barely spends more than a quarter for its logistics. Alibaba marketplace consumers don’t get a free lunch; logistics fees are paid to Cainiao’s capital-intensive partners.
JD has a much more capital intensive model for logistics. One clue for this is the employee count of 316,382 in the 2021 JD Logistics (OTCPK:JDLGF) results. There were only 254,941 employees in all of Alibaba through March 31st. The 2021 JD Logistics results show total revenue of RMB 104.7 billion and revenue from external customers of RMB 59.1 billion leaving revenue from internal customers of 45.6 billion. Here is the overall 2021 income statement for JD Logistics:
2021 JD Logistics income statement (2021 JD Logistics results)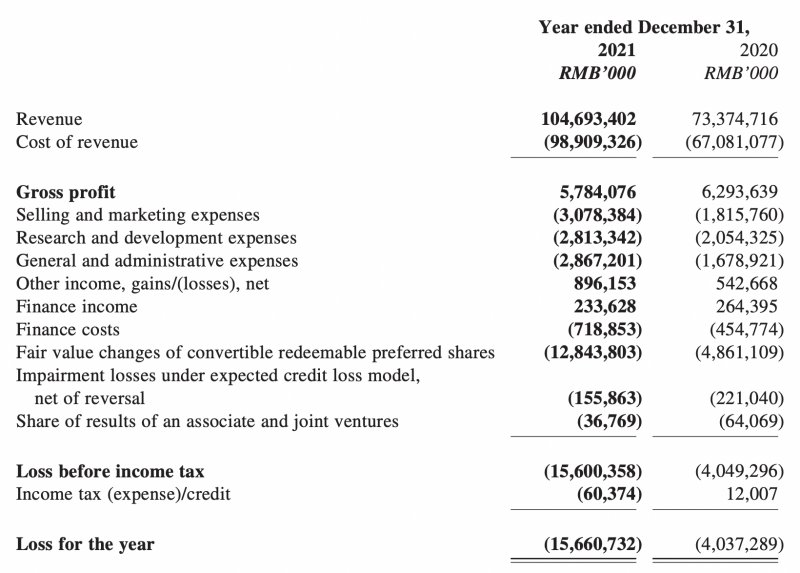
Taking the RMB 104,693 million revenue and subtracting RMB 98,909 million cost of revenue, RMB 3,078 million sales and marketing, RMB 2,813 million R&D and RMB 2,867 G&A, I get an overall operating income loss of RMB 2,974 million such that RMB 107,667 million or 102.8% of revenue was spent on an operating level. If we assume again that the economics are not vastly different for internal and external customers then around RMB 46.9 billion was spent on logistics for internal customers on an operating income level or RMB 45.6 billion*1.028. This is 1.4% of JD’s RMB 3,300 billion GMV.
Logistics are even more capital intensive at Amazon but it can be a bit misleading if we don’t mention that the take rate is higher such that a comparison on GMV alone is somewhat limited. Again, the employee count is telling; Amazon has 1,608,000 full-time and part-time employees and many of them are working in logistics. Unfortunately a comparison with Alibaba and JD based on 1P and 3P revenue would be too confusing seeing as there are factors such as JD’s obfuscation of the breakdown between 1P and 3P. Amazon doesn’t break down revenue for a separate logistics company in the 2021 financials but they do have a fulfillment expense line on the income statement in the amount of $75,111 million. I believe that a substantial majority of this is for internal customers from Amazon’s 3P and 1P segments. Marketplace Pulse estimates their 2021 GMV to be $600 billion so this is 12.5% of GMV or $75,111 million/$600 billion.
Excluding the cloud business for Alibaba and Amazon, we have operating income and operating margins as follows:
Alibaba operating income (Author’s spreadsheet)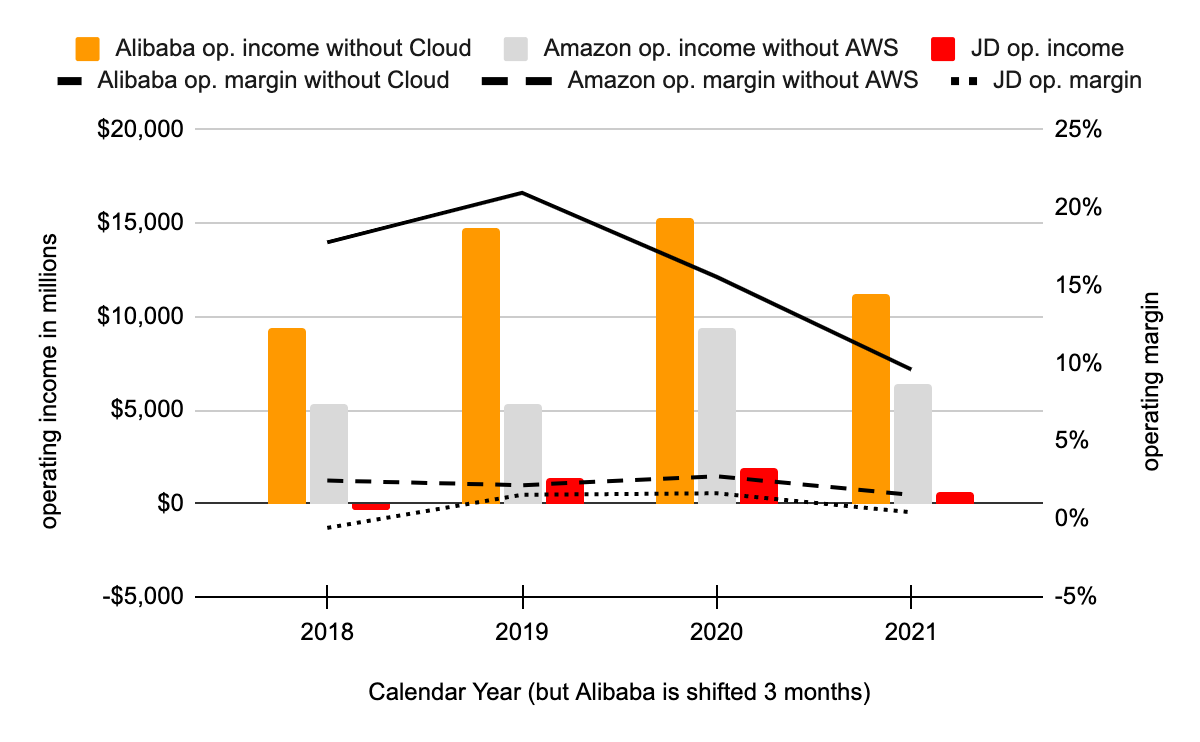
Given the numbers above, it is evident that the logistics model is very important for overall commerce operating margins. Doing a thought experiment on Amazon, it is a fun exercise to see what their overall commerce operating margin would look like if they had a fulfillment model that was less capital intensive. Assuming Amazon’s operating margins for fulfillment are close to break-even, we can look at the ramifications for a hypothetical situation where they spend half as much in this area which would still be much more than what Alibaba spends. Amazon’s 2021 fulfillment expense line is $75 billion and if they spent half this amount or $37.5 billion instead then their revenue would also be about $37.5 billion less. As such, Amazon’s 2021 operating margin excluding AWS would be about 12% or $43,847 million/$370,120 million instead of the current percentage of 1.6% or $6,347 million/$407,620 million. Amazon has overspent on logistics in recent years and this has been a costly mistake given their asset-heavy approach. Cainiao’s asset-light approach gives them flexibility such that the results are not devastating when they overspend.
Alibaba Learned From eBay’s Mistakes
Some companies obsess on operating margins such that they miss opportunities to make smart growth investments through income statement lines. Page 78 of The Everything Store talks about how eBay made this mistake. In 1998, then CEO Meg Whitman told Founder Pierre Omidyar that the last thing eBay wanted to do was manage warehouses like Amazon. Amazon’s GMV has taken off since that time while eBay’s has been flat for many years. Alibaba is not ignoring logistics investments and we can see that their GMV is rising; it’s just that Alibaba is taking a careful approach and doing more outsourcing with the capital intensive parts than Amazon and JD.
Serving External Customers Globally
Again, 69% of Cainiao’s revenue is from external customers. Like Amazon and JD, Alibaba is making considerable logistics investments for external customers such that revenue in this area will continue to rise. A November 2020 article from American Shipper talks about Cainiao moving into Japan to service importers and exporters:
The latest step in Alibaba Group’s global logistics expansion follows last month’s launch of third-party logistics services in South Korea and an air charter service to South America. Alibaba is racing rival Amazon to extend end-to-end logistics services beyond its own delivery needs to other companies. “Alibaba is moving as fast as possible to expand into 3PL services. Like Amazon, they understand that the big growth area for retail is in providing logistics services. Amazon has every intention of becoming a 3PL and Alibaba has to get ahead of this,” said Brittain Ladd, the chief marketing and supply chain officer at Pulse Integration and a former Amazon executive. In Japan, Cainiao will handle first- and last-mile delivery, international ocean and air shipping, customs clearance, trucking and warehouse management.
A Time article from November 2020 notes that Cainiao ties together 3,000 logistic partners and 3 million couriers such that cost and time efficiencies are enjoyed:
For consumers and manufacturers, this means a typical, 1 kg package can be sent anywhere in China within 24 hours for around 30 cents. The goal is to deliver it anywhere in the world within 72 hours for $3. (Currently, a DHL envelope under 0.5 kg from Shanghai to London costs around $100 and takes typically 5 days.)
A June 2021 Moodie Davitt article tells of an agreement enabling Cainiao to serve as the logistics partner for the small and medium-size enterprise (“SME”) export business in South Korea:
As part of the agreement, SMEs will be able to leverage Cainiao’s one-stop logistics management system which provides real-time insights and support across warehouse inventory, order fulfillment, delivery status, billing, and any forms of anomalies for immediate rectification. “SMEs are the growth engines of the economy,” said James Zhao, General Manager for Global Supply Chain, Cainiao Network. “We are honoured to be selected as KOSME’s official logistics partner to support millions of South Korean SMEs in their expansion into new markets to establish business resilience. “As a trusted partner to KOSME and Korean SMEs, our goal is to make cross-border logistics as seamless as possible, by taking care of the digitalised full-chain, including order fulfillment, local and overseas B2B and B2C warehousing, international shipping, customs clearance as well as first and last mile logistics.
An April 2022 Air Cargo News article says Cainiao has been rapidly ramping up their global air cargo network. It tells of Cainiao’s flights from Malaysia to the UK that will service eBay B2B and B2C businesses.
Room For Different Logistics Models
The economies for China and the U.S. have taken off in the digital age and we have plenty of room for multiple types of logistics models in both markets. Per The World Bank, China passed the European Union in GDP for 2021 where the numbers were $17.73 trillion and $17.09 trillion, respectively. This is mind boggling considering that the 2006 numbers were a little under $3 trillion and a little under $13 trillion, respectively. This isn’t on a per capita basis so it’s just a matter of time before China passes the U.S. seeing as these 2 countries represent 18.4% and 4.3% of the world’s population, respectively, per the April 2022 IMF World Economic Outlook:
China GDP (Author’s spreadsheet)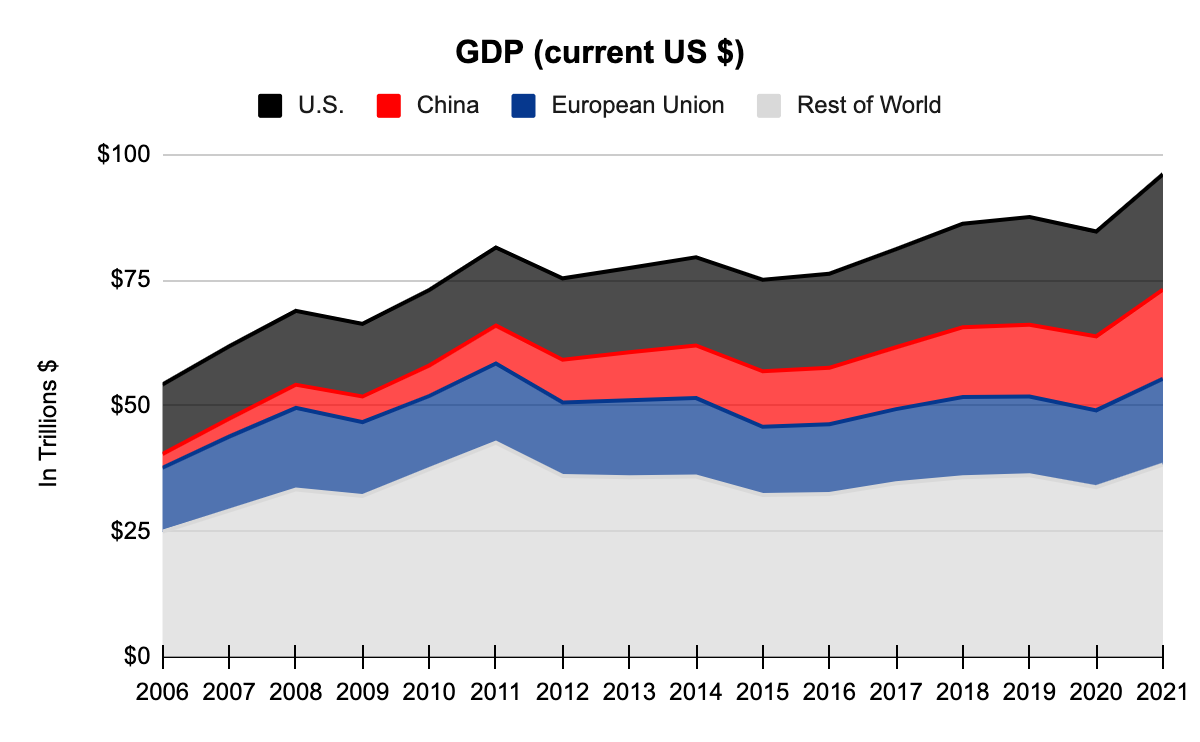
BABA Stock Valuation
The 2020 Investor Day presentation shows 2 types of take rates defined as follows:
1. Take rate for customer management revenue (“CMR”) and commission is the sum of CMR and commission divided by China retail marketplace GMV.
2. Overall take rate for June Quarter 2020 of 4.5% is the sum of CMR, commission, Cainiao domestic revenue and local consumer services revenue, divided by Alibaba Digital Economy GMV (excl. GMV from New Retail, international retail and entertainment).
The first type of take rate has not climbed the way I hoped it would over the last few years:
FY20: 3.7% or RMB 246,482 million/RMB 6,589 billion
FY21: 4.1% or RMB 306,070 million/RMB 7,494 billion
FY22: 3.9% or RMB 315,038 million/RMB 7,976 billion
The second type of take rate includes the Cainiao domestic revenue and local consumer services revenue components which combine for a take rate of less than 1%. These components had a combined take rate of 0.5% at the 2020 Investor Day. I don’t know about Cainiao domestic revenue but Cainiao consolidated revenue and local consumer services have climbed slightly as a percentage of overall revenue over the last few years. They have combined to be 9.4%, 10.1% and 10.5% of revenue for FY20, FY21 and FY22, respectively.
In the past I hoped to see revenue climb from the combination of increased GMV and a higher take rate on that GMV. Now my hopes for a higher rate are more subdued but I still believe GMV can continue growing nicely.
Gross profit margins have been falling steadily from 75% in FY14 to 37% in FY22. In the 3Q18 call, it was explained that many factors hurt gross margins including Cainiao, new retail including Intime Department stores and Hema Fresh Grocery Stores and the digital media entertainment segment. I wish that the digital media investments could be scaled back as management hasn’t done a good job explaining the ROI from these costly efforts.
Adjusted EBITA adds back share-based compensation, impairment of goodwill, the anti-monopoly fine and amortization of intangible assets. It does not add back amortization of licensed copyrights. Looking at the FY21 20-F, these 2 types of amortization components were as follows:
RMB 12,427 million intangible assets
RMB 9,093 million licensed copyrights
————————-
RMB 21,520 million
I view share-based compensation as an ongoing economic expense such that it should not be reversed out. However, it is nice to see the other components broken out and added back in. The FY22 release breaks out core commerce into China commerce, International commerce, local consumer services and Cainiao. I like the FY21 20-F where these 4 segments are consolidated:
Alibaba core segments (2021 20-F)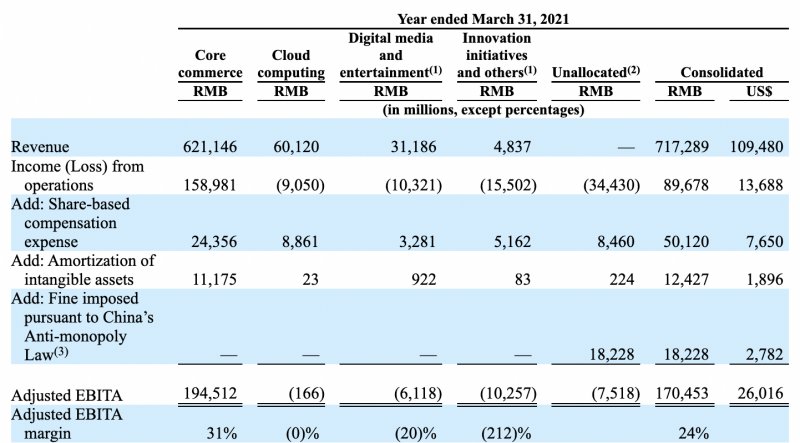
The above FY21 numbers were revised in the 4Q22 release. The FY21 consolidated revenue of RMB 717,289 million stayed the same but the innovation segment was revised down by RMB 2,526 million from RMB 4,837 million to RMB 2,311 million. Combined, the core and cloud segments were revised up by RMB 2,526 million and the components were RMB 2,088 million and RMB 438 million, respectively. As such, core and cloud were revised up to RMB 623,234 million and RMB 60,558 million, respectively.
Looking at the FY22 revenue numbers from the 4Q22 release, we see that core, cloud and digital went up by 19%, 23% and 3%, respectively, to RMB 743,381 million, RMB 74,568 million and RMB 32,272 million, respectively. Again, the 4Q22 release breaks core down to China commerce, International commerce, local consumer services and Cainiao:
Alibaba core EBITA (4Q22 release)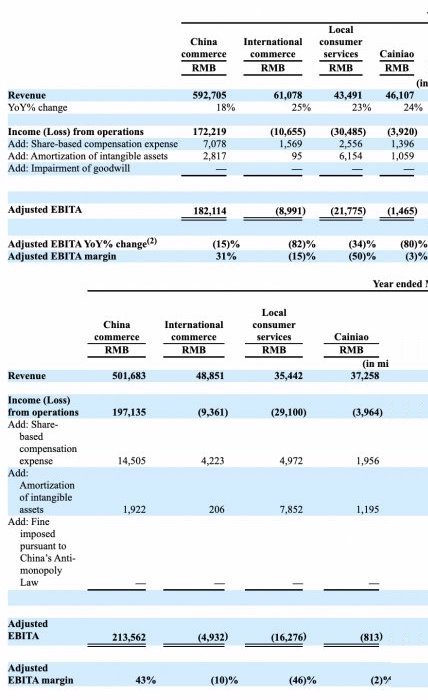
China commerce, International commerce, local consumer services and Cainiao saw year-over-year revenue climb 18%, 25%, 23% and 24%, respectively.
Zooming out to see all the segments from the 4Q22 release, it is laudable that the cloud segment is becoming more economically viable. Including stock-based compensation, it improved from operating income of negative RMB 22,684 million in FY21 to negative RMB 11,464 million in FY22:
Alibaba segments (4Q22 release)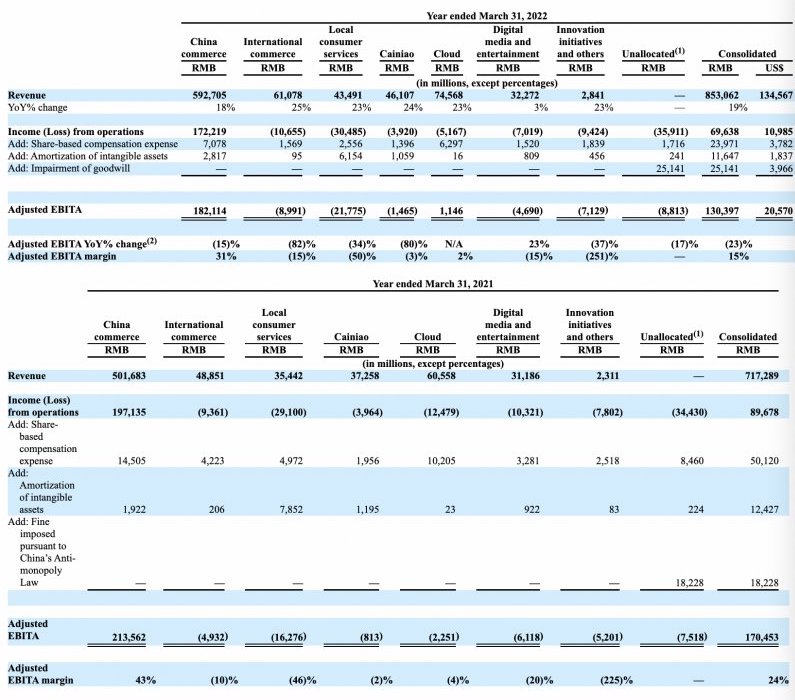
I like to think about operating income in 3 branches. The first branch is the China commerce segment which is fairly mature. Operating income for China e-commerce fell from RMB 197,135 million in FY21 to RMB 172,219 million in FY22. This was on segment revenues of RMB 501,683 million and RMB 592,705 million, respectively, for operating margins of 39% and 29%, respectively.
The second branch is composed of the remaining segments for core commerce: International commerce, local consumer services and Cainiao. Operating income for this second branch fell from negative RMB 42,425 million in FY21 to negative RMB 45,060 million in FY22.
The third branch is for cloud, digital, innovation and unallocated. Operating income for this group improved from negative RMB 65,032 million in FY21 to negative RMB 57,521 million in FY22.
Again, the China commerce segment has operating income of RMB 172,219 million or $25.8 billion. I think the segment is worth 15 to 16 times this amount or $387 to $413 billion. The other segments are worth more than zero but being conservative and using round numbers, I think Alibaba is worth $390 to $410 billion.
21,401 million shares were outstanding through March 2022. Each American depositary share equates to 8 ordinary shares so we divide this by 8 to get a count of 2,675.125. Multiplying this by the July 8th price of $120.90 gives us a market cap of $323.4 billion. The enterprise value is a little less than the market cap.
The market cap is less than my valuation range and I think the stock is undervalued.
Disclaimer: Any material in this article should not be relied on as a formal investment recommendation. Never buy a stock without doing your own thorough research.
Be the first to comment