

David Becker
Alibaba Group Holding Limited (NYSE:BABA, OTCPK:BABAF) is a large Chinese-based online marketplace that showed strength in its stock price up until 2020. However, as explained in this analysis, Alibaba stock has been in a relatively long-term decline with no sign of reversing. Poor fundamentals with weak estimates and subpar technical indicators seem to hold back the stock price at this time.
Fundamentals with long-term steep declines
Ratios
Based on these current ratios over the last five years, Alibaba’s current ratio and quick ratios peaked in 2020 but started to decline.
|
Unnamed: 0 |
2018 |
2019 |
2020 |
2021 |
2022 |
|
Period |
FY |
FY |
FY |
FY |
FY |
|
Current ratio |
1.891 |
1.301 |
1.914 |
1.705 |
1.664 |
|
Quick ratio |
1.735 |
1.122 |
1.682 |
1.432 |
1.186 |
Source: Financial Modelling Prep.
Growth
Revenue growth has declined over the last four years, with barely enough profit for this year. Based on the current negative operating income growth, Alibaba could have a negative year, as hinted by the net income growth.
|
Unnamed: 0 |
2018 |
2019 |
2020 |
2021 |
2022 |
|
Period |
FY |
FY |
FY |
FY |
FY |
|
Revenue growth |
0.581 |
0.506 |
0.353 |
0.407 |
0.189 |
|
Gross profit growth |
0.450 |
0.186 |
0.338 |
0.302 |
0.059 |
|
Ebitgrowth |
0.442 |
-0.176 |
0.602 |
-0.019 |
-0.223 |
|
Operating income growth |
0.442 |
-0.176 |
0.602 |
-0.019 |
-0.223 |
|
Net income growth |
0.467 |
0.371 |
0.700 |
0.008 |
-0.587 |
Source: Financial Modelling Prep.
Data
Simple moving average periods have been very negative this year. Compared to the most recent 20 days, it is very negative compared to other equivalent online marketplaces.
|
Unnamed: 0 |
Values |
|
SMA20 |
-15.14% |
|
SMA50 |
-23.47% |
|
SMA200 |
-35.82% |
Source: FinViz.
Enterprise
The stock price has been relatively weak this year. As a result, market capitalization has drastically dropped this year compared to last year.
|
Unnamed: 0 |
2018 |
2019 |
2020 |
2021 |
2022 |
|
Symbol |
BABA |
BABA |
BABA |
BABA |
BABA |
|
Stock price |
178.540 |
185.570 |
202.670 |
230.950 |
97.090 |
|
Number of shares |
2.553 B |
2.580 B |
2.627 B |
2.702 B |
2.702 B |
|
Market capitalization |
455.813 B |
478.771 B |
532.439 B |
624.114 B |
262.374 B |
|
Enterprise value |
2.912 T |
3.080 T |
3.304 T |
3.948 T |
1.670 T |
Source: Financial Modelling Prep.
Estimate
Like any other big technology company, Alibaba projects steady growth over the next five years. However, it still underperforms compared to the other competing American big tech companies.
|
YEARLY ESTIMATES |
2022 |
2023 |
2024 |
2025 |
2026 |
|
Revenue |
27,847 |
31,577 |
36,091 |
40,100 |
45,086 |
|
EPS |
3.93 |
4.81 |
5.68 |
6.36 |
7.44 |
|
P/E Ratio |
21.84 |
17.83 |
15.11 |
13.50 |
11.54 |
|
EBIT |
5,668 |
6,734 |
7,823 |
8,378 |
9,497 |
|
EBITDA |
6,741 |
7,893 |
9,201 |
8,938 |
– |
|
Net Profit |
4,545 |
5,409 |
6,305 |
6,744 |
7,902 |
|
EPS (GAAP) |
1.66 |
3.26 |
3.81 |
4.43 |
5.29 |
|
Total Assets |
80,011 |
89,579 |
101,914 |
79,910 |
– |
Source: Business Insider
Technical Analysis shows stock price reversal
Fibonacci
There has been a substantial decline for Alibaba since its high peak stock price back in June 2020. Based on other factors for this year, there appears to be no upward momentum anytime soon. It would be fine when looking for a bottoming reversal, as other competitors have started much earlier.
fibonacci alibaba (custom platform)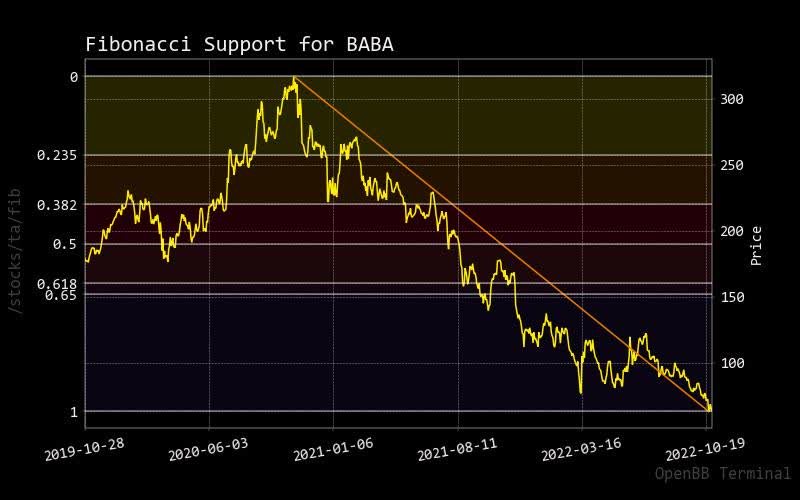
Bollinger Bands
As the stock price continues for a long-term decline with Alibaba, it pushes against the lower Bollinger band, which hints at continued long-term downward pricing in this stock.
bollinger baba (custom platform)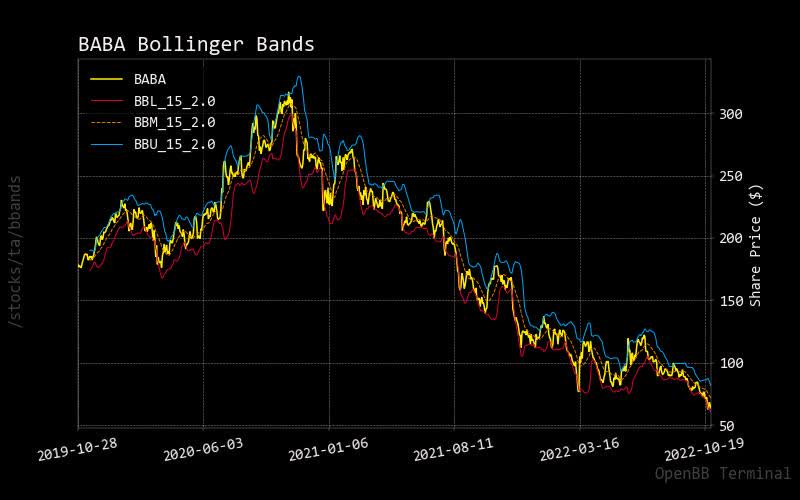
MACD
Even on a compressed pricing MACD chart, Alibaba shows a long-term decline if it stays below the zero line, with no potential uptrend coming anytime soon. Be aware of the previous MACD price spiking in the spring, which appeared to have no impact on the stock price.
macd baba (custom platform)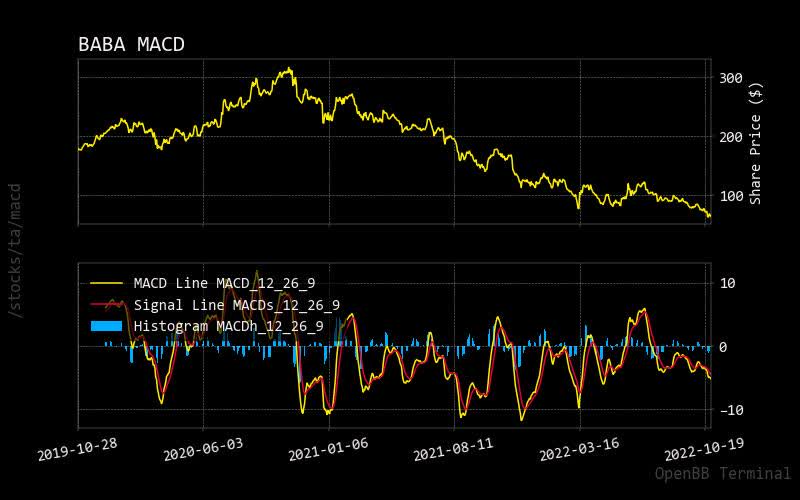
Prediction via AI
Monte Carlo
montecarlo baba (custom platform)
Unfortunately for Alibaba, there are no predicted pricing paths with upward movement based on the results of this Monte Carlo simulation. Also, you can see the most recent stock price of the normalized distribution on the right side. It seems weak compared to the left side. Therefore, a more substantial negative down move is expected on the current BABA stock price.
Regression
Even the forecasted 30-day red regression line shows flat movement. Therefore, without solid news catalysts to drive up Alibaba’s stock price, one can expect further stock price declines.
regression baba (custom platform)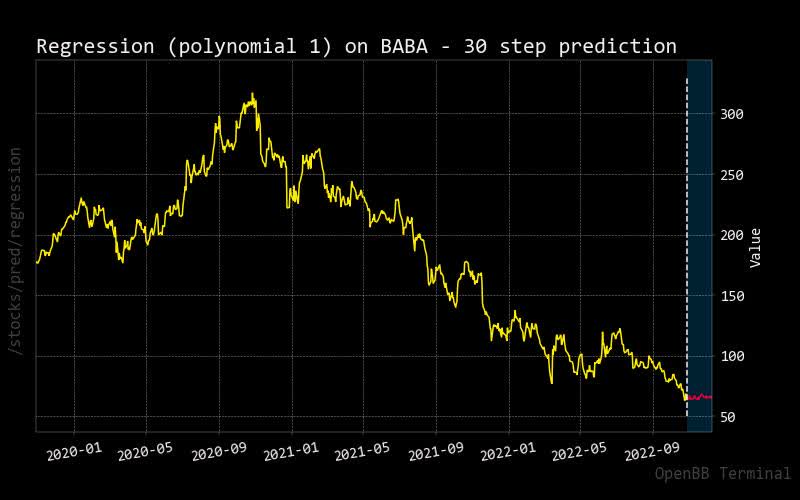
Risk is not worthy
Recommendation
Surprisingly, there are more neutral calls than sell, but poor fundamental and technical analysis indicate otherwise.
|
Interval |
RECOMMENDATION |
BUY |
SELL |
NEUTRAL |
|
One month |
SELL |
6 |
10 |
10 |
|
One week |
NEUTRAL |
7 |
9 |
10 |
|
One day |
NEUTRAL |
8 |
10 |
8 |
Source: Trading View.
Sustainability
Even if Alibaba had an ESG sustainability rating of outperformance, it would not matter with strong declining trends. So, a positive news catalyst must drive up Alibaba’s stock price.
|
Unnamed: 0 |
Value |
|
Social score |
9.92 |
|
Peer count |
105 |
|
Governance score |
5.36 |
|
Total esg |
15.99 |
|
Highest controversy |
2 |
|
ESG performance |
UNDER_PERF |
|
Percentile |
12.68 |
|
Peer group |
Software & Services |
|
Environment score |
0.71 |
Source: Yahoo Finance.
Insiders
Insider Activity
Two executives show no confidence in the stock of Alibaba. Admittedly, there was some buying activity earlier this year, but that isn’t significant as stock prices still decline.
|
Date |
Shares Traded |
Shares Held |
Price |
Type |
Option |
Insider |
Trade |
|
2022-07-14 |
1,076.00 |
66,117.00 |
73.91 |
Sell |
No |
Alford Peggy |
-1076.0 |
|
2022-08-03 |
21,791.00 |
18,100.00 |
97.82 |
Sell |
No |
Alford Peggy |
-21791.0 |
|
2022-09-14 |
597.00 |
9,373.00 |
nan |
Buy |
No |
Alford Peggy |
597.0 |
|
2022-09-14 |
296.00 |
9,077.00 |
96.4 |
Sell |
No |
Alford Peggy |
-296.0 |
|
2022-09-15 |
150.00 |
8,927.00 |
94.95 |
Sell |
No |
SCHULMAN DANIEL H |
-150.0 |
Source: Business Insider.
Conclusion
For Alibaba, the stock price shows significant weakness on a long-term basis. It shows no reversal process recovery is underway compared to stocks in its sector. Technical analysis verifies steep declines no different than some fundamental indicators. Over the long run, Alibaba should stay at a sell rating until a bottom reversal process is seen.
Editor’s Note: This article was submitted as part of Seeking Alpha’s Top Ex-US Stock Pick competition, which runs through November 7. This competition is open to all users and contributors; click here to find out more and submit your article today!
Be the first to comment