

imaginima
Author’s Note: PART 2 of this article is a continuation from PART 1 which was discussed in a previous publication. Please see PART 1 of this article for a detailed projection of AGNC Investment Corp.’s (NASDAQ:AGNC) income statement (technically speaking, the company’s “consolidated statement of comprehensive income (loss)”) for the second quarter of 2022 regarding the following accounts: 1) interest income; 2) interest expense; 3) gain (loss) on sale of investment securities, net; and 4) gain (loss) on derivative instruments and other securities, net (including four “sub-accounts”). PART 1 also discussed AGNC’s projected net loss, earnings per share (“EPS”), and net spread + net dollar roll (“NDR”) amounts. PART 1 help leads to a better understanding of the topics and analysis that will be discussed in PART 2. The links to PART 1 is provided below:
REIT Forum Version (Expanded Analytics):
Public Version:
Focus of Article:
The focus of PART 2 of this article is to provide a detailed projection of AGNC’s consolidated statement of comprehensive income (loss) for the second quarter of 2022 regarding the following accounts: 5a) “unrealized gain (loss) on investment securities measured at fair market value (“FMV”) through net income, net”; and 5b) “unrealized gain (loss) on available-for-sale (“AFS”) securities, net”. PART 2 also discusses AGNC’s projected other comprehensive income (loss) (OCI/(OCL)) and comprehensive income (loss) amounts. For readers who just want the summarized account projections, I would suggest to scroll down to the “Conclusions Drawn” section near the bottom of the article.
By understanding the trends that occurred within AGNC’s operations during the second quarter of 2022, one can apply this information to sector peers as well. As such, the discussion/analysis below is not solely applicable to AGNC but to the fixed-rate agency mREIT sector as a whole. This includes, but is not limited to, the following fixed-rate agency mREIT peers: 1) ARMOUR Residential REIT, Inc. (ARR); 2) Cherry Hill Mortgage Investment Corp. (CHMI); 3) Dynex Capital, Inc. (DX); 4) Invesco Mortgage Capital Inc. (IVR); 5) Annaly Capital Management, Inc. (NLY); 6) Orchid Island Capital, Inc. (ORC); and 7) Two Harbors Investment Corp. (TWO). It should be noted CHMI and TWO are also considered fixed-rate agency + mortgage servicing rights (“MSR”) mREIT peers and could be classified as a separate sub-sector. In particular, PART 2 provides a discussion of fixed-rate agency MBS price movements which all of the sector peers listed above are currently heavily invested in regarding fair market values (“FMV”).
5a) Unrealized Gain (Loss) on Investment Securities Measured at FMV Through Net Income, Net:
- Estimate of ($1.1) Billion; Range ($1.35) Billion – ($850) Million
- Confidence Within Range = Moderate
- See Boxed Blue Reference “5a” in Table 9 Below Next to the June 30, 2022 Column
AGNC’s unrealized gain (loss) on investment securities measured at FMV through net income, net account was created by the company several years ago due to a change in accounting treatment of its MBS/investment portfolio. All unrealized FMV fluctuations on investment securities acquired on or after 1/1/2017 are now recognized within this account. All unrealized FMV fluctuations on investment securities acquired prior to 1/1/2017 continue to be recognized in the account described next. Since this is merely a financial reporting/classification change, AGNC’s entire MBS/investment portfolio is analyzed in the next account (even though a growing portion of the portfolio is classified in the account described here).
5b) Unrealized Gain (Loss) on AFS Securities, Net:
- Estimate of ($355) Million; Range ($555) – ($155) Million
- Confidence Within Range = Moderate to High
- See Boxed Blue Reference “5a” in Table 9 Below Next to the June 30, 2022 Column
Projecting AGNC’s unrealized gain (loss) unrealized gain (loss) on AFS securities, net account is an analysis that includes several assumptions and variables that need to be taken into consideration. Since this account is the summation of the quarterly unrealized valuation changes within AGNC’s MBS/investment portfolio (by far the largest asset class on the company’s balance sheet), a wider projection range should be accompanied with this specific account. The same assumptions used within AGNC’s gain (loss) on sale of investment securities, net account and gain (loss) on derivative instruments and other securities, net account (regarding the company’s TBA MBS position; see PART 1 of article) apply when discussing this account.
Prior to performing an account projection analysis, let us first analyze the fixed-rate “generic“ agency MBS price movements during the second quarter of 2022. Using Table 7 below as a reference, let us first analyze the 15-year fixed-rate agency MBS price movements. This will then be followed by a similar analysis (via Table 8) of the 30-year fixed-rate agency MBS price movements for the same timeframe. By doing so, this will help readers understand how I begin to come up with my projected valuations discussed later in the article.
Table 7 – 15-Year Fixed-Rate Agency MBS Price Movements (Q2 2022)
The REIT Forum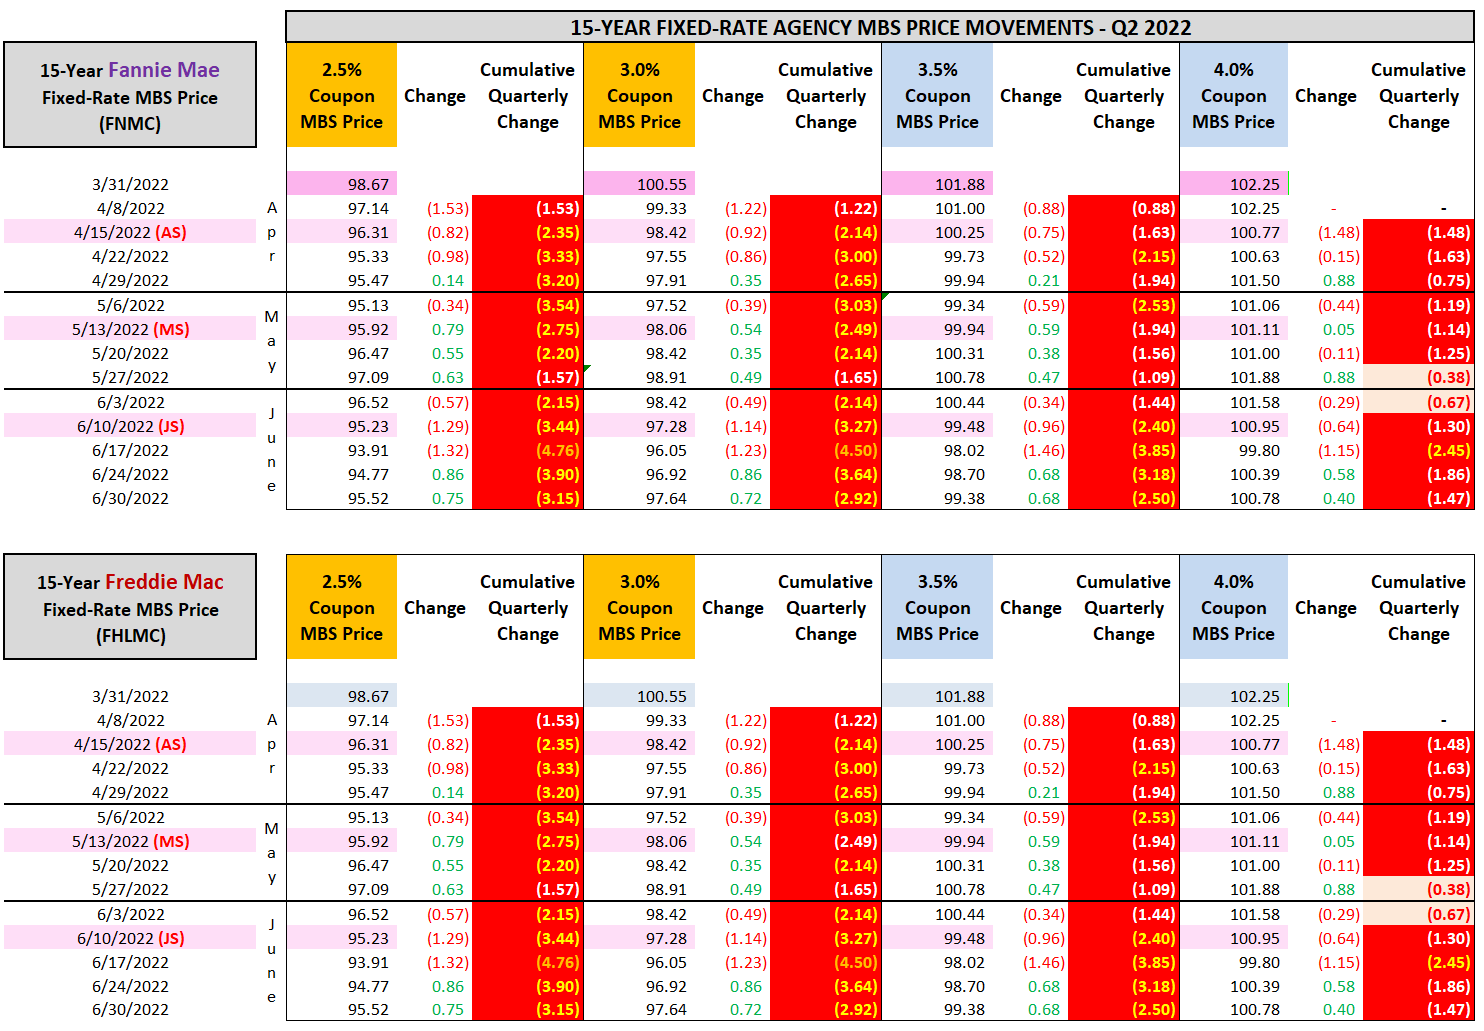
(Source: Table created by me, using MBS pricing data via private access to a professional resource [Thomson Reuters])
Table 7 above shows the 15-year fixed-rate agency MBS price movements during the second quarter of 2022. It breaks out these agency MBS holdings by “government-sponsored enterprise/entity” (“GSE”). This includes both Fannie Mae (OTCQB:FNMA) and Freddie Mac (OTCQB:FMCC) MBS. As of 3/31/2022, AGNC’s Ginnie Mae holdings accounted for less than 1% of the company’s MBS portfolio. As such, Ginnie Mae fixed-rate agency MBS price movements are deemed immaterial for discussion purposes and thus excluded from this table. Table 7 further breaks out the 15-year fixed-rate agency MBS price movements into the various coupons on AGNC’s books ranging from 2.5% – 4.0%. AGNC currently holds an immaterial balance under the 2.5% coupon and over the 4.0% coupon (at least regarding generic MBS) and thus these specific coupons are excluded from Table 7 above. From the information provided in Table 7, a valuation gain (loss) can be calculated which is broken down by the various coupons. It should also be noted AGNC continually changes the company’s MBS/investment portfolio in any given quarter. As such, I must determine specific purchase and sale assumptions towards the end of my account projection analysis (including specified pool considerations).
Using Table 7 above as a reference, let us look at the 15-year fixed-rate agency MBS price movements regarding coupon rates where AGNC held a material balance as of 3/31/2022. The cumulative quarterly net MBS price movements for each coupon rate are shown within Table 7 under the “Cumulative Quarterly Change” column. For example, during the second quarter of 2022, a Fannie 15-year fixed-rate agency MBS with a 2.5%, 3.0%, 3.5%, and 4.0% coupon had a cumulative quarterly price increase (decrease) of (3.15), (2.92), (2.50), and (1.47) to settle its price at 95.52, 97.64, 99.38, and 100.78, respectively. As such, a notable (at or greater than 0.75) price decrease occurred on the 2.5%, 3.0%, 3.5%, and 4.0% coupons.
Simply put, as mortgage interest rates/longer-term U.S. Treasury yields continued to quickly increase, extension risk continued to increase within all coupon fixed-rate agency MBS (which negatively impacted generic pricing). This general relationship was first discussed in PART 1. It should be noted, at the beginning of 2020, there was a combination of Fannie and Freddie investments to create one “uniform/universal” fixed-rate agency MBS product. As such, when it comes to this type of investment, currently there is one fixed-rate agency Fannie/Freddie MBS product. Now that we have an understanding of the 15-year fixed-rate agency MBS price movements during the second quarter of 2022, let us take a look at the 30-year fixed-rate agency MBS price movements.
Table 8 – 30-Year Fixed-Rate Agency MBS Price Movements (Q2 2022)
The REIT Forum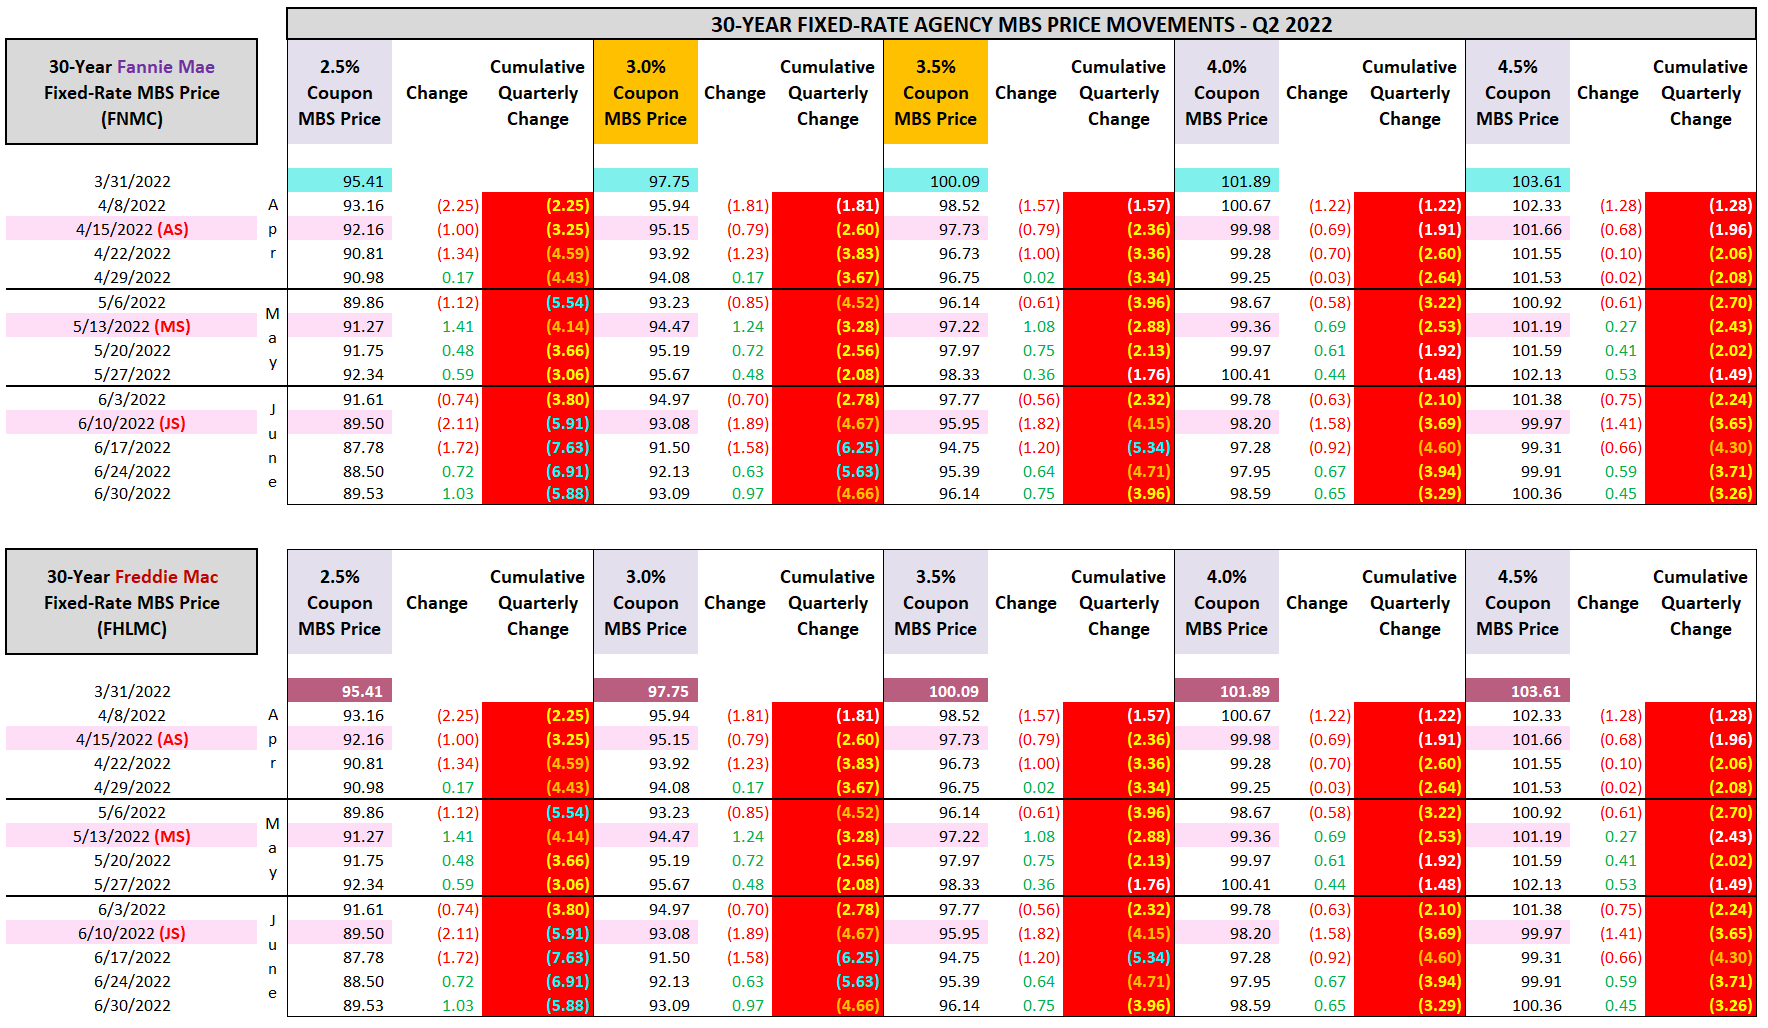
(Source: Table created by me, using MBS pricing data via private access to a professional resource [Thomson Reuters])
Table 8 above shows the 30-year fixed-rate agency MBS price movements during the second quarter of 2022. It breaks out these MBS holdings by GSE as well. As stated earlier, AGNC’s Ginnie Mae fixed-rate agency MBS holdings are deemed immaterial for discussion purposes and are excluded from this table. Table 8 further breaks out the 30-year fixed-rate agency MBS price movements into the various coupons on AGNC’s books ranging from 2.5% – 4.5%. AGNC currently holds an immaterial balance under the 2.5% coupon (when considering the net (short) TBA MBS position in the 2.0% coupon as of 3/31/2022) and over the 4.5% coupon (at least regarding generic MBS) and thus these specific coupons are excluded from Table 8 above. From the information provided in Table 8, a valuation gain (loss) can be calculated which is broken down by the various coupons.
Using Table 8 above as a reference, let us look at the 30-year fixed-rate agency MBS price movements regarding coupon rates where AGNC held a material balance as of 3/31/2022. For example, during the second quarter of 2022, a Fannie 30-year fixed-rate agency MBS with a 2.5%, 3.0%, 3.5%, 4.0%, and 4.5% coupon had a cumulative quarterly price increase (decrease) of (5.88), (4.66), (3.96), (3.29), and (3.26) to settle its price at 89.53, 93.09, 96.14, 98.59, and 100.36, respectively. As such, a notable price decrease occurred on the 2.5%, 3.0%, 3.5%, 4.0%, and 4.5% coupons. Now that we have an understanding of the 15- and 30-year fixed-rate agency MBS price movements during the second quarter of 2022, let us take a look at how I believe these price movements impacted AGNC’s MBS/investment portfolio from a valuation standpoint.
I am projecting an “initial” net valuation loss of ($2.20) billion regarding AGNC’s on-balance sheet 15- and 30-year fixed-rate agency MBS holdings for the second quarter of 2022. I would point out this projected figure considers the vast majority of the company’s fixed-rate agency MBS holdings were within various types of “specified pools” as of 3/31/2022 and excludes its TBA MBS activities (which are considered off-balance sheet derivative instruments per GAAP accounting). These types of investments are prepayment-protected holdings mainly through the Home Affordable Refinance Program (“HARP”) and low-loan balance [LLB] securities. In a nutshell, the “pay-up”/premium associated with these types of securitizations, when compared to “generic/TBA” MBS, continued to narrow during the quarter (if not already at no premium). Simply put, market participants became much more open to the idea that the rise in mortgage interest rates/longer-term U.S. Treasury yields was “here to stay”. As such, generally speaking, specified pool pay-ups were negatively impacted during the quarter; mainly within higher, newer-production coupons.
Of course, as is the case during any quarter, specific classifications, vintages, and underlying characteristics ultimately impacted net valuation fluctuations. Detailed data/analysis in relation to AGNC’s specified pools (over 25 different sub-classifications/vintages) is considered “proprietary data” when it comes to my tailored valuation models (which has taken numerous man hours [and to be frank many quarters] to precisely “tweak”). If I were to provide all the “working parts” to my valuation models it is analogous to Kentucky Fried Chicken providing all of its competitors the “secret sauce” which makes their product taste the best. Simply put, then everyone would be using the recipe and KFC suffers from a drop in sales (in my case it would likely be a drop in readership). This is why I have to set certain “boundaries” regarding sharing/showing detailed quantitative data/projections. With that said, I still believe myself (along with CO Wealth Management Fund and his team) provide, by far, the most details within the mREIT sector when considering both Marketplace Services and public readership. We have a notable strategic advantage. Nearly all other Seeking Alpha contributors mainly report earnings. In comparison, I/we accurately-very accurately “project” earnings in the vast majority of mREITs, each and every quarter (big difference that provides tremendous value to readers/subscribers via spotting price dysfunctions through my/our valuation methodology).
In addition, through a detailed calculation that will be omitted from this particular article, I am projecting AGNC had a net valuation loss of ($25) million during the second quarter of 2022 in regards to the following MBS holdings: 1) 20-year fixed-rate; 2) collateralized mortgage obligations (“CMO”); 3) adjustable-rate mortgages (“ARM”); 4) credit risk transfers (“CRT”); and 5) AAA non-agency. Also, when considering the impacts of an assumed partial conversion of AGNC’s net long TBA MBS position and the company’s realignment of its MBS/investment portfolio throughout the quarter (change in leverage), I am projecting a net valuation gain of $70 million for the second quarter of 2022.
Therefore, when all the figures stated above are combined, I am projecting a total net valuation loss of ($2.16) billion on AGNC’s on-balance sheet MBS/investment portfolio for the second quarter of 2022. This figure is prior to all sold MBS/investments being reversed out in the current quarter (discussed in PART 1 of the article) and the reclassification of all MBS/investments purchased after 1/1/2017. These two reversals are shown in Table 9 below.
Table 9 – AGNC Quarterly Unrealized Gain (Loss) on AFS Securities, Net Projection
The REIT Forum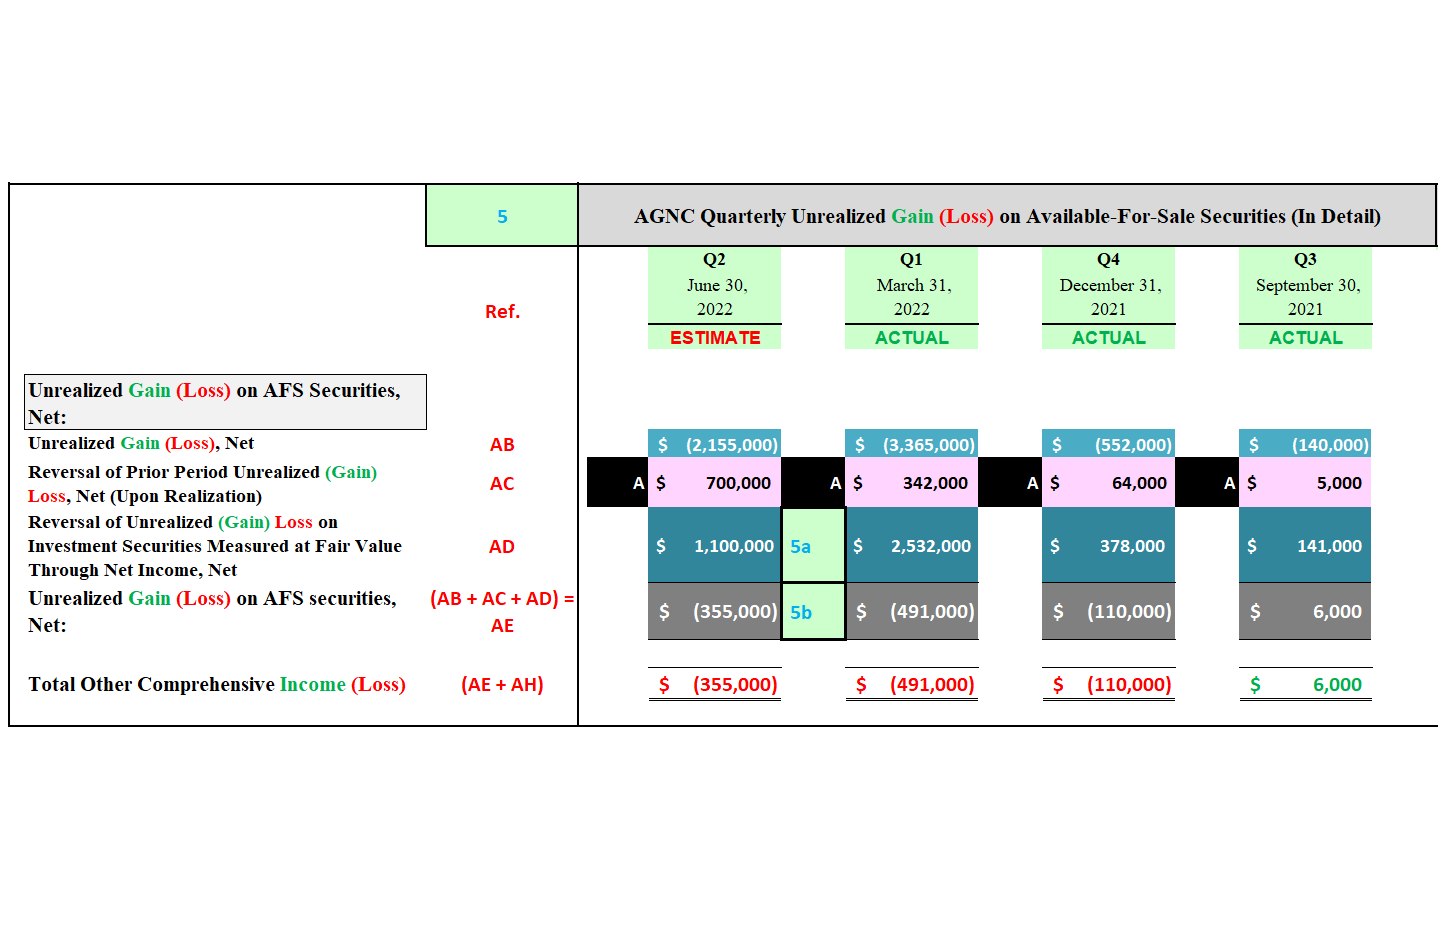
(Source: Table created by me, partially using AGNC data obtained from the SEC’s EDGAR Database)
Table 9 above shows AGNC’s projected total net valuation loss of ($2.16) billion on the company’s MBS/investment portfolio (see red reference “AB”). This amount is highlighted in teal. The second amount shown is AGNC’s projected “reversal of prior period unrealized (“gain”) loss, net, (upon realization)” figure (see red reference “AC”). This amount is highlighted in pink. The third amount shown is AGNC’s projected “reversal of unrealized (“gain”) loss on investment securities measured at FMV through net income, net” figure (see red reference “AD”). This amount is highlighted in dark teal.
After AGNC’s projected net realized loss on the sale of investment securities of $700 million and net unrealized loss on investment securities measured at FMV through net income of $1.10 billion are reversed out, the company’s total net unrealized loss on AFS securities is projected to be ($355) million for the second quarter of 2022 (see red reference “(AB + AC + AD) = AE”). This amount is highlighted in grey.
B) Other Comprehensive Income (Loss) (OCI/(OCL)):
- Estimate of ($355) Million; Range ($555) – ($155) Million
- Confidence Within Range = Moderate to High
- See Red Reference “B” in Table 10 Below Next to the June 30, 2022 Column
Let us now take a look at AGNC’s projected OCI/(OCL) and comprehensive income (loss) amounts. This information is provided in Table 10 below.
Table 10 – AGNC Quarterly OCI/(OCL) and Comprehensive Income (Loss) Projection
The REIT Forum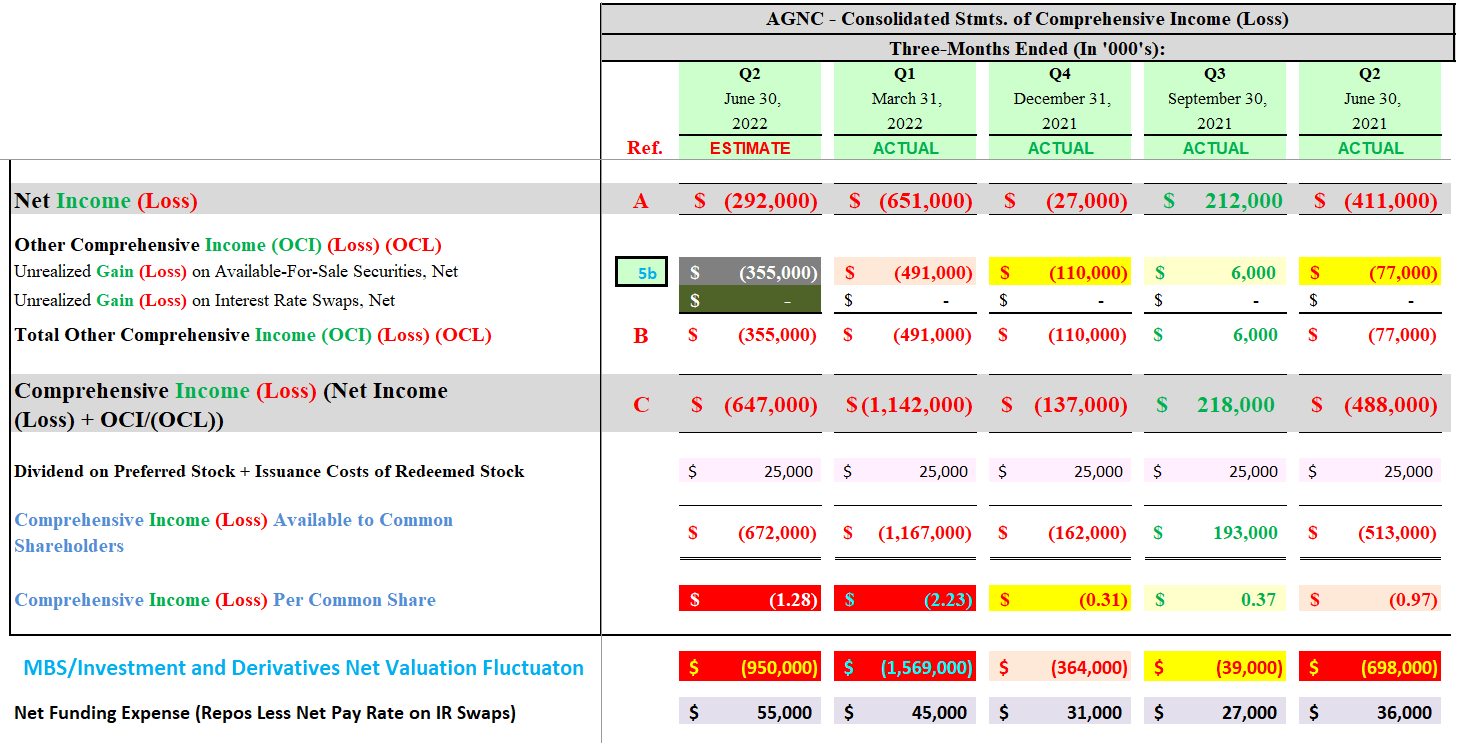
(Source: Table created by me, partially using data obtained from AGNC’s quarterly investor presentation slides)
After combining the company’s net unrealized loss on AFS securities of ($355) million and its net unrealized gain on interest rate swaps designated as cash flow hedges of $0 (AGNC no longer classifies the company’s hedges this way), I am projecting AGNC will report an OCL of ($355) million for the second quarter of 2022 (see red reference “B” in Table 10 above).
C) Comprehensive Income (Loss):
- Estimate of ($647) Million; Range ($897) – ($397) Million
- Comprehensive Loss Available to Common Shareholders of ($1.28) Per Share; Range ($1.76) – ($0.81) Per Share
- Confidence Within Range = Moderate to High
- See Red Reference “C” in Table 10 Above Next to the June 30, 2022 Column
Conclusions Drawn From PART 1 and PART 2:
To sum up the analysis from both parts of the article, I am projecting AGNC will report the following amounts for the second quarter of 2022:
A) Quarterly Net Loss of ($292) Million; Earnings Available to Common Shareholders of ($0.61) Per Share
B) Quarterly OCL of ($355) Million
C) Quarterly Comprehensive Loss (A and B Combined) of ($647) Billion; Comprehensive Loss Available to Common Shareholders of ($1.28) Per Share
I believe AGNC’s results for the second quarter of 2022, in regards to valuation fluctuations, will be taken as neutral-slightly negative from “experienced” market participants and very negative from “novice” market participants. The key factors to analyze within the broader mREIT sector this quarter are the following: 1) each company’s proportion of 15-year fixed-rate agency MBS holdings versus 30-year fixed-rate agency MBS holdings; 2) each company’s hedging coverage ratio; 3) each company’s proportion of long-term derivative instruments versus short-term derivative instruments; 4) each company’s “at-risk” leverage ratio; 5) each company’s proportion of specified pools (for instance HARP and LLB securities); 6) each company’s managerial expertise; 7) each company’s underlying asset composition regarding agency versus non-agency/credit investments; and 8) amount of portfolio rotation into higher coupon investments. Dependent upon these factors, I believe results will modestly-notably vary across the broader mREIT sector for the second quarter of 2022.
AGNC’s Projected BV as of 6/30/2022 and 7/15/2022:
When including the figures derived from this two-part AGNC income statement projection article, along with additional figures/assumptions derived within the company’s equity section of its balance sheet, I am projecting the following book value (“BV”) per common share figures as of 6/30/2022:
AGNC’s Projected Non-Tangible BV as of 6/30/2022 = $12.40 Per Common Share (Range $11.95 – $12.85 Per Common Share)
AGNC’s Projected Tangible BV as of 6/30/2022 = $11.40 Per Common Share (Range $10.95 – $11.85 Per Common Share)
When calculated, this is a projected quarterly non-tangible and tangible BV decrease of ($1.73) and ($1.72) per common share, respectively. This calculates to a quarterly BV decrease of (12.2%) and (13.1%), respectively. I am also projecting AGNC generated a non-tangible and tangible “economic loss” (dividends accrued for/declared and net change in BV) of (9.7%) and (10.4%) for the second quarter of 2022, respectively.
Through a detailed analysis that will be omitted from this particular article, I am projecting AGNC’s BV as of 7/15/2022 has fluctuated $0.00 – $0.50 per common share when compared to the company’s BV as of 6/30/2022. This projection excludes AGNC’s July 2022 monthly dividend of $0.12 per common share (ex-dividend is 7/28/2022).
My BUY, SELL, or HOLD Recommendation:
From the analysis provided above, including additional catalysts/factors not discussed within this particular article, I currently rate AGNC as a SELL when I believe the company’s stock price is trading at or greater than my projected non-tangible CURRENT BV (BV as of 7/15/2022), a HOLD when trading at less than my projected non-tangible CURRENT BV through less than a (10%) discount to my projected non-tangible CURRENT BV, and a BUY when trading at or greater than a (10%) discount to my projected non-tangible CURRENT BV. These ranges are unchanged when compared to my last AGNC article (PART 1 of this analysis).
AGNC’s stock price closed at $12.22 on 7/21/2022.
Therefore, I currently rate AGNC as a HOLD.
As such, I currently believe AGNC is appropriately valued from a stock price perspective. My current price target for AGNC is approximately $12.65 per share. This is currently the price where my recommendation would change to a SELL. The current price where my recommendation would change to a BUY is approximately $11.40 per share. Put another way, the following are my CURRENT BUY, SELL, or HOLD per share recommendation ranges (the REIT Forum subscribers get this type of data on all 20 mREIT stocks I currently cover on a weekly basis):
$12.65 per share or above = SELL
$11.41 – $12.64 per share = HOLD
$10.11 – $11.40 per share = BUY
$10.10 per share or below = STRONG BUY
Along with the data presented within this article, this recommendation considers the following mREIT catalysts/factors: 1) projected future MBS/investment price movements; 2) projected future derivative valuations; and 3) projected near-term (up to 1-year) dividend per share rates. These recommendations also consider the 8 Federal (“Fed”) Funds Rate increases by the FOMC during December 2016-2018 (a more hawkish tone/rhetoric when compared to 2014-2016), the three Fed Funds Rate decreases during 2019 due to the more dovish tone/rhetoric regarding overall monetary policy as a result of recent macroeconomic trends/events, and the very quick “plunge” in the Fed Funds Rate to near 0% in March 2020. This also considers the previous wind-down/decrease of the Fed Reserve’s balance sheet through gradual runoff/partial non-reinvestment (which began in October 2017 which increased spread/basis risk) and the prior “easing” of this wind-down that started in May 2019 regarding U.S. Treasuries and August 2019 regarding agency MBS (which partially reduced spread/basis risk when volatility remained subdued). This also considers the early Spring 2020 announcement of the start of another round of quantitative easing (“QE”) that includes the Fed specifically purchasing agency MBS (and “rolling over” all principal and interest payments into new agency MBS) which bolstered prices while keeping long-term/mortgage interest rates near historical lows (which lowered spread/basis risk for quite some time when volatility remained subdued). This also includes the recent “taper” of the Fed’s most recent QE program regarding its monthly purchases of $80 billion of U.S. Treasury securities and $40 billion of agency MBS. This taper began in November 2021 and market speculation around this future event has already caused a rise in spread/basis risk during the summer of 2021 and during the second half of the fourth quarter of 2021-June 2022 (as correctly previously anticipated). This includes the FOMC’s recent accelerated taper timeline (which finished in March 2022 versus the prior anticipated timeline of June 2022) and the continued very likely quick rise in the Fed Funds Rate to 2.50%-3.25% by the end of 2022 which began back in March 2022. I believe spread/basis risk should begin to abate by the end of summer 2022.
Current Sector/Recent NLY/AGNC Stock Disclosures:
On 3/18/2020, I initiated a position in NLY at a weighted average purchase price of $5.05 per share (large purchase). This weighted average per share price excluded all dividends received/reinvested. On 6/9/2021, I sold my entire NLY position at a weighted average sales price of $9.574 per share as my price target, at the time, of $9.55 per share was surpassed. This calculates to a weighted average realized gain and total return of 89.6% and 112.0%, respectively. I held this position for approximately 15 months.
On 3/18/2020, I once again initiated a position in AGNC at a weighted average purchase price of $7.115 per share (large purchase). This weighted average per share price excludes all dividends received/reinvested. On 6/2/2021, I sold my entire AGNC position at a weighted average sales price of $18.692 per share as my price target, at the time, of $18.65 per share was surpassed. This calculates to a weighted average realized gain and total return of 162.7% and 188.6%, respectively. I held this position for approximately 14.5 months.
On 1/31/2017, I initiated a position in New Residential Investment Corp. (NRZ) at a weighted average purchase price of $15.10 per share. On 6/29/2017, 7/7/2017, and 12/21/2018, I increased my position in NRZ at a weighted average purchase price of $15.775, $15.18, and $14.475 per share, respectively. When combined, my NRZ position had a weighted average purchase price of $14.912 per share. This weighted average per share price excluded all dividends received/reinvested. On 2/6/2020, I sold my entire NRZ position at a weighted average sales price of $17.555 per share as my price target, at the time, of $17.50 per share was surpassed. This calculates to a weighted average realized gain and total return of 17.7% and 41.2%, respectively. I held this position, on a weighted average basis, for approximately 20 months.
On 9/22/2020, I once again initiated a position in NRZ at a weighted average purchase price of $7.645 per share. On 1/28/2021, 7/16/2021, 8/20/2021, 4/7/2022, 6/13/2022, 6/14/2022, and 6/17/2022, I increased my position in NRZ at a weighted average purchase price of $9.415, $9.525, $9.485, $10.11, $9.345, $9.055, and $8.421 per share, respectively. When combined, my NRZ position has a weighted average purchase price of $8.977 per share. This weighted average per share price excludes all dividends received/reinvested.
On 1/2/2020, I initiated a position in Arlington Asset Investment Corp. (AAIC) at a weighted average purchase price of $5.57 per share. On 1/9/2020, 3/16/2020, 9/24/2020, 5/6/2021, 9/2/2021, 9/10/2021, 11/10/2021, 11/24/2021, and 3/3/2022, I increased my position in AI at a weighted average purchase price of $5.59, $3.25, $2.53, $3.875, $3.748, $3.75, $3.752, $3.70, and $3.395 per share, respectively. When combined, my AAIC position has a weighted average purchase price of $3.456 per share. This weighted average per share price excludes all dividends received/reinvested.
On 10/19/2020, I initiated a position in PennyMac Mortgage Investment Trust (PMT) at a weighted average purchase price of $16.275 per share. On 10/29/2020, 8/12/2021, 8/20/2021, 11/18/2021, 2/4/2022, and 4/19/2022, I increased my position in PMT at a weighted average purchase price of $14.90, $18.693, $18.407, $18.180, $16.024, and $14.721 per common share, respectively. When combined, my PMT position has a weighted average purchase price of $15.857 per share. This weighted average per share price excludes all dividends received/reinvested.
On 12/1/2020, I initiated a position in DX at a weighted average purchase price of $16.59 per share. On 12/20/2021, I increased my position in DX at a weighted average purchase price of $15.35 per share. When combined, my DX position has a weighted average purchase price of $15.66 per share. This weighted average per share price excludes all dividends received/reinvested.
On 10/12/2018, I initiated a position in Granite Point Mortgage Trust, Inc. (GPMT) at a weighted average purchase price of $18.155 per share. On 5/12/2020, 5/27/2020, 5/28/2020, 8/26/2020, 9/10/2020, and 9/11/2020, I increased my position in GPMT at a weighted average purchase price of $4.745, $5.144, $5.086, $6.70, $6.19, and $6.045 per share, respectively. My last two purchases made up approximately 50% of my total position (to put things in better perspective). When combined, my GPMT position had a weighted average purchase price of $6.234 per share. This weighted average per share price excluded all dividends received/reinvested. On 6/8/2021, I sold my entire GPMT position at a weighted average sales price of $15.783 per share as my price target, at the time, of $15.75 per share was surpassed. This calculates to a weighted average realized gain and total return of 153.2% and 168.7%, respectively. I held this position, on a weighted average basis, for approximately 11 months.
On 12/10/2021, I once again initiated a position in GPMT at a weighted average purchase price of $11.817 per share. On 12/15/2021, 4/19/2022, and 4/29/2022, I increased my position in GPMT at a weighted average purchase price of $11.318, $9.998, and $9.69 per share, respectively. When combined, my GPMT position has a weighted average purchase price of $10.613 per share. This weighted average per share price excludes all dividends received/reinvested.
On 1/24/2022, I initiated a position in Ready Capital Corp. (RC) at a weighted average purchase price of $13.39 per share. On 6/29/2022, I increased my position in RC at a weighted average purchase price of $11.69 per share. When combined, my RC position has a weighted average purchase price of $12.257 per share. This weighted average per share price excludes all dividends received/reinvested.
Final Note: All trades/investments I have performed over the past several years have been disclosed to readers in “real time” (that day at the latest) via either the StockTalks feature of Seeking Alpha or, more recently, the “live chat” feature of the Marketplace Service the REIT Forum (which cannot be changed/altered). Through these resources, readers can look up all my prior disclosures (buys/sells) regarding all companies I cover here at Seeking Alpha (see my profile page for a list of all stocks covered). Through StockTalk disclosures and/or the live chat feature of the REIT Forum, at the end of June 2022 I had an unrealized/realized gain “success rate” of 83.9% and a total return (includes dividends received) success rate of 90.3% out of 62 total past and present mREIT and business development company (“BDC”) positions (updated monthly; multiple purchases/sales in one stock count as one overall position until fully closed out). I encourage other Seeking Alpha contributors to provide real time buy and sell updates for their readers/subscribers which would ultimately lead to greater transparency/credibility. Starting in January 2020, I have transitioned all my real-time purchase and sale disclosures solely to members of the REIT Forum. All applicable public articles will still have my purchase and sale disclosures (just not in real time). Please disregard any minor “cosmetic” typos if/when applicable.
Table 11 – The REIT Forum NLY + AGNC Seeking Alpha Recommendations (November 2019 – July 2022 Timeframe)
Seeking Alpha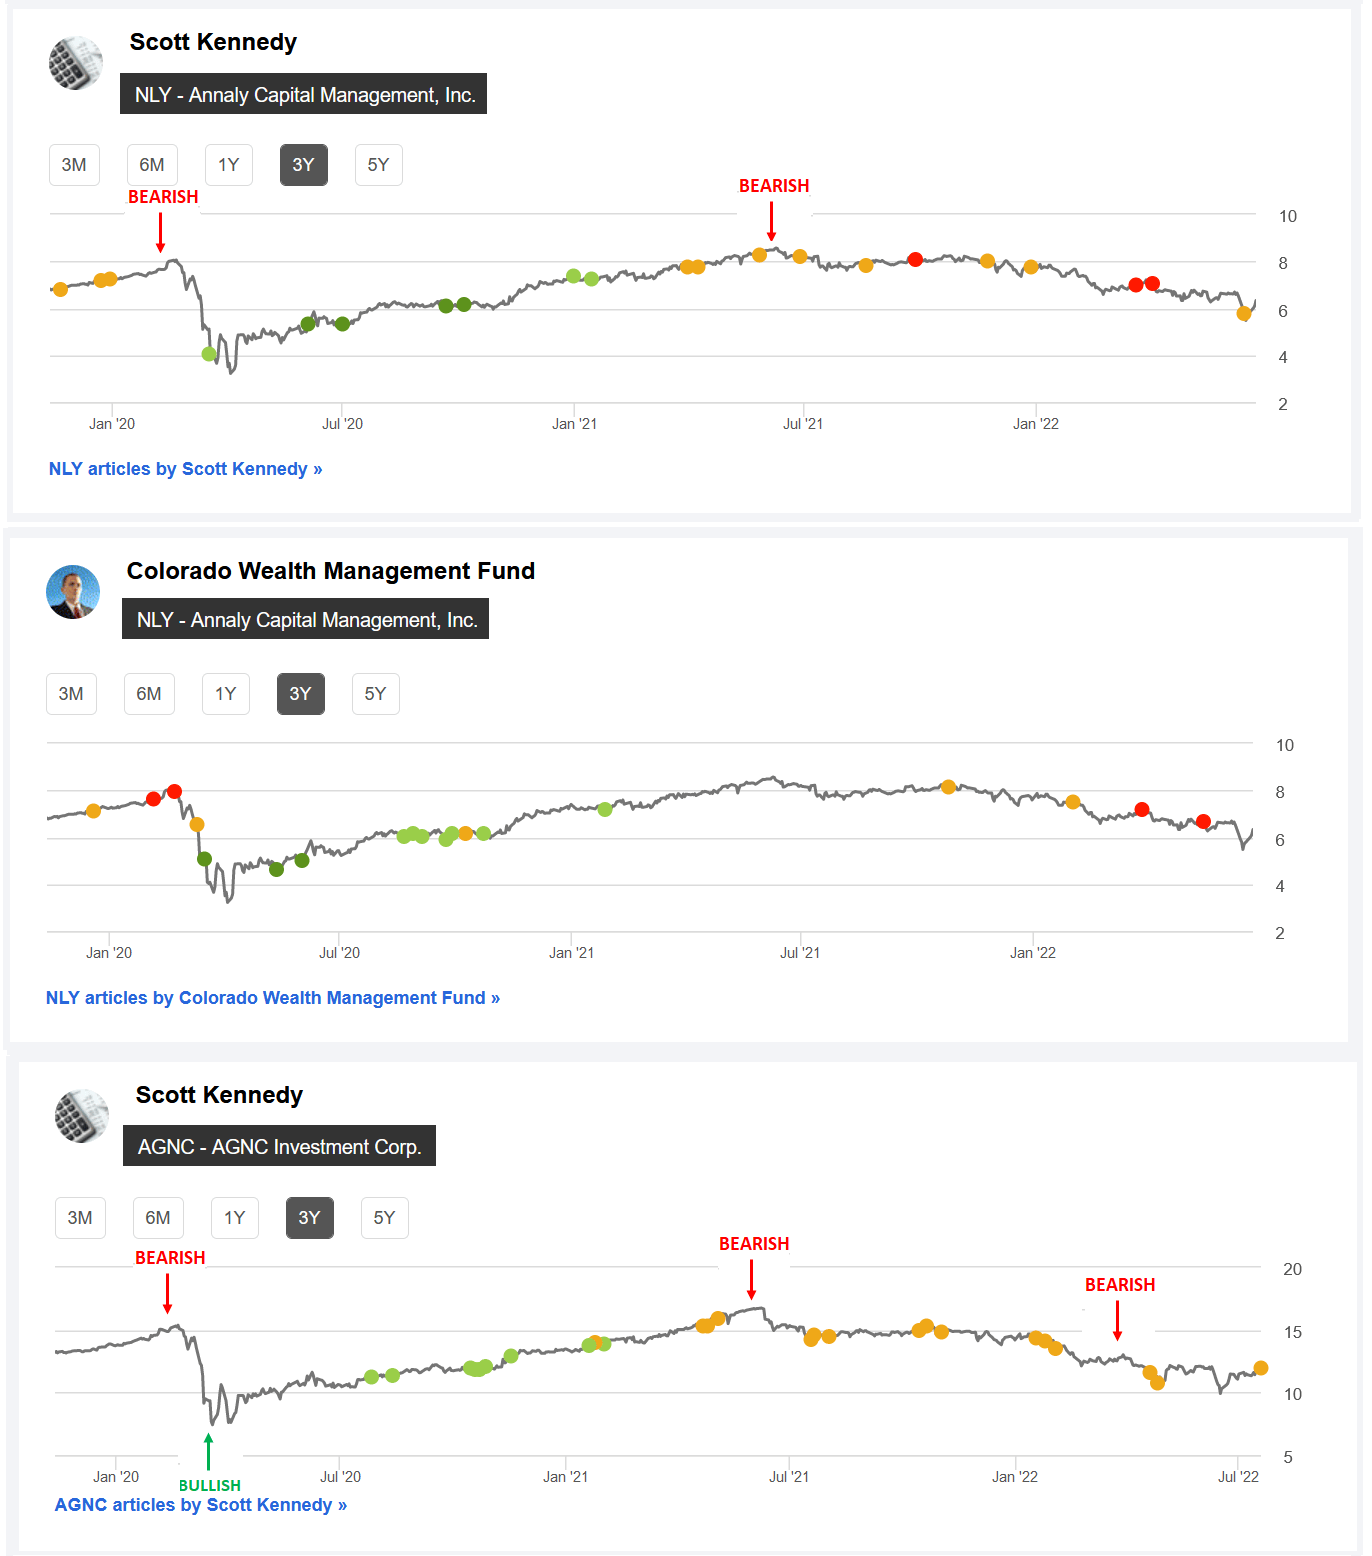
(Source: Table directly from Seeking Alpha; 1st AGNC “Bearish” indicator included by me directly from the public AGNC article dated 2/5/2020 recommendation [which can’t be changed once public], AGNC “Bullish” indicator included by me directly from the public AGNC article dated 4/17/2020 recommendation [which can’t be changed once public], 2nd AGNC and 1st NLY “Bearish” indicator included by me directly from the REIT Forum’s weekly subscriber recommendation article series [week of 6/4/2021 for AGNC and week of 6/11/2021 for NLY], and 3rd AGNC “Bearish” indicator included by me directly from the REIT Forum’s weekly subscriber recommendation article series [week of 4/8/2022])
Lastly, I just want to quickly highlight my/our AGNC and NLY Seeking Alpha recommendation ranges over the past several years. In my personal opinion, a stock with a BUY recommendation should increase in price over time, a SELL recommendation should decrease in price over time, and a HOLD recommendation should remain relatively unchanged in price over time (pretty logical). Simply put, my/our “valuation methodology” has correctly timed when both AGNC and NLY have been undervalued (a BUY recommendation; bullish), overvalued (a SELL recommendation; bearish), and appropriately valued (a HOLD recommendation; neutral).
Using Table 11 above as a reference, I believe we have done a pretty good job in my/our AGNC and NLY recommendation ratings. For NLY, both pricing charts should really be viewed as 1 combined chart since CO and I are part of the same Marketplace service team. Not only do I/we want to provide guidance/a recommendation that enhances total returns for subscribers, I/we also want to protect these generated returns by subsequently minimizing total losses. I personally believe this methodology/strategy is very important. In other words, correctly spotting both positive catalysts/trends and negative factors/trends as economic and interest rate cycles fluctuate.
This methodology/strategy was extremely useful/accurate when going back to very late 2019 and early 2020 (both pre-COVID-19) where I/we had a SELL recommendation on both AGNC and NLY. For some reason, this S.A. pricing chart does not show my AGNC SELL recommendation pre-COVID-19 but one can simply look back to past public articles in early 2020 (just an omission on S.A.’s end in this particular case). As an alternative, simply look at the NLY SELL recommendation highlighted in CO’s pricing chart (AGNC and NLY typically have very similar recommendation ranges when considering similar time periods). Furthermore, after the initial “pandemic panic”, I/we had a STRONG BUY recommendation on both AGNC and NLY later in the spring of 2020.
Simply put, a contributor’s/team’s recommendation track record should “count for something” and should always be considered when it comes to credibility/successful investing. You will not see most (if not all) other contributor teams use this type of factual, recommendation-driven price chart because the results are not nearly as “attractive” when compared to our own.
Each investor’s BUY, SELL, or HOLD decision is based on one’s risk tolerance, time horizon, and dividend income goals. My personal recommendation will not fit each reader’s current investing strategy. The factual information provided within this article is intended to help assist readers when it comes to investing strategies/decisions.
Understanding My/Our Valuation Methodology Regarding mREIT Common and BDC Stocks:
The basic “premise” around my/our recommendations in the mREIT common and BDC sectors is value. Regarding operational performance over the long-term, there are above average, average, and below average mREIT and BDC stocks. That said, better-performing mREIT and BDC peers can be expensive to own, as well as being cheap. Just because a well-performing stock outperforms the company’s sector peers over the long-term, this does not mean this stock should be owned at any price. As with any stock, there is a price range where the valuation is cheap, a price where the valuation is expensive, and a price where the valuation is appropriate. The same holds true with all mREIT common and BDC peers. As such, regarding my/our investing methodology, each mREIT common and BDC peer has their own unique BUY, SELL, or HOLD recommendation range (relative to estimated CURRENT BV/NAV). The better-performing mREITs and BDCs typically have a recommendation range at a premium to BV/NAV (varying percentages based on overall outperformance) and vice versa with the average/underperforming mREITs and BDCs (typically at a discount to estimated CURRENT BV/NAV).
Each company’s recommendation range is “pegged” to estimated CURRENT BV/NAV because this way subscribers/readers can track when each mREIT and BDC peer moves within the assigned recommendation ranges (daily if desired). That said, the underlying reasoning why I/we place each mREIT and BDC recommendation range at a different premium or (discount) to estimated CURRENT BV/NAV is based on roughly 15-20 catalysts which include both macroeconomic catalysts/factors and company-specific catalysts/factors (both positive and negative). This investing strategy is not for all market participants. For instance, not likely a “good fit” for extremely passive investors. For example, investors holding a position in a particular stock, no matter the price, for say a period of 5+ years. However, as shown throughout my articles written here at Seeking Alpha since 2013, in the vast majority of instances I have been able to enhance my personal total returns and/or minimize my personal total losses from specifically implementing this particular investing valuation methodology. I hope this provides some added clarity/understanding for new subscribers/readers regarding my valuation methodology utilized in the mREIT common and BDC sectors. Please disregard any minor “cosmetic” typos if/when applicable.
Be the first to comment