


MarianVejcik/iStock via Getty Images
Author’s Note: This two-part article is a very detailed analysis of AGNC Investment Corp.’s (NASDAQ:AGNC) income statement (technically speaking, the company’s “consolidated statement of comprehensive income (loss)”). I continue to perform this type of detailed quarterly analysis for readers who want to fully understand AGNC’s ever-changing mortgage-backed securities (“MBS”)/investment portfolio and risk management strategies. The accounts/topics discussed within this series of articles are also valuable for any investor that has an interest within the fixed-rate agency and broader mortgage real estate investment trust (mREIT) sector. For readers who just want the summarized account projections, I would suggest to scroll down to the “Conclusions Drawn” section near the bottom of each part of the article.
Focus of Article:
The focus of this article is to provide a detailed projection of AGNC’s comprehensive income for the first quarter of 2022. Prior to results being provided to the public on 5/2/2022 (via the company’s quarterly press release), I would like to analyze AGNC’s consolidated statement of comprehensive income (loss) and provide readers a general direction on how I believe this recent quarter has panned out. I believe this quarter has a heightened level of importance to readers due to the recent events surrounding the Federal Open Market Committee’s (“FOMC”) decision regarding monetary policy and certain global macroeconomic events which impacted the yield curve and the overall market “across the board.”
Specifically, there was heightened importance regarding the FOMC’s decision regarding the Federal (“FED”) Funds Rate and movements within the London Interbank Offered Rate (LIBOR). This includes the fairly recent general flattening of the yield curve and fairly recent notable rise in spread/basis risk. In the case of AGNC (and agency mREIT companies as a whole), spread/basis risk is simply the relationship of valuation fluctuations of certain investments (namely agency MBS) in relation to valuation fluctuations of derivative instruments/hedges (namely interest rate payer swaps, payer swaptions, and (short) U.S. Treasury securities). Due to the length of the material covered, I believe it is necessary to break this projection article into two parts.
Side Note: Predicting a company’s accounting figures within the mREIT sector is usually more difficult when compared to other sectors due to the various hedging and asset portfolio strategies that are implemented by management each quarter. As such, there are multiple assumptions used when performing such an analysis. AGNC’s actual reported values may differ materially from my projected values within this article due to unforeseen circumstances (even if this has been a rare occurrence since I began covering AGNC eight years ago). Such variances could occur because management deviates from a company’s prior business strategy and pursues a new strategy that was not previously disclosed or anticipated. Another notable variance could occur due to differences of opinion regarding certain lifetime prepayment forecasts which have a high degree of “managerial judgment.” Readers should be aware of these possibilities. All projections within this article are my personal estimates and should not solely be used for any investor’s buying or selling decisions. All actual reported figures that are above the mean of my account projections will be deemed an “outperformance” in my judgment. All actual reported figures that are below the mean of my account projections will be deemed an “underperformance” in my judgment. Unless otherwise noted, all figures below are for the “three-months ended” (quarterly) timeframe.
By understanding the trends that occurred within AGNC’s operations during the first quarter of 2022, one can apply this information to sector peers as well (at the least for comparative purposes). As such, the discussion/analysis below is not solely applicable to AGNC but to the fixed-rate agency mortgage real estate investment trust (mREIT) sector as a whole. This includes, but is not limited to, the following fixed-rate agency mREIT peers: 1) Arlington Asset Investment Corp. (AAIC); 2) ARMOUR Residential REIT Inc. (ARR); 3) Cherry Hill Mortgage Investment Corp. (CHMI); 4) Dynex Capital Inc. (DX); 5) Invesco Mortgage Capital Inc. (IVR); 6) Annaly Capital Management Inc. (NLY); 7) Orchid Island Capital Inc. (ORC); and 8) Two Harbors Investment Corp. (TWO).
Consolidated Statement of Comprehensive Income (Loss) Overview:
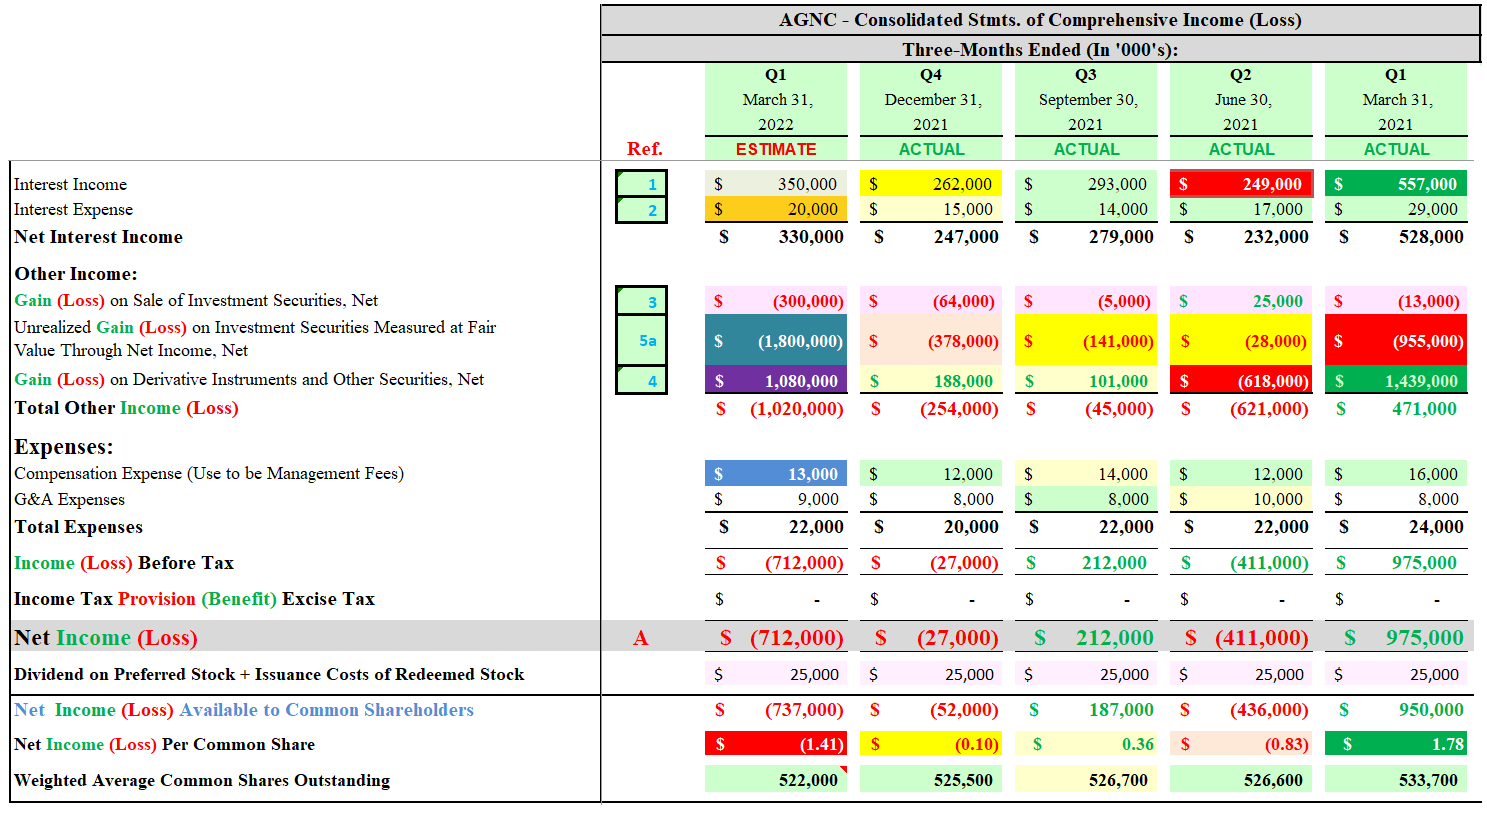
Using Table 1 below as a reference, let us first look at AGNC’s quarterly consolidated statement of comprehensive income (loss) for the first quarter of 2022 (ESTIMATE column). Table 1 also provides AGNC’s comprehensive income (loss) for the prior four quarters (ACTUAL columns) for comparative purposes.
Table 1 – AGNC Quarterly Consolidated Statements of Comprehensive Income (Loss)
The REIT Forum
(Source: Table created by me, partially using data obtained from AGNC’s quarterly investor presentation slides)
Table 1 above is the main source of summarized data regarding AGNC’s net income (loss) amount. As such, all material accounts within Table 1 will be separately analyzed and discussed in corresponding order to the boxed blue reference next to the March 31, 2022 column. PART 1 of this article will include an analysis of the following accounts: 1) interest income; 2) interest expense; 3) gain (loss) on sale of investment securities, net; and 4) gain (loss) on derivative instruments and other securities, net (including several “sub-accounts”).
1) Interest Income:
- Estimate of $350 Million; Range $250 – $450 Million
- Confidence Within Range = Moderate-High
- See Boxed Blue Reference “1” in Table 1 Above and Table 2 Below Next to the March 31, 2022 Column
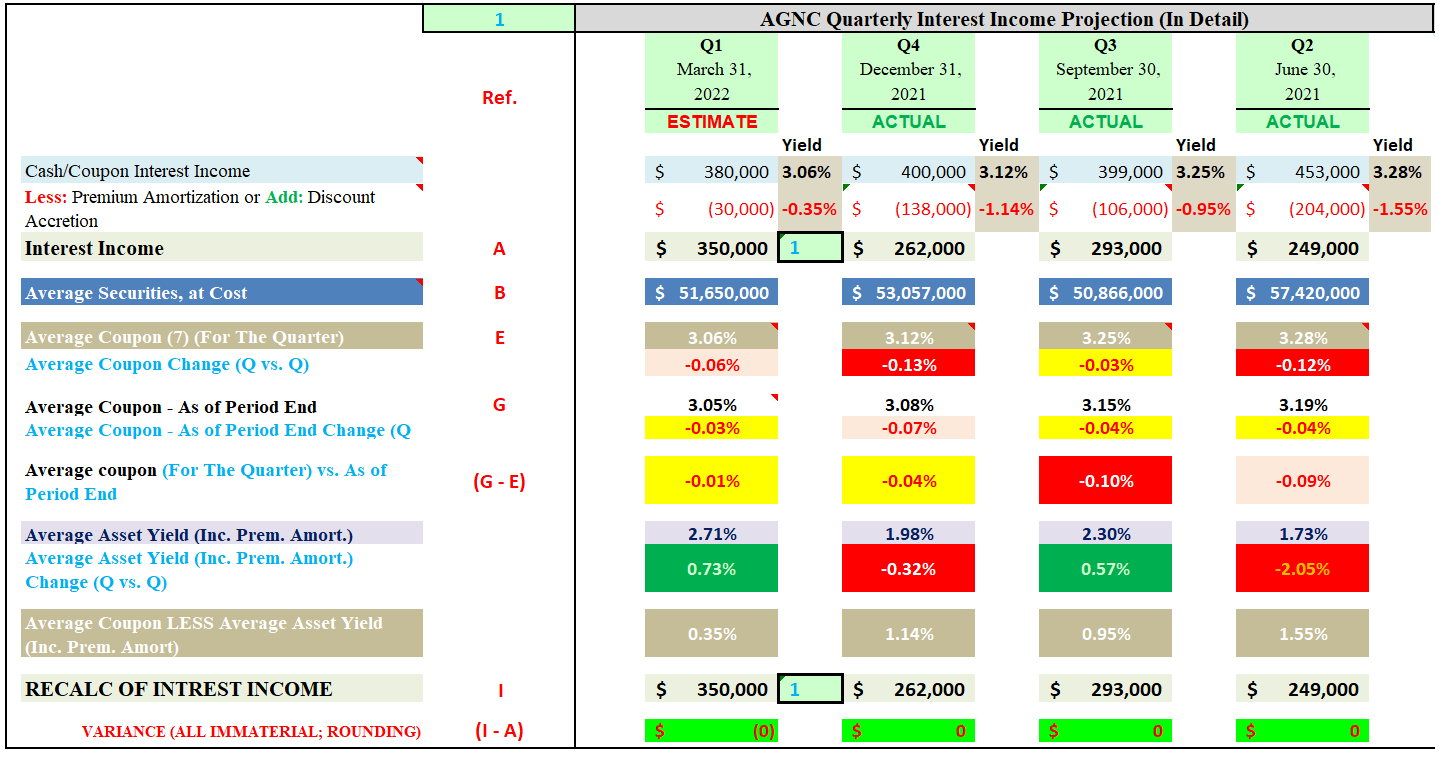
AGNC’s interest income is comprised of the following two sub-accounts: a) cash interest income; and b) premium amortization, net. I show my projection for these two figures in Table 2 below. There will not be an identical sheet AGNC provides that matches the data I have prepared in Table 2 below.
Table 2 – AGNC Quarterly Interest Income Projection
The REIT Forum
(Source: Table created by me, partially using AGNC data obtained from the SEC’s EDGAR Database)
The first component of AGNC’s interest income is the company’s cash interest income sub-account. Two assumptions should be noted within Table 2 above when projecting AGNC’s cash interest income for the first quarter of 2022. First, I am projecting AGNC’s “average securities, at cost” balance decreased by ($1.4) billion for the first quarter of 2022 when compared to the prior quarter ($51.7 billion versus $53.1 billion). I would consider this a minor decrease. This would continue to be modestly below AGNC’s on-balance sheet MBS portfolio balance prior to the market’s COVID-19 “pandemic panic.” Nearly all of the 20 mREIT sector peers I currently cover experienced either margin calls from debt counterparties or voluntarily reduced leverage in order to raise cash/liquidity in early 2020.
Most mREIT peers have yet to fully increase each company’s investment portfolio size to pre-COVID-19 levels. During the first quarter of 2020, AGNC reduced the company’s investment portfolio by approximately (25%) based on fair market value (“FMV”). This was a less severe decline when compared to an average net decrease of (40%) for the eight agency mREIT peers I currently cover (excluding IVR who “switched” to a fixed-rate agency mREIT post March 2020). For AGNC, this should actually be seen as a positive catalyst/trend (a less severe decline directly results in more net spread income being generated). In this instance, AGNC’s historically higher cash position benefited this particular fixed-rate agency mREIT peer. Partially offsetting this decline, AGNC increased the company’s net long “to-be-announced” (“TBA”) MBS position during the first quarter of 2020 (which likely remained somewhat elevated through the majority of the first quarter of 2022) which is an off-balance sheet means of investing in and financing generic agency MBS. That said, I’m projecting AGNC’s off-balance sheet net long TBA MBS position had a large proportionate decrease by quarter end (discussed later in the article).
Second, I’m projecting a minor decrease to AGNC’s “weighted average coupon” (“WAC”) for the first quarter of 2022 when compared to the prior quarter (3.06% versus 3.12%). This projection factors in AGNC’s TBA MBS position, portfolio reinvestment, proportion of 15-year fixed-rate agency MBS versus 30-year, and the net movement of mortgage interest rates during the quarter. While mortgage interest rates/U.S. Treasury yields moved notably higher during the first quarter of 2022, I believe AGNC hung on to a majority of the company’s existing on-balance sheet MBS while not deploying much new capital into higher coupons. Still using Table 2 above as a reference, when combining the two factors discussed above, I’m projecting a cash interest income decrease of ($20) million for the first quarter of 2022 when compared to the prior quarter ($380 million vs. $400 million).
The second component of AGNC’s interest income is the company’s premium amortization, net sub-account. During a rising interest rate environment, generally a decrease in prepayments will occur because a lower number of homeowners have mortgages that have a higher interest rate when compared to current market interest rates. As such, the attractiveness of a mortgage refinance decreases. As a result, prepayment risk generally decreases while extension risk increases. Therefore, the average life of AGNC’s fixed-rate agency MBS portfolio generally lengthens. This would directly lead to a lower quarterly premium amortization expense. The exact opposite generally occurs during a falling interest rate environment. In addition, seasonality trends should also be considered when analyzing/projecting this account.
MBS pricing will be discussed in PART 2 of this article while U.S. Treasury yields/pricing will be discussed later in PART 1 (within the derivatives account). Mortgage interest rates/long-term U.S. Treasury yields typically have a similar, direct relationship. Through research, I have determined a majority of AGNC’s MBS holdings experienced a minor decrease in “conditional prepayment rate” (“CPR”) percentages during the quarter. This includes considering intra-quarterly strategies executed by management (higher coupon specified pool MBS and lower coupon generic MBS).
I believe the company’s “lifetime” CPR as of 3/31/2022 will modestly decrease from its 12/31/2021 level. As such, I’m projecting a modest adjustment to occur. Using Table 2 above as a reference, including the assumption of a slightly smaller average on-balance sheet MBS portfolio balance (minor positive factor), slightly lower weighted average purchase price (positive factor), a continued much greater proportion of 30-year fixed-rate agency MBS versus 15-year (positive factor), and a modest decrease in lifetime CPR percentage (positive factor), I’m projecting a premium amortization, net expense decrease of $108 million for the first quarter of 2022 when compared to the prior quarter (($30) million versus ($138) million).
When my projections for the cash interest income and premium amortization, net expense sub-accounts are combined, I am projecting AGNC’s interest income to increase by $88 million for the first quarter of 2022 when compared to the prior quarter ($350 million versus $262 million).
2) Interest Expense:
- Estimate of $20 Million; Skewed Range $10 – $40 Million
- Confidence Within Range = High
- See Boxed Blue Reference “2” in Table 1 Above and Table 3 Below Next to the March 31, 2022 Column
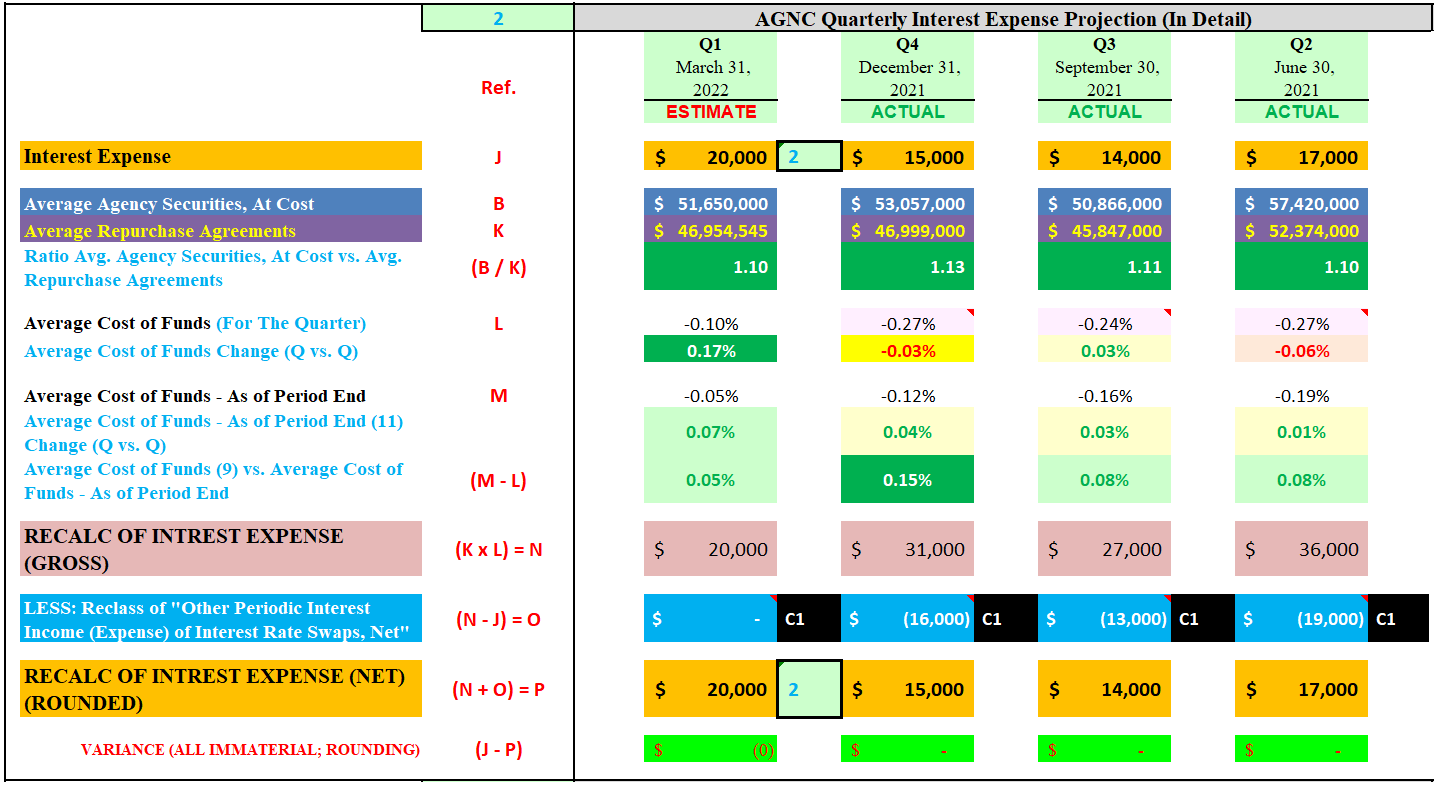
Now let us take a look at AGNC’s interest expense account. I show my projection for this figure in Table 3 below. I have gathered specific information derived from multiple tables/charts for a more detailed analysis of AGNC’s interest expense account.
Table 3 – AGNC Quarterly Interest Expense Projection
The REIT Forum
(Source: Table created by me, partially using AGNC data obtained from the SEC’s EDGAR Database [link provided below Table 2])
To project AGNC’s quarterly interest expense, one takes the quarterly average of the company’s outstanding repurchase agreements (see red reference “K”) and multiplies this amount by the quarterly average cost of funds rate (see red reference “L”). Once this figure is calculated, one needs to back out a portion of the quarterly interest income (expense) in relation to AGNC’s interest rate payer swaps. This reclassified amount is accounted for within AGNC’s gain (loss) on derivative instruments and other securities, net account. This account will be projected later in the article. The final calculated amount is AGNC’s quarterly interest expense figure (see red reference “P”). There’s also another methodology that can be performed to project AGNC’s interest expense account (including a reclassification amount). However, for purposes of this article, I will solely focus on the methodology shown in Table 3 above.
Two assumptions should be noted within Table 3 when projecting AGNC’s quarterly interest expense figure for the first quarter of 2022. First, let us calculate an appropriate quarterly “average repurchase agreements” balance. Based on an earlier calculated figure within AGNC’s interest income account (see Table 2 above), I’m projecting the company had a quarterly average securities at cost balance of $51.7 billion for the first quarter of 2022. If one takes this figure and divides it by the quarterly average of AGNC’s outstanding repurchase agreements balance, a calculated “ratio of average securities versus average repurchase agreements” is projected (red reference “B / K”). This ratio has been in a range of 1.10-1.13 during the prior four quarters. For the first quarter of 2022, I’m using a ratio of 1.10 (being a bit cautious with this ratio). When calculated, this balance is projected to be $47.0 billion (purple shading; yellow font). This is a projected decrease of less than $0.1 billion for the first quarter of 2022 when compared to the prior quarter ($47.0 billion vs. $47.0 billion).
Second, let us now obtain a suitable quarterly average cost of funds rate. I am projecting a decrease of (17) basis points (“bps”) regarding AGNC’s average cost of funds rate for the first quarter of 2022 when compared to the prior quarter (0.10% versus 0.27%). Simply put, this is mainly in relation to AGNC’s interest rate payer swaps. As mentioned earlier, all interest income (expense) in relation to AGNC’s interest rate payer swaps is reclassified out of this account. As such, a portion of the quarterly average cost of funds rate is not in relation to AGNC’s outstanding repurchase agreements. AGNC’s interest expense regarding the company’s outstanding repurchase agreements is based on a small fixed-rate percentage and a variable-rate percentage mainly based on LIBOR. During the first quarter of 2022, repurchase agreement interest rates had a fairly similar fluctuation when compared to current/“spot” U.S. LIBOR (increase toward the end of the quarter).
Now that we have determined AGNC’s average repurchase agreements balance and average cost of funds rate, let us calculate the company’s interest expense for the first quarter of 2022. Still using Table 3 above as a reference, after a projected reclassification of $0 million in relation to the net periodic interest income (expense) regarding AGNC’s interest rate swaps, I am projecting the company’s interest expense to increase $5 million for the first quarter of 2022 when compared to the prior quarter ($20 million versus $15 million).
3) Gain (Loss) on Sale of Investment Securities, Net:
- Estimate of ($300) Million; Range ($450) – ($150) Million
- Confidence Within Range = Moderate
- See Boxed Blue Reference “3” in Table 1 Above Next to the March 31, 2022 Column
AGNC’s gain (loss) on sale of investment securities, net account can be somewhat difficult to accurately project at times. Through detailed research and data compilation, one can project (to a reasonable degree) how management “should” act within any given quarter regarding purchases and sales. However, I stress beforehand this will not be an “exact science” each quarter. There will be some variances that occur in a quarter if more/less sales and/or purchases actually occur vs. originally projected. Additionally, unanticipated quarterly changes in the percentage of coupons/maturities held within the MBS portfolio would cause a slight deviation in asset valuations. At periodic intervals, management provides some clarity on the company’s intended strategy regarding investment sales when mortgage interest rates/long-term U.S. Treasury yields rise or fall. However, several assumptions still need to be made.
Therefore, this particular account is directly tied to AGNC’s “unrealized gain (loss) on investment securities measured at FMV through net income, net” and “unrealized gain (loss) on available-for-sale (“AFS”) securities, net” accounts that will be discussed in PART 2 of this article. If AGNC’s gain (loss) on sale of investment securities, net actual amount is above or below my projected figure/range, the variance is automatically offset in these two other accounts. As such, my combined projected figures would be accurately represented. This consideration has been proven correct in numerous prior quarters over the past 9+ years. In my professional opinion, these three accounts should really be looked at as one combined account. The unrealized gain (loss) on investment securities measured at FMV through net income, net and unrealized gain (loss) on AFS securities, net accounts have an immediate impact on BV while the gain (loss) on sale of investment securities, net account is merely a reclassification out of the unrealized accounts. Readers should understand this notion prior to this account’s analysis.
When compared to the prior quarter, I’m anticipating a larger amount of activity within this account during the first quarter of 2022. As such, I am projecting an “investment sold, at cost” amount of ($10.0) billion for the first quarter of 2022. The more important figure to discuss is not the amount of investment securities sold but whether a gain (loss) occurred from the quarterly sales. As of 9/30/2021, AGNC had an accumulated other comprehensive gain (“OCI”) balance of $411 million. This balance decreased to $301 million as of 12/31/2021. That said, MBS pricing notably decreased “across the board” during the first quarter of 2022 and that needs to be considered.
The total amount of AGNC’s net realized gain (loss) would be dependent on which particular investment securities were sold and at what time during the quarter these sales occurred. When taking all factors above into consideration, I’m projecting AGNC will report a net realized loss on the sale of investment securities of ($300) million for the first quarter of 2022.
4) Gain (Loss) on Derivative Instruments and Other Securities, Net:
- Estimate of $1.08 Billion; Range $880 Million – $1.28 Billion
- Confidence Within Range = Moderate
- See Boxed Blue Reference “4” in Tables 4 and 6 Below Next to the March 31, 2022 Column
Projecting AGNC’s gain (loss) on derivative instruments and other securities, net account is an analysis that involves several sub-accounts. This includes making assumptions within these derivative sub-accounts during the current quarter. One will never “fully” know management’s derivatives activities for any given quarter until results are provided to the public. However, one can understand AGNC’s overall risk management strategy and make a projection on these derivative sub-accounts using the balances that were represented at the end of the previous quarter. Such a detailed analysis is wise to perform due to the typical events that unfold in regards to MBS prices, the fixed pay rate on newly created/existing interest rate swaps, and U.S. Treasury yields. When using this methodology, along with deciding specific quarterly assumptions, I have typically provided accurate-highly accurate projections within this account over the past 9+ years, including over various cycles/scenarios.
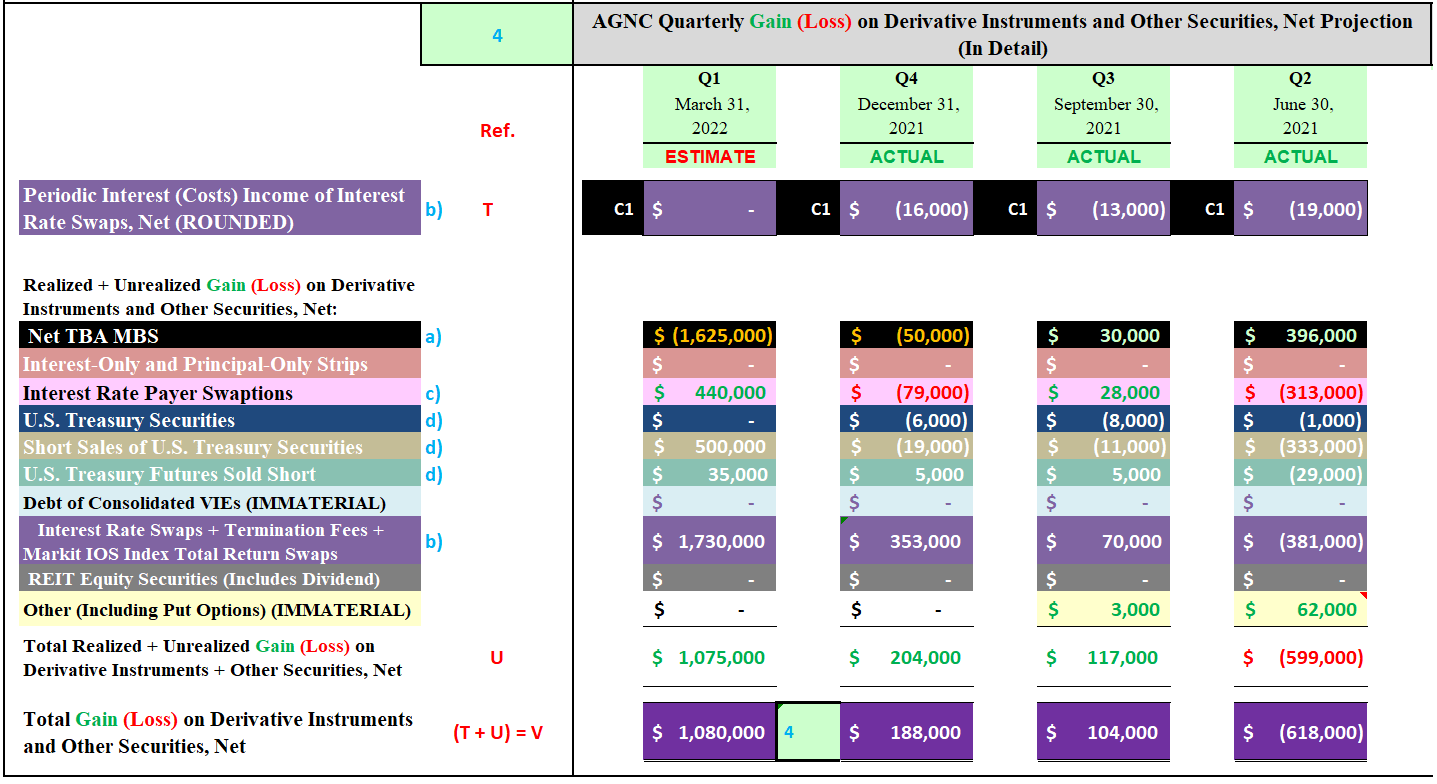
Now let us take a look at AGNC’s gain (loss) on derivative instruments and other securities, net account. I show my projection for this figure in Table 4 below. All projected (ESTIMATE) sub-account figures are calculated and derived from multiple tables/charts that will not be shown within this particular article.
Table 4 – AGNC Quarterly Gain (Loss) on Derivative Instruments and Other Securities, Net Projection (All Sub-Accounts)
The REIT Forum
(Source: Table created by me, partially using AGNC data obtained from the SEC’s EDGAR Database [link provided below Table 2])
Within AGNC’s gain (loss) on derivative instruments and other securities, net account is the following four material sub-accounts that will be discussed below: a) TBA MBS; b) interest rate swaps; c) interest rate swaptions; and d) U.S. Treasury securities. Each of the four material derivative sub-accounts will be separately analyzed and discussed in corresponding order of the blue references under the “Ref.” column in Table 4 above.
A) TBA MBS (Net Long Position as of 12/31/2021):
- Estimate of ($1.63) Billion; Range ($1.83) – ($1.43) Billion
- Confidence Within Range = Moderate
- See Black Highlighted, Blue Referenced Sub-Account “a)” in Table 4 Above Next to the March 31, 2022 Column
Let us first briefly get accustomed with this type of derivative instrument. Typically, AGNC uses a combination of both long and (short) TBA MBS contracts during any given quarter. AGNC enters into TBA contracts with a long position where it agrees to buy, for future delivery, MBS with certain predetermined prices, face amounts, issuers, coupons, and stated maturities. AGNC enters into TBA contracts with a long position as an off-balance sheet means of investing in and financing MBS. Since TBA contracts with a long position are ultimately an extension of the balance sheet, this increases AGNC’s “at risk” leverage. AGNC enters into TBA contracts with a (short) position where it agrees to sell, for future delivery, MBS with certain predetermined prices, face amounts, issuers, coupons, and stated maturities. Since TBA contracts with a (short) position are ultimately a reduction of the balance sheet, this decreases AGNC’s at risk leverage.
There are two main factors that impact this derivative sub-account’s valuation in any given quarter. The first factor is the net dollar roll (“NDR”) income (expense) generated on AGNC’s net long (short) TBA MBS position. The second factor is the realized valuation gain (loss) upon the settlement of all TBA MBS contracts and the unrealized valuation gain (loss) on all contracts that have yet to be settled at the end of the quarter.
AGNC had a net long TBA MBS position of $26.7 billion as of 12/31/2021 (based on notional amount). AGNC decreased the company’s net long TBA MBS position by ($1.0) billion during the fourth quarter of 2021. Unlike most of 2017-2018, dollar roll financing across most coupons remained less attractive during 2019-early 2020. I believe this was one of the main reasons why AGNC, AAIC, ARR, and NLY reduced their dividend per share rates during this timeframe (all mREIT peers who modestly-heavily utilize the forward TBA market; pre-COVID-19 trends). However, coming out of the initial COVID-19 pandemic panic, dollar roll financing became attractive once again, especially in lower coupons. Implied financing rates even turned negative during 2020-2021 within some coupons (which was/is a positive catalyst/trend).
Continuing a trend experienced during most of 2019, higher coupon “specified pool” MBS experienced a greater “preference” vs. higher coupon generic TBA MBS due to overall macroeconomic trends within the broader mortgage universe (rise in prepayment risk). As such, management reduced exposure to higher coupon generic TBA MBS while increasing exposure to lower coupon generic TBA MBS during the second, third, and fourth quarters of 2020. This general trend has persisted during the first-fourth quarters of 2021.
However, having a proportionately large net long TBA MBS position heading into 2022 led to disastrous results from a valuation perspective. Simply put, lower coupon generic MBS pricing quickly, and notably, decreased during the first quarter of 2022. Even with continued attractive dollar roll financing, the generation of this particular income was vastly “trumped” by extremely severe quarterly MBS valuation losses. Specific fixed-rate agency MBS price changes will be shown in PART 2 of this projection article.
Since fixed-rate agency TBA MBS across all coupons experienced extremely price decreases, even though dollar roll financing remained fairly attractive-attractive, I believe AGNC wanted to lower its historically above average net long position by the end of the first quarter of 2022. Regardless of this anticipated lower balance by quarter end, it is all but guaranteed AGNC experienced a notable net valuation loss within this derivative sub-account during the first quarter of 2022.
Through a detailed analysis that will be omitted from this particular article, when combining the company’s projected quarterly NDR income and net valuation loss, I’m projecting AGNC’s TBA MBS position had a total net valuation loss of ($1.63) billion for the first quarter of 2022. This should be considered a massive loss.
B) Interest Rate Swaps (Net (Short) Position as of 12/31/2021):
- Estimate of $1.73 Billion; Range $1.53 – $1.93 Billion
- Confidence Within Range = Moderate
- See Purple Highlighted, Blue Referenced Secondary Sub-Accounts “b)” in Table 4 Above Next to the March 31, 2022 Column
Let us first discuss the recent history of this derivative sub-account which will lead to a better understanding of my projected total net valuation gain for the first quarter of 2022. AGNC had a net (short) interest rate swaps position of ($51.2) billion as of 12/31/2021 (based on notional amount). AGNC increased the company’s net (short) interest rate payer swaps position by ($1.5) billion during the fourth quarter of 2021.
As pointed out earlier, AGNC slightly lowered the company’s combined on- and off-balance sheet MBS portfolio during the fourth quarter of 2021. AGNC slightly decreased the company’s on-balance sheet MBS portfolio and while also slightly decreasing its off-balance sheet net long TBA MBS position. As such, when all other factors are held constant, a relatively similar hedge position is applicable when simply “maintaining” one’s risk management strategy. AGNC wanted to remain fairly “defensive” regarding the company’s risk management strategy.
Strictly from a valuation perspective, it was not the most advantageous decision to basically maintain one’s hedging coverage ratio during the fourth quarter of 2021 and first quarter of 2022. An even larger net (short) position would have led to a more enhanced net valuation gain. Simply put, along with the notable rise in spread/basis risk over the past three quarters (defined near the beginning of this article), this negatively impacted some sub-sector BVs as many peers recently maintained their hedging coverage ratio. While some peers likely increased their hedging coverage ratio this past quarter, it was likely too little, too late.
Using Table 4 above as a reference, there are two secondary sub-accounts to discuss when projecting a total net valuation gain (loss) regarding AGNC’s interest rate swaps. The first secondary sub-account is AGNC’s “net periodic interest income (costs/expense) of interest rate swaps.” If one recalls, this figure was first discussed in AGNC’s interest expense account. In regards to AGNC’s interest rate swaps net (short) position as of 12/31/2021, the company had a weighted average fixed pay rate of 0.20% and a weighted average floating receive rate of 0.05%. This weighted average fixed pay rate is notably more attractive vs. most sector peers who utilize this specific derivative instrument.
When all factors and assumptions are taken into consideration, through a detailed analysis that will be omitted from this particular article, I’m projecting AGNC will record a net periodic interest income (expense) of $0 million for the first quarter of 2022 vs. ($16) million during the prior quarter (matching of income and expense). I’m anticipating AGNC added a minor amount of new interest rate payer swaps during the quarter which had less favorable current period interest expenses when compared to existing swaps (this includes swaptions that were exercised). LIBOR and the Standard Overnight Financing Rate (“SOFR”) moved higher towards the end of the quarter; thus benefiting this specific metric.
The second secondary sub-account to discuss relates to the net valuation gain (loss) on AGNC’s interest rate swaps. Across most tenors/maturities, there was a notable/massive increase in the fixed pay rate of interest rate payer swap contracts during the first quarter of 2022. The fixed pay rate on interest rate swap contracts across all tenors/maturities had a net fluctuation of 50 – 160 bps during the first quarter of 2022. With the continued notable flattening of the yield curve, it was notably more advantageous to have interest rate payer swaps towards the shorter-end of the yield curve regarding valuation fluctuations during the first quarter of 2022 when compared to the longer-end of the yield curve. As such, there is going to be some larger-than-average valuation fluctuations amongst mREIT peers regarding this specific derivative instrument for the first quarter of 2022.
Through a detailed analysis that will be omitted from this particular article, I am projecting the company’s second secondary sub-account had a net valuation gain of $1.73 billion for the first quarter of 2022. The includes the assumption AGNC’s management team continued to maintain the weighted average tenor of the portfolio, basically maintain the notional value of the net (short) position (and the company’s on- and off-balance sheet MBS portfolio decreases), and only slightly increased the weighted average fixed pay rate of this specific portfolio. When both secondary sub-accounts are combined, I’m projecting AGNC’s interest rate swaps had a total net valuation gain of $1.73 billion for the first quarter of 2022.
C) Interest Rate Swaptions (Net (Short) Position as of 12/31/2021):
- Estimate of $440 Million; Skewed Range $290 – $590 Million
- Confidence Within Range = Moderate to High
- See Pink Highlighted, Blue Referenced Sub-Account “c)” in Table 4 Above Next to the March 31, 2022 Column
Let us first briefly get accustomed with this type of derivative instrument. Interest rate swaptions are options to enter into underlying interest rate swap contracts. Whereas interest rate swap contracts have no initial “up-front” costs (gains and losses are incurred as interest rates fluctuate over the life of the swaps), interest rate swaptions have implicit up-front costs (similar to an option contract, generally speaking). However, a realized gain (loss) is only incurred (and is deferred over the remaining life of the underlying swap) when the option expires/terminates/is sold.
Let us discuss the recent history of this derivative sub-account which will lead to a better understanding of my projected total net valuation gain for the first quarter of 2022. AGNC had a net (short) interest rate swaptions position of ($13.0) billion as of 12/31/2021 (based on the notional balance of the underlying interest rate swaps). AGNC increased the company’s net (short) interest rate payer swaptions position by ($0.1) billion during the fourth quarter of 2021. As of 12/31/2021, AGNC’s interest rate payer swaptions had a weighted average of 18 months until expiration with an underlying interest rate swaps weighted average tenor/maturity of 9.6 years and a weighted average fixed pay rate of 1.93%.
Mainly since interest rate payer swaps with a similar weighted average tenor/maturity had a fixed pay rate of 2.35%-2.40% as of 3/31/2022, I’m projecting AGNC’s interest rate payer swaptions had a total net valuation gain of $440 million for the first quarter of 2022. I believe most of AGNC’s swaptions could be exercised if desired (which derives “value,” especially contracts further out on the option time horizon). Would make sense if AGNC was looking to increase the company’s agency MBS portfolio in the future.
D) U.S. Treasury Securities (Net (Short) Position as of 12/31/2021):
- Estimate of $535 Million; Range $385 – $685 Million
- Confidence Within Range = Moderate to High
- See Dark Blue, Brown, and Teal Highlighted, Blue Referenced Secondary Sub-Accounts “d)” in Table 4 Above Next to the March 31, 2022 Column
Let us first briefly get accustomed with this type of derivative instrument. AGNC purchases (or sells short) U.S. Treasury securities and U.S. Treasury security futures to help mitigate the potential impact of changes in MBS prices (hence the valuation of a majority of the company’s investment portfolio). AGNC borrows securities to cover U.S. Treasury (short sales) under reverse repurchase agreements. AGNC accounts for these derivative instruments as “security borrowing transactions” and recognizes an obligation to return the borrowed securities at FMV based on the current value of the underlying borrowed securities.
Let us discuss the recent history of this derivative sub-account which will lead to a better understanding of my projected total net valuation gain for the first quarter of 2022. AGNC had the following three derivative secondary sub-account positions as of 12/31/2021: 1) long U.S. Treasury securities of $0.5 billion; 2) (short) U.S. Treasury securities of ($9.6) billion; and 3) U.S. Treasury security futures sold (short) of ($1.5) billion. This is based on each secondary sub-account’s face amount (“par”). When combining all three secondary sub-accounts together, AGNC increased the company’s net (short) U.S. Treasury securities position by ($0.9) billion during the fourth quarter of 2021.
Yields on 5-, 7-, and 10-year U.S. Treasury securities increased 80-120 bps during the first quarter of 2022. However, regarding actual U.S. Treasury and U.S. Treasury futures pricing, there was a modestly less positive movement which needs to be noted. Again, this gets back to the rise in spread/basis risk. As such, there was a bit of short-term “de-coupling” between the change in yield and actual pricing of U.S. Treasury securities. This negatively impacted valuation fluctuations within certain parts of the yield curve (namely the longer-end). Since U.S. Treasury securities are one of the most liquid investments in the marketplace, AGNC trades these derivative instruments throughout the quarter which also needs to be taken into consideration.
Through a detailed analysis that will be omitted from this particular article, I’m projecting AGNC’s U.S. Treasury securities and U.S. Treasury security futures had a total net valuation gain of $535 million for the first quarter of 2022. If AGNC slightly-modestly increased the company’s net (short) U.S. Treasury securities position prior to March 2022, then its net valuation gain would be more enhanced.
All remaining derivative sub-accounts within Table 4 that have not been specifically mentioned above are deemed immaterial for discussion purposes. This includes valuation projections regarding the following derivative sub-accounts: 1) interest-only (“IO”) and principle-only (“PO”) strips; 2) debt on consolidated variable-interest-entities (“VIE”); 3) REIT equity securities (no position as of 12/31/2021), and 4) put options (when applicable).
When combining all the derivative sub-accounts together (both material and immaterial), I am projecting AGNC’s derivative instruments and other securities, net account had a total net valuation gain of $1.08 billion for the first quarter of 2022. Now, I want to discuss my quarterly projection for AGNC’s net spread + NDR income for the and compare it to several prior quarters.
Discussion of AGNC’s Net Spread + NDR Income (REIT Forum Feature):
A) Net Income (Loss):
- Estimate of ($712) Million; Range ($912) – ($512) Million
- Net Income (Loss) Available to Common Shareholders of ($1.41) Per Share (Excluding OCI/(OCL)); Range ($1.80) – ($1.03) Per Share
- Confidence Within Range = Moderate
- See Red Reference “A” in Table 6 Below Next to the March 31, 2022 Column
Three remaining accounts within AGNC’s consolidated statement of comprehensive income (loss) that impact the company’s net income (loss) amount are the following: 1) unrealized gain (loss) on investments measured at FMV through net income (loss), net; 2) compensation expense; and 3) general/administrative expenses. In regards to the first listed account, this projection will be discussed in PART 2 of the article; even though it is part of AGNC’s net gain (loss) amount and shown within Table 1. While the remaining two accounts have been projected within Table 1, they are deemed immaterial for discussion purposes and will be excluded from any analysis within this article.
When the accounts from Table 1 above are combined, I’m projecting AGNC had a net loss of ($712) million for the first quarter of 2022. After accounting for AGNC’s quarterly preferred stock dividends, this would be earnings (loss) available to common shareholders of ($1.41) per share.
Conclusions Drawn (PART 1):
To sum up the analysis above, I am projecting AGNC will report the following account figures for the first quarter of 2022 (refer back to Table 1 near the beginning of the article):
1) Quarterly Interest Income of $350 Million
2) Quarterly Interest Expense of $20 Million
3) Quarterly Net Loss on the Sale of Investment Securities of ($300) Million
4) Quarterly Net Gain on Derivative Instruments and Other Securities of $1.08 Billion
I am also projecting AGNC will report the following net loss, EPS, and net spread + NDR income amounts for the first quarter of 2022 (refer back to Tables 1 and 5):
A) Quarterly Net Loss of ($712) Million; Earnings (Loss) Available to Common Shareholders of ($1.41) Per Share
– Quarterly Net Spread + NDR Income (1 Dividend Sustainability Metric) of $0.705 Per Common Share
AGNC’s projected net loss of ($712) million for the first quarter of 2022 is a notable decrease when compared to a net loss of ($27) million for the fourth quarter of 2021. This is mainly due to a projected notably more severe net realized and unrealized loss on investment securities when compared to the prior quarter, only partially offset by a notably more enhanced derivatives net valuation gain.
As stated earlier, AGNC’s OCI/(OCL) amount is part of the company’s consolidated statement of comprehensive income (loss) but is excluded from the company’s net income (loss) and EPS amounts.
As such, I STRONGLY suggest holding off on a “final verdict” regarding AGNC’s projected results for the first quarter of 2022 until PART 2 of this article is provided.
In my professional opinion, I believe AGNC’s “comprehensive gain (loss)” amount is more important than the company’s net income (loss) and EPS amounts.
My BUY, SELL, or HOLD Recommendation:
I decided to provide my AGNC recommendation to readers after PART 1 of this article so there is a better sense on my thoughts regarding the company’s current valuation (so readers do not have to wait until PART 2). I would stress beforehand this recommendation is based on all of my AGNC account projections, including accounts that will be discussed in PART 2.
From the analysis provided above, including additional catalysts/factors not discussed within this particular article, I currently rate AGNC as a SELL when I believe the company’s stock price is trading at or greater than my projected non-tangible CURRENT BV (BV as of 4/15/2022), a HOLD when trading at less than my projected non-tangible CURRENT BV through less than a (10%) discount to my projected non-tangible CURRENT BV, and a BUY when trading at or greater than a (10%) discount to my projected non-tangible CURRENT BV. These ranges are unchanged when compared to my last AGNC article (approximately 2.5 months ago).
Therefore, with a closing price of $11.86 per common share as of 4/19/2022, I currently rate AGNC as a HOLD.
As such, I currently believe AGNC is appropriately valued from a stock price perspective. My current price target for AGNC is approximately $12.15 per share. This is currently the price where my recommendation would change to a SELL. The current price where my recommendation would change to a BUY is approximately $10.95 per share. Put another way, the following are my CURRENT BUY, SELL, or HOLD per share recommendation ranges (the REIT Forum subscribers get this type of data on all 20 mREIT stocks I currently cover on a weekly basis):
$12.15 per share or above = SELL
$10.96 – $12.14 per share = HOLD
$9.71 – $10.95 per share = BUY
$9.70 per share or below = STRONG BUY
Along with the data presented within this article, this recommendation considers the following mREIT catalysts/factors: 1) projected future MBS/investment price movements; 2) projected future derivative valuations;and 3) projected near-term dividend per share rates.These recommendations also consider the 8 Fed Funds Rate increases by the FOMC during December 2016-2018 (a more hawkish tone/rhetoric when compared to 2014-2016), the three Fed Funds Rate decreases during 2019 due to the more dovish tone/rhetoric regarding overall monetary policy as a result of recent macroeconomic trends/events, and the very quick “plunge” in the Fed Funds Rate to near 0% in March 2020. This also considers the previous wind-down/decrease of the Fed Reserve’s balance sheet through gradual runoff/partial non-reinvestment (which began in October 2017 which increased spread/basis risk) and the prior “easing” of this wind-down that started in May 2019 regarding U.S. Treasuries and August 2019 regarding agency MBS (which partially reduced spread/basis risk when volatility remained subdued). This also considers the early Spring 2020 announcement of the start of another round of quantitative easing (“QE”) that includes the Fed specifically purchasing agency MBS (and “rolling over” all principal and interest payments into new agency MBS) which bolstered prices while keeping long-term/mortgage interest rates near historical lows (which lowered spread/basis risk for quite some time when volatility remained subdued). This also includes the recent “taper” of the Fed’s most recent QE program regarding its monthly purchases of $80 billion of U.S. Treasury securities and $40 billion of agency MBS. This taper began in November 2021 and market speculation around this future event has already caused a rise in spread/basis risk this past summer and during the second half of the fourth quarter of 2021-first quarter of 2022 (as correctly previously anticipated). This includes the FOMC’s recent accelerated taper and the continued very likely quick rise in the Fed Funds Rate which began in March 2022. Spread/Basis risk should begin to abate towards the end of the spring of 2022.
Current Sector/Recent NLY/AGNC Stock Disclosures:
On 3/18/2020, I once again initiated a position in AGNC at a weighted average purchase price of $7.115 per share (large purchase). This weighted average per share price excludes all dividends received/reinvested. On 6/2/2021, I sold my entire AGNC position at a weighted average sales price of $18.692 per share as my price target, at the time, of $18.65 per share was surpassed. This calculates to a weighted average realized gain and total return of 162.7% and 188.6%, respectively. I held this position for approximately 14.5 months.
On 3/18/2020, I initiated a position in NLY at a weighted average purchase price of $5.05 per share (large purchase). This weighted average per share price excluded all dividends received/reinvested. On 6/9/2021, I sold my entire NLY position at a weighted average sales price of $9.574 per share as my price target, at the time, of $9.55 per share was surpassed. This calculates to a weighted average realized gain and total return of 89.6% and 112.0%, respectively. I held this position for approximately 15 months.
On 1/31/2017, I initiated a position in New Residential Investment Corp. (NRZ) at a weighted average purchase price of $15.10 per share. On 6/29/2017, 7/7/2017, and 12/21/2018, I increased my position in NRZ at a weighted average purchase price of $15.775, $15.18, and $14.475 per share, respectively. When combined, my NRZ position had a weighted average purchase price of $14.912 per share. This weighted average per share price excluded all dividends received/reinvested. On 2/6/2020, I sold my entire NRZ position at a weighted average sales price of $17.555 per share as my price target, at the time, of $17.50 per share was surpassed. This calculates to a weighted average realized gain and total return of 17.7% and 41.2%, respectively. I held this position, on a weighted average basis, for approximately 20 months.
On 9/22/2020, I once again initiated a position in NRZ at a weighted average purchase price of $7.645 per share. On 1/28/2021, 7/16/2021, 8/20/2021 and 4/7/2022, I increased my position in NRZ at a weighted average purchase price of $9.415, $9.525, $9.485, and $10.110 per share, respectively. When combined, my NRZ position has a weighted average purchase price of $9.026 per share. This weighted average per share price excludes all dividends received/reinvested.
On 1/2/2020, I initiated a position in AAIC at a weighted average purchase price of $5.57 per share. On 1/9/2020, 3/16/2020, 9/24/2020, 5/6/2021, 9/2/2021, 9/10/2021, 11/10/2021, 11/24/2021, and 3/3/2022, I increased my position in AI at a weighted average purchase price of $5.59, $3.25, $2.53, $3.875, $3.748, $3.75, $3.752, $3.70, and $3.39 per share, respectively. When combined, my AAIC position has a weighted average purchase price of $3.456 per share. This weighted average per share price excludes all dividends received/reinvested.
On 10/19/2020, I initiated a position in PennyMac Mortgage Investment Trust (PMT) at a weighted average purchase price of $16.275 per share. On 10/29/2020, 8/12/2021, 8/20/2021, 11/18/2021, 2/4/2022, and 4/19/2022, I increased my position in PMT at a weighted average purchase price of $14.90, $18.693, $18.407, $18.180, $16.024, and $14.721 per common share, respectively. When combined, my PMT position has a weighted average purchase price of $15.857 per share. This weighted average per share price excludes all dividends received/reinvested.
On 12/1/2020, I initiated a position in DX at a weighted average purchase price of $16.59 per share. On 12/20/2021, I increased my position in DX at a weighted average purchase price of $15.35 per share. When combined, my DX position has a weighted average purchase price of $15.66 per share. This weighted average per share price excludes all dividends received/reinvested.
On 10/12/2018, I initiated a position in Granite Point Mortgage Trust, Inc. (GPMT)at a weighted average purchase price of $18.155 per share. On 5/12/2020, 5/27/2020, 5/28/2020, 8/26/2020, 9/10/2020, and 9/11/2020, I increased my position in GPMT at a weighted average purchase price of $4.745, $5.144, $5.086, $6.70, $6.19, and $6.045 per share, respectively. My last two purchases made up approximately 50% of my total position (to put things in better perspective). When combined, my GPMT position had a weighted average purchase price of $6.234 per share. This weighted average per share price excluded all dividends received/reinvested. On 6/8/2021, I sold my entire GPMT position at a weighted average sales price of $15.783 per share as my price target, at the time, of $15.75 per share was surpassed. This calculates to a weighted average realized gain and total return of 153.2% and 168.7%, respectively. I held this position, on a weighted average basis, for approximately 11 months.
On 12/10/2021, I once again initiated a position in GPMT at a weighted average purchase price of $11.817 per share. On 12/15/2021 and 4/19/2022, I increased my position in GPMT at a weighted average purchase price of $11.318 and $9.998 per share, respectively. When combined, my GPMT position has a weighted average purchase price of $10.741 per share. This weighted average per share price excludes all dividends received/reinvested.
On 1/24/2022, I initiated a position in Ready Capital Corp. (RC) at a weighted average purchase price of $13.39 per share. This weighted average per share price excludes all dividends received/reinvested.
Final Note: All trades/investments I have performed over the past several years have been disclosed to readers in “real time” (that day at the latest) via either the StockTalks feature of Seeking Alpha or, more recently, the “live chat” feature of the Marketplace Service the REIT Forum (which cannot be changed/altered). Through these resources, readers can look up all my prior disclosures (buys/sells) regarding all companies I cover here at Seeking Alpha (see my profile page for a list of all stocks covered). Through StockTalk disclosures and/or the live chat feature of the REIT Forum, at the end of March 2022 I had an unrealized/realized gain “success rate” of 91.8% and a total return (includes dividends received) success rate of 95.1% out of 61 total past and present mREIT and business development company (“BDC”) positions (updated monthly; multiple purchases/sales in one stock count as one overall position until fully closed out). I encourage other Seeking Alpha contributors to provide real time buy and sell updates for their readers/subscribers which would ultimately lead to greater transparency/credibility. Starting in January 2020, I have transitioned all my real-time purchase and sale disclosures solely to members of the REIT Forum. All applicable public articles will still have my “main ticker” purchase and sale disclosures (just not in real time).
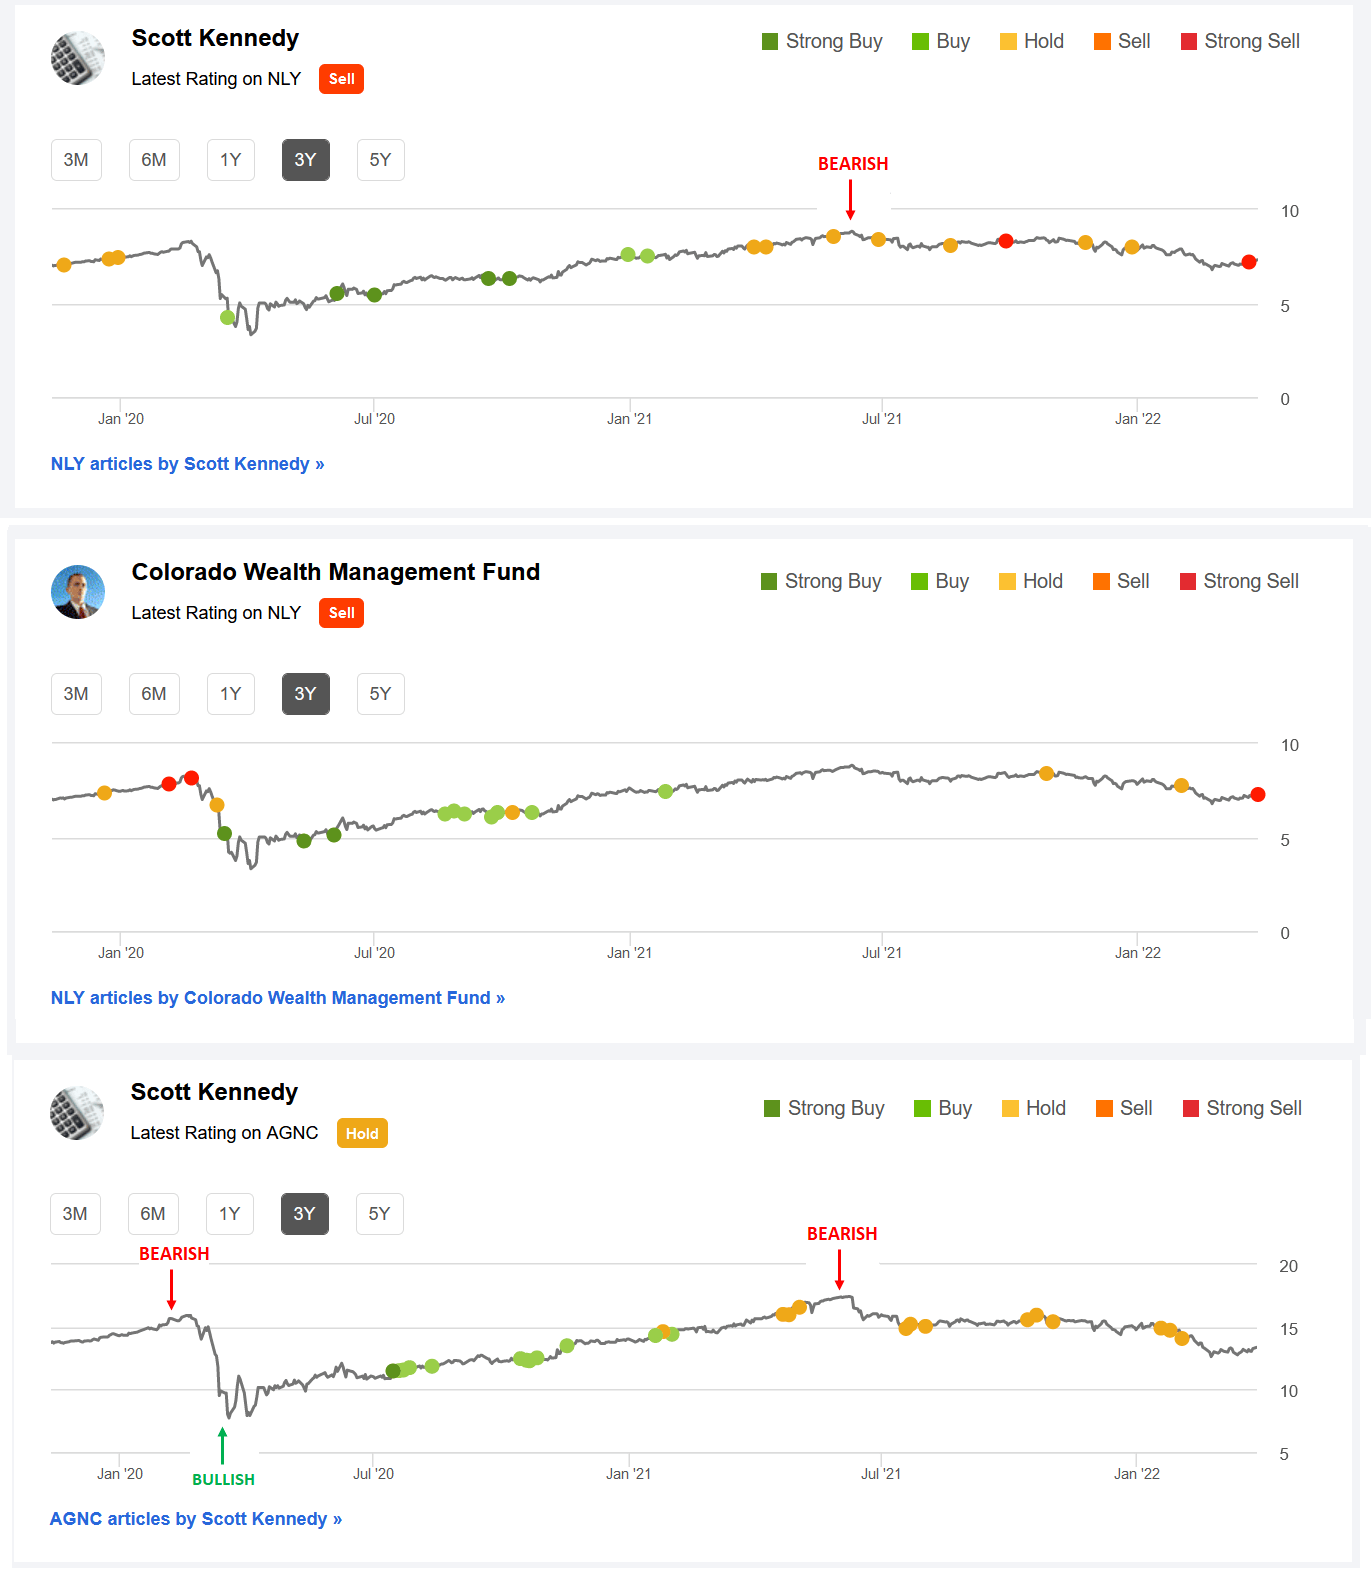
Table 5 – NLY + AGNC The REIT Forum Seeking Alpha Recommendations (November 2019 – April 2022 Timeframe)
Seeking Alpha
(Source: Table directly from Seeking Alpha; 1st AGNC “Bearish” indicator included by me directly from the public AGNC article dated 2/5/2020 recommendation (which can’t be changed once public), AGNC “Bullish” indicator included by me directly from the public AGNC article dated 4/17/2020 recommendation, and 2nd “Bearish” indicator included by me directly from the REIT Forum’s weekly subscriber recommendation article series [week of 6/4/2021 for AGNC and week of 6/11/2021 for NLY]).
Lastly, I just want to quickly highlight my/our AGNC and NLY Seeking Alpha recommendation ranges over the past 3 years or so. In my personal opinion, a stock with a BUY recommendation should increase in price over time, a SELL recommendation should decrease in price over time, and a HOLD recommendation should remain relatively unchanged in price over time (pretty logical). Simply put, my/our “valuation methodology” has correctly timed when both AGNC and NLY have been undervalued (a BUY recommendation; bullish), overvalued (a SELL recommendation; bearish), and appropriately valued (a HOLD recommendation; neutral).
Using Table 5 above as a reference, I believe we have done a pretty good job in my/our AGNC and NLY recommendation ratings. For NLY, both pricing charts should really be viewed as 1 combined chart since CO and I are part of the same Marketplace service team. Not only do I/we want to provide guidance/a recommendation that enhances total returns for subscribers, I/we also want to protect these generated returns by subsequently minimizing total losses. I personally believe this methodology/strategy is very important. In other words, correctly spotting both positive catalysts/trends and negative factors/trends as economic and interest rate cycles fluctuate.
This methodology/strategy was extremely useful/accurate when going back to very late 2019 and early 2020 (both pre-COVID-19) where I/we had a SELL recommendation on both AGNC and NLY. For some reason, this S.A. pricing chart does not show my AGNC SELL recommendation pre-COVID-19 but one can simply look to past public articles in early 2020 (just an omission on S.A.’s end in this particular case). As an alternative, simply look at the NLY SELL recommendation highlighted in CO’s pricing chart (AGNC and NLY typically have very similar recommendation ranges when considering similar time periods). Furthermore, after the initial “pandemic panic,” I/we had a STRONG BUY recommendation on both AGNC and NLY later in the spring of 2020.
Simply put, a contributor’s/team’s recommendation track record should “count for something” and should always be considered when it comes to credibility/successful investing. You will not see most (if not all) other contributor teams use this type of factual, recommendation-driven price chart because the results are not nearly as “attractive” when compared to our own.
Each investor’s BUY, SELL, or HOLD decision is based on one’s risk tolerance, time horizon, and dividend income goals. My personal recommendation will not fit each reader’s current investing strategy. The factual information provided within this article is intended to help assist readers when it comes to investing strategies/decisions.
Understanding My Valuation Methodology Regarding mREIT Common and BDC Stocks:
The basic “premise” around my recommendations in the mREIT common and BDC sectors is value. Regarding operational performance over the long-term, there are above average, average, and below average mREIT and BDC stocks. That said, better-performing mREIT and BDC peers can be expensive to own, as well as being cheap. Just because a well-performing stock outperforms the company’s sector peers over the long-term, this does not mean this stock should be owned at any price. As with any stock, there is a price range where the valuation is cheap, a price where the valuation is expensive, and a price where the valuation is appropriate. The same holds true with all mREIT common and BDC peers. As such, regarding my investing methodology, each mREIT common and BDC peer has their own unique BUY, SELL, or HOLD recommendation range (relative to estimated CURRENT BV/NAV). The better-performing mREITs and BDCs typically have a recommendation range at a premium to BV/NAV (varying percentages based on overall outperformance) and vice versa with the average/underperforming mREITs and BDCs (typically at a discount to estimated CURRENT BV/NAV).
Each company’s recommendation range is “pegged” to estimated CURRENT BV/NAV because this way subscribers/readers can track when each mREIT and BDC peer moves within the assigned recommendation ranges (daily if desired). That said, the underlying reasoning why I/we place each mREIT and BDC recommendation range at a different premium or (discount) to estimated CURRENT BV/NAV is based on roughly 15-20 catalysts which include both macroeconomic catalysts/factors and company-specific catalysts/factors (both positive and negative). This investing strategy is not for all market participants. For instance, not likely a “good fit” for extremely passive investors. For example, investors holding a position in a particular stock, no matter the price, for say a period of 5+ years. However, as shown throughout my articles written here at Seeking Alpha since 2013, in the vast majority of instances I have been able to enhance my personal total returns and/or minimize my personal total losses from specifically implementing this particular investing valuation methodology. I hope this provides some added clarity/understanding for new subscribers/readers regarding my valuation methodology utilized in the mREIT common and BDC sectors. Please disregard any minor “cosmetic” typos if/when applicable.
Be the first to comment