

SimonSkafar/E+ via Getty Images
We wrote about ABB Ltd (NYSE:ABB) (electric equipment firm) last January when we were sizing up a short trade. Shares are now down close to 10% since we penned that piece. Furthermore, as we can see from the long-term chart below, the weakness over the past month or so has resulted in the monthly MACD indicator registering a sell signal. This indicator (dual long-term read on both momentum & trend) incorporates a sizable amount of information on long-term charts, so crossovers need to be treated with respect.
The worry for ABB bulls at this juncture is the actual height of the sell signal above its corresponding zero-line. The last time such an elevated sell signal was delivered in this stock was back in 2008, when selling intensified to the downside in the aftermath.
MACD crossover in ABB (Stockcharts.com)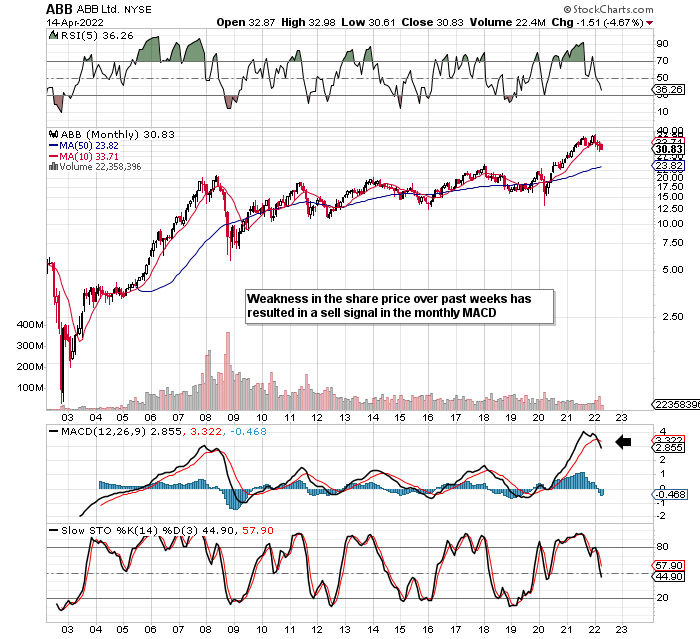
When we go to the weekly chart, we can see that price has consistently closed lower over the past four weeks. This trend combined with the fact that ABB´s weekly MACD has now crossed into bearish territory is bound to bring trend followers into play here. Therefore we would go so far as to say that a bearish play in ABB at present has a higher probability of playing out now than, say, 12 weeks ago when we penned that initial piece. The reason being is that the downward trend is in motion now despite the lower price we have at present.
4 Week Low in ABB (Stockcharts.com)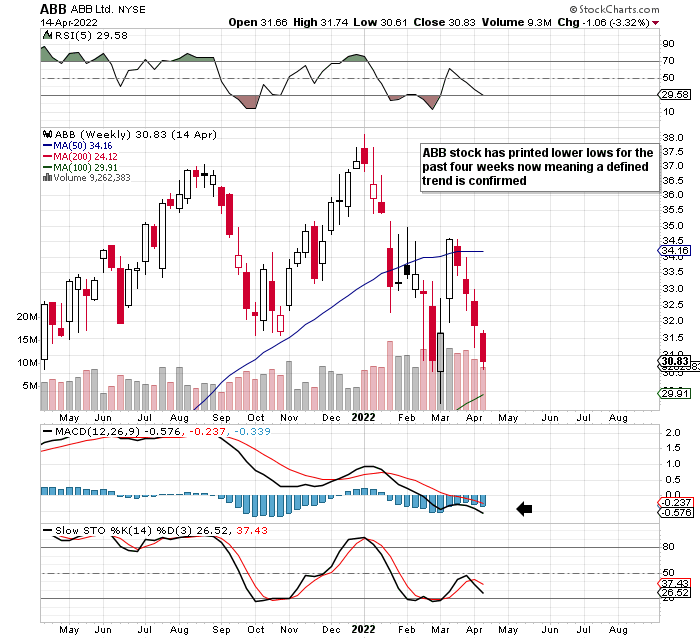
Given ABB´s strong profitability and the fact that the company is participating in areas that are availing of significant global tailwinds (renewable energy & charging for electric vehicles to name but a few), fundamental derived investors will be undoubtedly surprised by recent share-price action. In the company’s most recent fourth quarter earnings report, for example, strength was evident across all segments with comparable sales growing by 8% and order growth coming in at 21%. These numbers were achieved in the face of ongoing supply chain bottlenecks which led to shortages of certain components.
ABB Earnings Call Presentation (Company Website)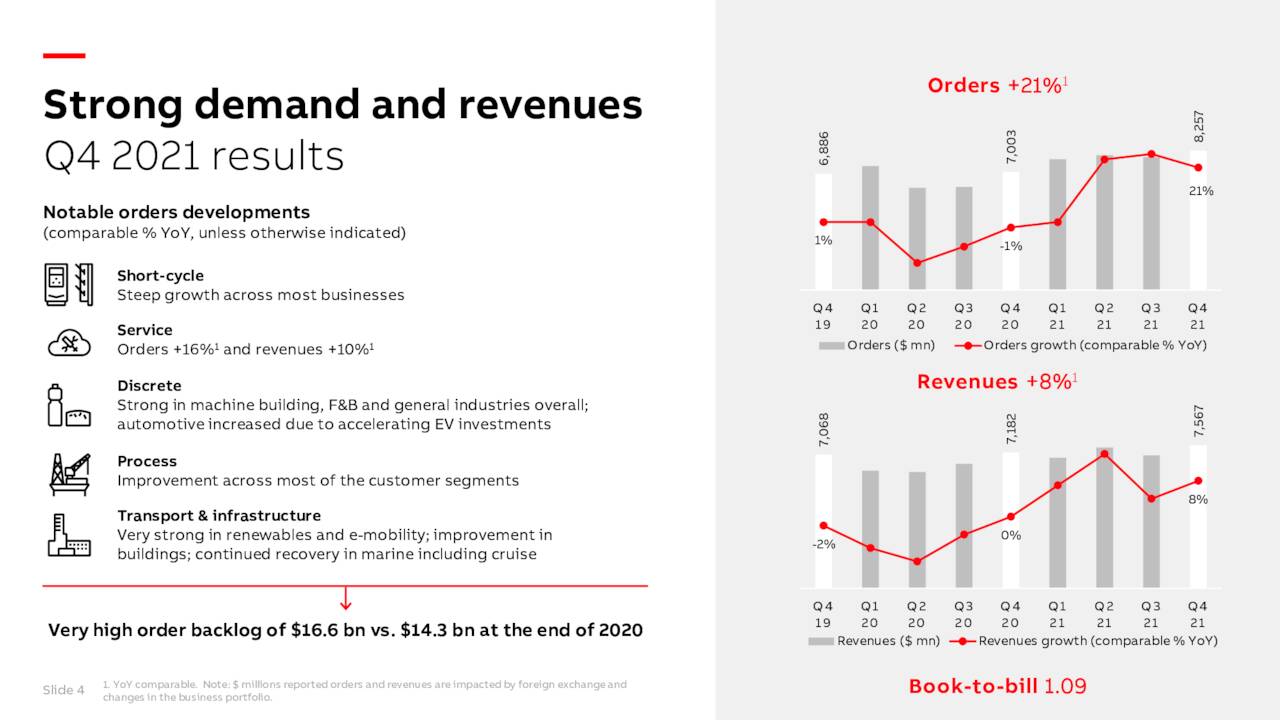
Furthermore, when we take the company´s latest fiscal year as a whole, there were a lot of distinct improvements. Strong demand led to margin improvement and strong cash-flow generation. The company received top dollar for the sale of the Mechanical Power Transmission business and the annual dividend was increased once more. Suffice it to say, with a debt to equity ratio of 0.31 at the end of fiscal 2021 along with an interest coverage ratio of 40.10, there appears to be plenty of scope for buybacks to continue and for acquisitions to be scaled up from here on out.
In saying the above, one area which may explain the bearish charts may be the following. The consensus EPS revisions trends have not been encouraging. For example, the current $0.26 per share earnings estimate for ABB´s first quarter has been revised down by close to 20% over the past three months and over 26% over the past six months. We see the same bearish trend for the second quarter with the $0.28 bottom-line estimate down 27% and 30% over the past 3 months and six months respectively. Suffice it to say, although ABB´s profitability incorporates EBITDA margins of almost 16% at present, the market is obviously sounding out where the company´s profitability is trending, at least in the short term.
This really is the issue for ABB. If trading conditions were to further deteriorate from a supply chain perspective, management will be put under more pressure to execute on its acquisition strategy to meet long-term growth targets. Being chartists, we believe that all of ABB´s fundamentals have already been digested by the share-price action on the technical chart. Suffice it to say, shares continue to trend downward which means the bears remain in control.
Therefore, to sum up, both the monthly and weekly technical charts of ABB have bearish connotations at present. Although profitability remains strong in the company, recent consensus EPS revisions concerning upcoming quarters have been poor, and the company´s trailing sales multiple of 2.15 continues to come in higher over its 5-year average counterpart (1.86). Let’s see if the first quarter can hit its projections this week. We look forward to continued coverage.
Be the first to comment