

Is AAPL rotten or ripe? I suppose that depends on how you define the parameters of the question. Is it rotten in the sense that it has already struck a long-term, important high via price and will now succumb to gravitational forces? From our work on both the fundamental and technical analysis sides, that’s not likely at the moment.
Is AAPL ripe? Again, let’s define what we’re talking about. We believe AAPL is ripe for a corrective pattern that should take some more months to work itself out. Our work in Stock Waves is where fundamentals and technicals align. So, first, let’s examine where we have been in AAPL from a fundamental viewpoint and then what is most likely next.
Lyn Alden provides our members with fundamental analysis on select large, mid and small-cap stocks within our Stock Waves service, as well as macroeconomic analysis in our Market Alerts service. With a background blending engineering and finance, Lyn uses a dispassionate long-term quantitative and qualitative approach to filter through the noise and find value in stocks and markets around the world.
Back on January 19, 2022, Lyn posted these comments and chart in our Stock Waves service:
Fundamentals agree (that AAPL is ready for a pullback). Or at least, they suggest that a P/E ratio of 30x is very heavy compared to single-digit earnings growth forecasts. Falling to $90 is quite a move that might or might not happen, but overall I don’t like the risk/reward ratio for AAPL here.
FastGraph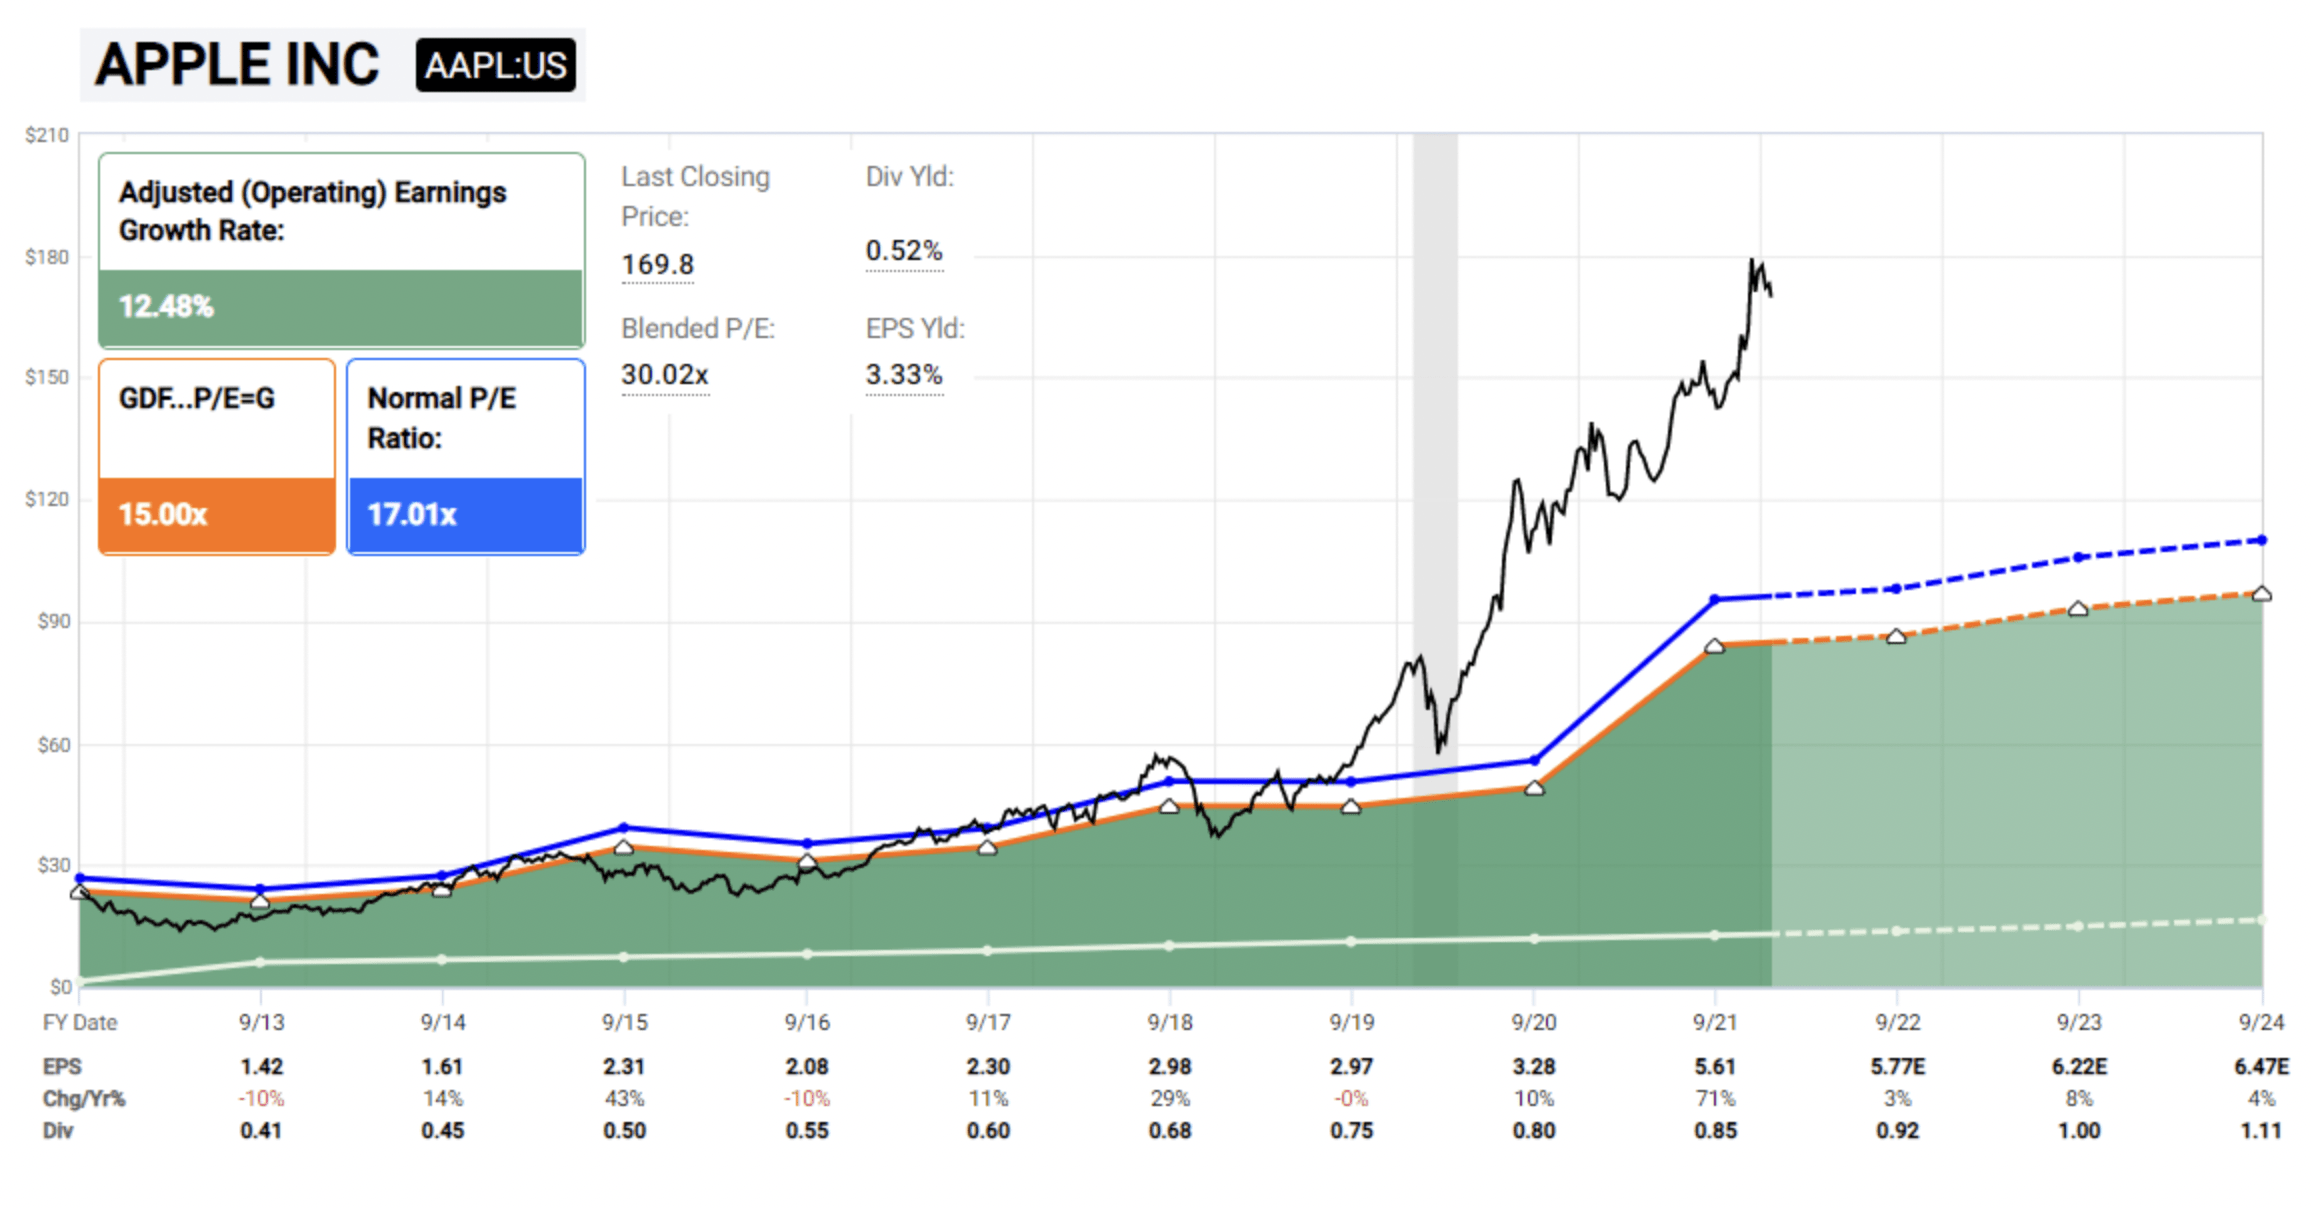
Just the day before, Zac Mannes, one of the founding analysts in Stock Waves, posted this chart showing the technical analysis viewpoint:
MotiveWave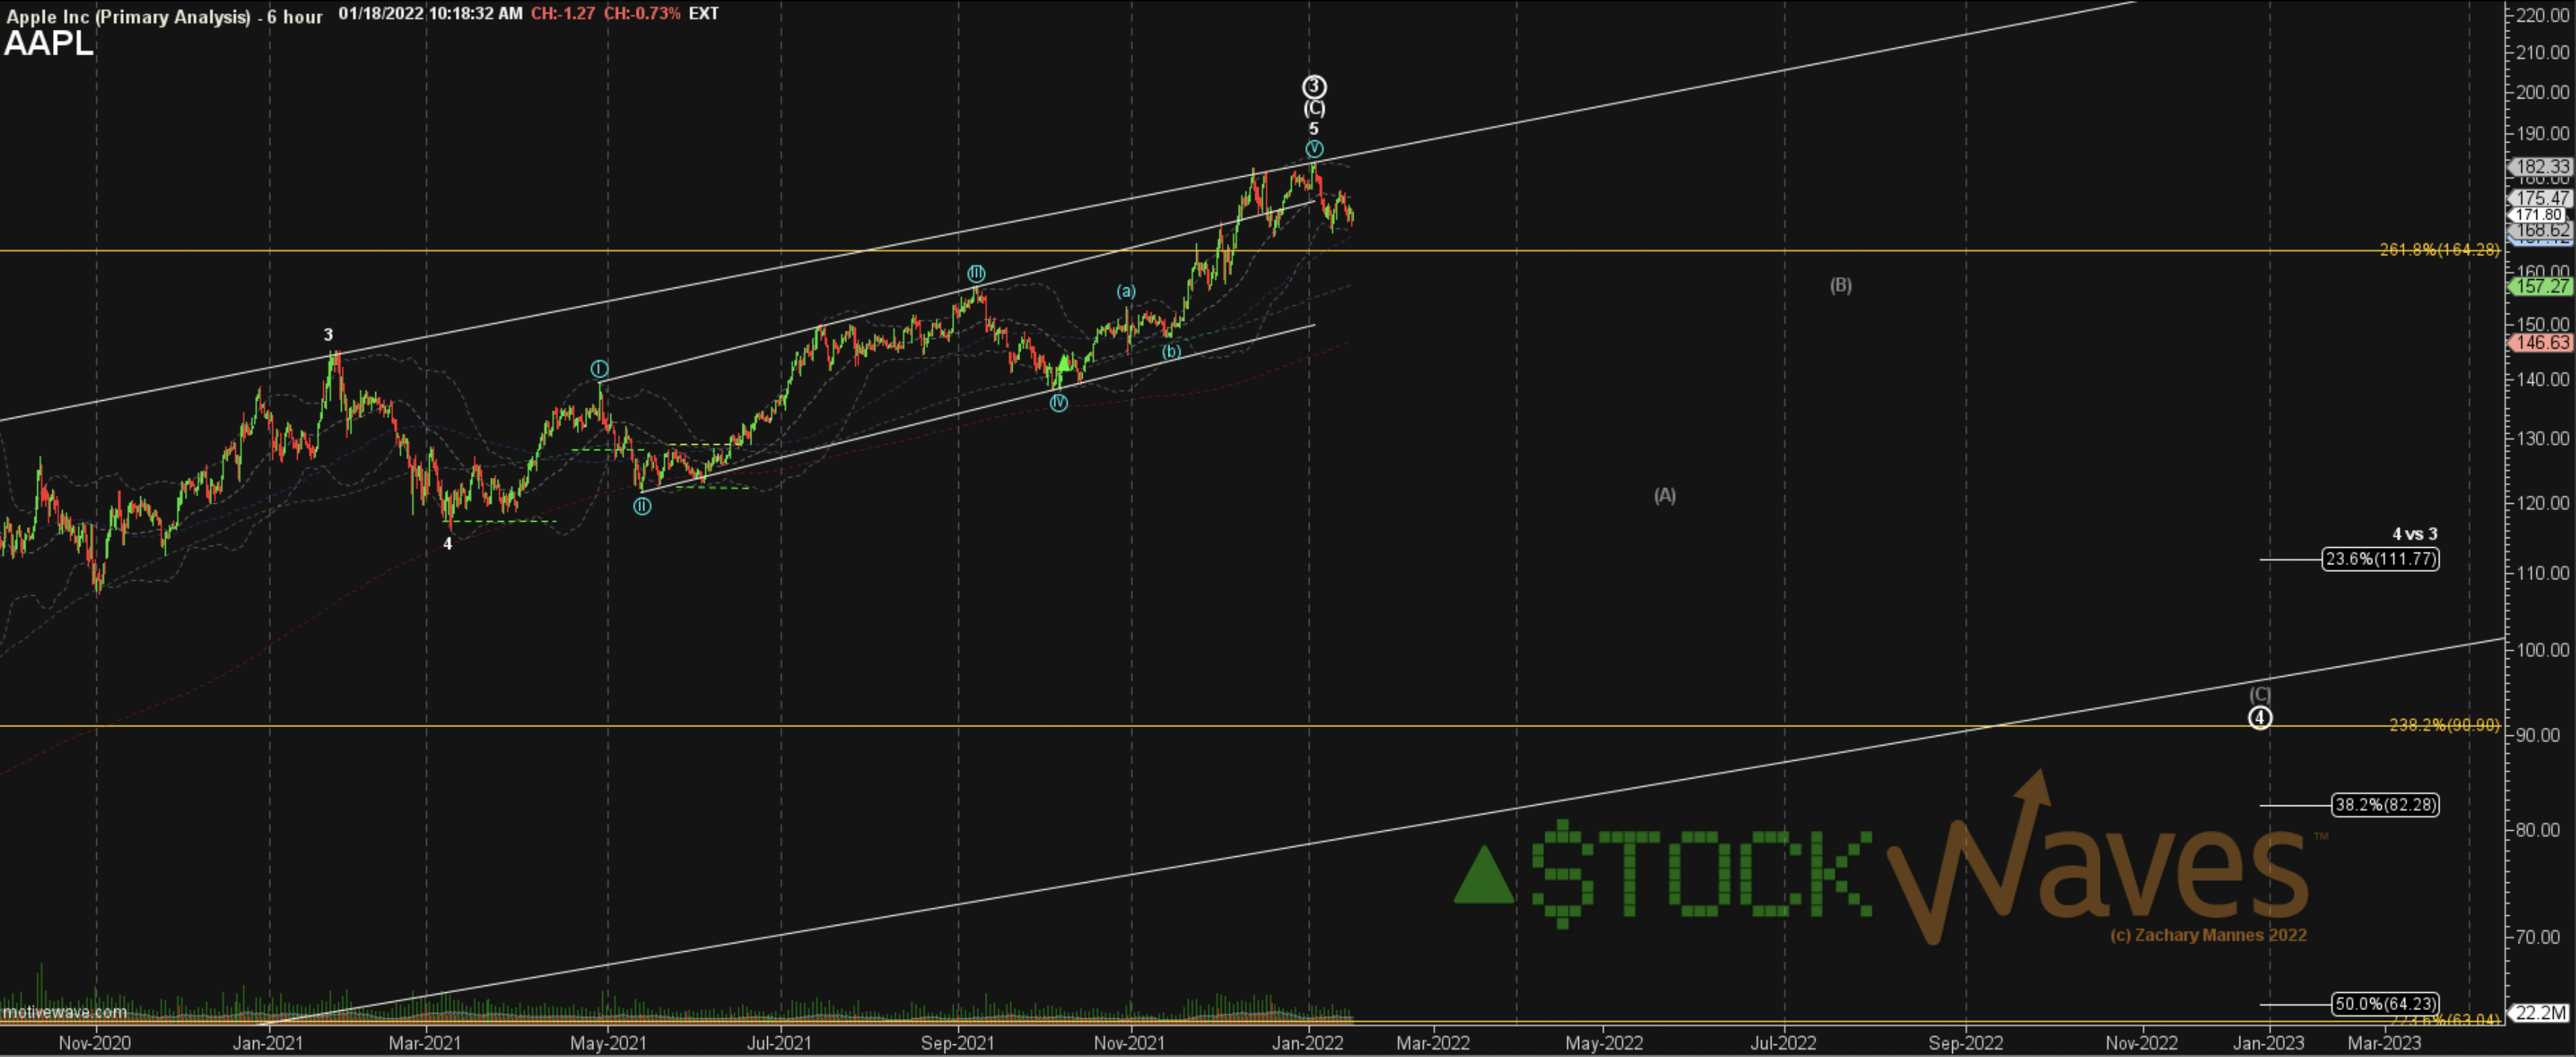
Now, some 6 months later, we can see that those team comments have aged quite well. In fact, let’s take a peek at where we are now via the fusion of fundamentals and technicals.
On July 6, 2022, Lyn made this comment in Stock Waves:
AAPL certainly let a lot of steam off along with the rest of the market. I’m kind of neutral on it now after this drop, rather than particularly bearish or bullish. I think technicals are pretty in control at the moment. My fundamental concern is that many corporations are likely to experience weaker earnings over the next few quarters, and AAPL has a lot of supply chain exposure in China.
Also, this FastGraph was included in the analysis:
FastGraph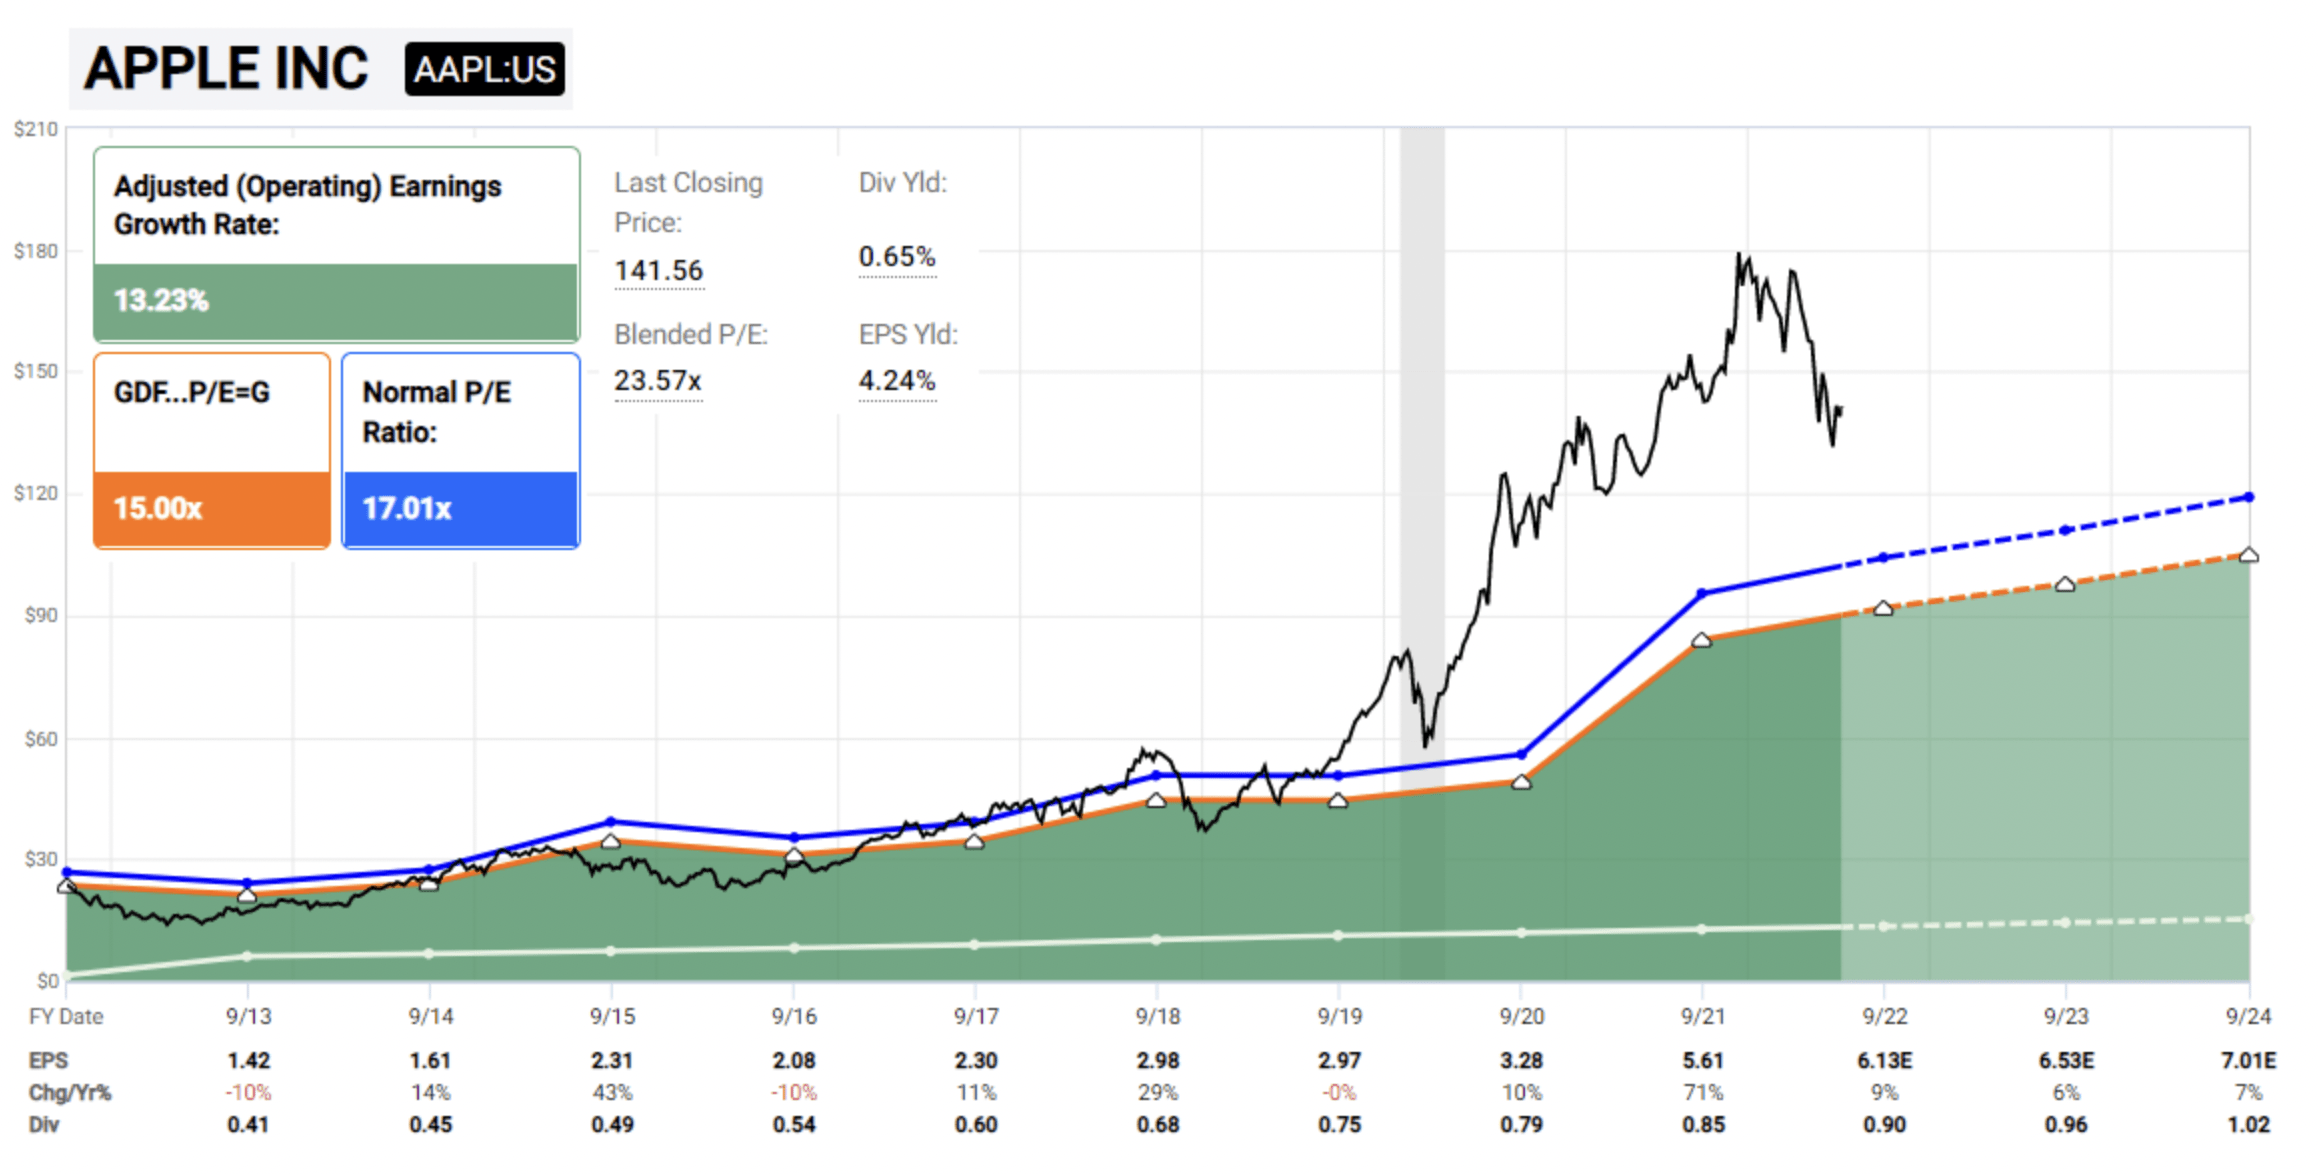
Lyn also added this amplified explanation of the current fundamental viewpoint:
The first couple weeks of July are some of the best periods seasonally for the stock market, partly due to quarterly rebalancing. Apple, being such a large part of most stock indices, would likely go along for the ride.
Additionally, with risk asset sentiment being so washed out, and market pricing of forward Fed hawkishness likely having peaked (the market is now expecting cuts in 2023 from their peak level in 2022), it gives risk assets a chance to rally.
In the longer run, however, I find it hard to have conviction on Apple in either direction, since I view their market as rather saturated, their valuation to still be on the rich side, and their Chinese supply chain exposure offering up substantial risk and potential relocation expenses going forward.
As we look out into the second half of 2022 and into 2023, the likelihood of economic malaise and lackluster earnings reports for a large swatch of companies is increasing. Individual stocks could of course surprise to the upside, but most leading indicators point to broad margin pressure for many companies.
As well, the technical viewpoint is now showing two possible paths shown in this updated chart:
MotiveWave
At this point, we must distill the information down, lest it become paralysis by analysis. And, this is where our main methodology of Elliott Wave gives us an extra edge in the decision-making process for traders and investors alike. As you can see in the above chart, the white path and the orange path as illustrated both converge at a high point, perhaps sometime in the Fall of this year. That’s where the next pullback will be key and pivotal.
If AAPL is going to follow the white path, then the pullback will be choppy and corrective in its structure. That likely means 3 waves down in the ‘B’ wave of the larger [A] wave. A further confirmation would be once the ‘B’ wave completes, price should then form a micro 5 waves up from that ‘B’ wave low as ‘C’ of [A] initiates.
Should the orange path be dominant, then once the orange [B] finds its high, there should be a 5 wave decline from that point, a 3 wave bounce, and then another 5 wave decline.
Once we have confirmation of one path being more likely over the other via these structure of price, we will update our charts and trading plans accordingly.
In sum, we see AAPL as ripe for a corrective type move into the Fall of this year. These corrections also include rally structures. So, in fact, we see AAPL as likely to move higher into the latter part of this year. And, given our expectations for the two paths illustrated in the accompanying chart, once the most likely path presents itself, we will have a high-probability for a longer-term entry.
The highest probability points for that long-term entry are either the white ‘B’ wave low, perhaps toward the end of 2022, or the orange [C] wave low that may stretch out into mid-2023.
Another salient point to mention is that via our analysis of the structure of price, there are several short-term entry and exit points along both paths. These are regularly updated in Stock Waves.
AAPL is a favored and highly-followed issue. We believe that our fusion of fundamentals with technicals gives us an extra edge in trading and investing for this and many other like names. We have many other stocks that are in a better position to rally to new highs. Please follow our work as we continue to present it to the readership here.
——————————————————————
Why Elliott Wave?
Some may look askance at Elliott Wave. Frankly, I don’t blame them. Not all self-proclaimed Elliott Wave experts are truly such. This is not to disparage others. However, there are specific guidelines that the analyst should follow to obtain the desired result. We are looking to find high probability setups, these being short, medium, or long term in nature. It is our desire to provide high-quality, actionable analysis that keeps us on the right side of the market. We believe that our track record speaks to this.
We will provide our primary scenario as well as at least one alternative possibility. This is not an attempt to put forth so many scenarios that one of them must come true, and we proclaim victory, vigorously patting ourselves on the back. Please recognize that markets and the stocks of which they are comprised are non-linear, fluid, and dynamic in nature. We adapt in real time to what we’re given. As well, analysis will evolve and become even more clear as data fills in the chart. There will come a moment where the analyst can apparently even complete the sentence for the stock or market they observe.
One way of comparing our analysis is to that of a head coach of a football team and the staff that compose a game plan for their upcoming opponent. Many coaches even have 15 pre-scripted plays that they run at the beginning to see what the reaction of the opposing coach will be. As well, the game plan of each coach usually has provisos and possible adaptations given certain scenarios that can come up during the actual game.
The football coach must adapt to what’s given during the real game. It simply is not possible to stubbornly stick to one specific path when the facts in front of you change. We do the same in our analysis. There’s a likely path in the bigger picture. This is similar to it being likely that the superior team will come out victorious in any competition. We have our most likely scenario that we follow, but we also have an alternative to consider.
Being able to quickly adapt to changing landscapes is one of the hallmarks of Elliott Wave analysis, when correctly applied.
I would like to take this opportunity to remind you that we provide our perspective by ranking probabilistic market movements based upon the structure of the market price action. And if we maintain a certain primary perspective as to how the market will move next, and the market breaks that pattern, it clearly tells us that we were wrong in our initial assessment. But here’s the most important part of the analysis: We also provide you with an alternative perspective at the same time we provide you with our primary expectation, and let you know when to adopt that alternative perspective before it happens.
There are many ways to analyze and track stocks and the market they form. Some are more consistent than others. For us, this method has proved the most reliable and keeps us on the right side of the trade much more often than not. Nothing is perfect in this world, but for those looking to open their eyes to a new universe of trading and investing, why not consider studying this further? It may just be one of the most illuminating projects you undertake.
udra/iStock via Getty Images
Be the first to comment