

Lemon_tm
The table below shows daily gains in SPY ETF (SPY) larger than 4% since inception when the price was below the 200-day moving average.
SPY ETF Daily Gains Larger Than 4% With Price Below the 200-Day Moving Average (Price Action Lab Blog – Norgate Data)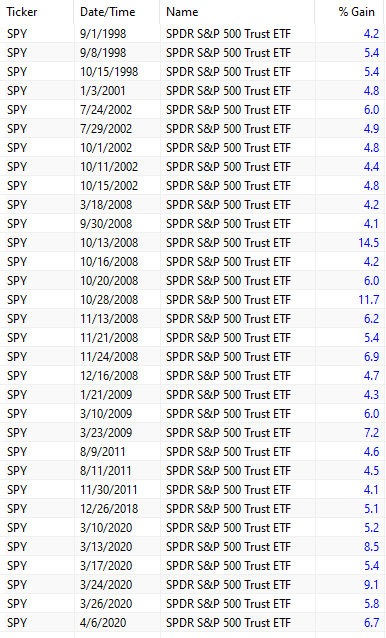
- During the dot-com bear market, there were 6 daily gains > 4%.
- During the GFC bear market, there were 13 gaily gains > 4%, with two occurring after the bottom.
- During the 2020 pandemic crash, there were 6 daily gains > 4%, with two occurring after the bottom.
The chart below shows all 32 daily returns larger than 4% with the price below the 200-day moving average, and also 8 returns larger than 4% with the price above the moving average.
SPY Daily Chart with Daily Return Larger Than 4% (Price Action Lab Blog – Norgate Data)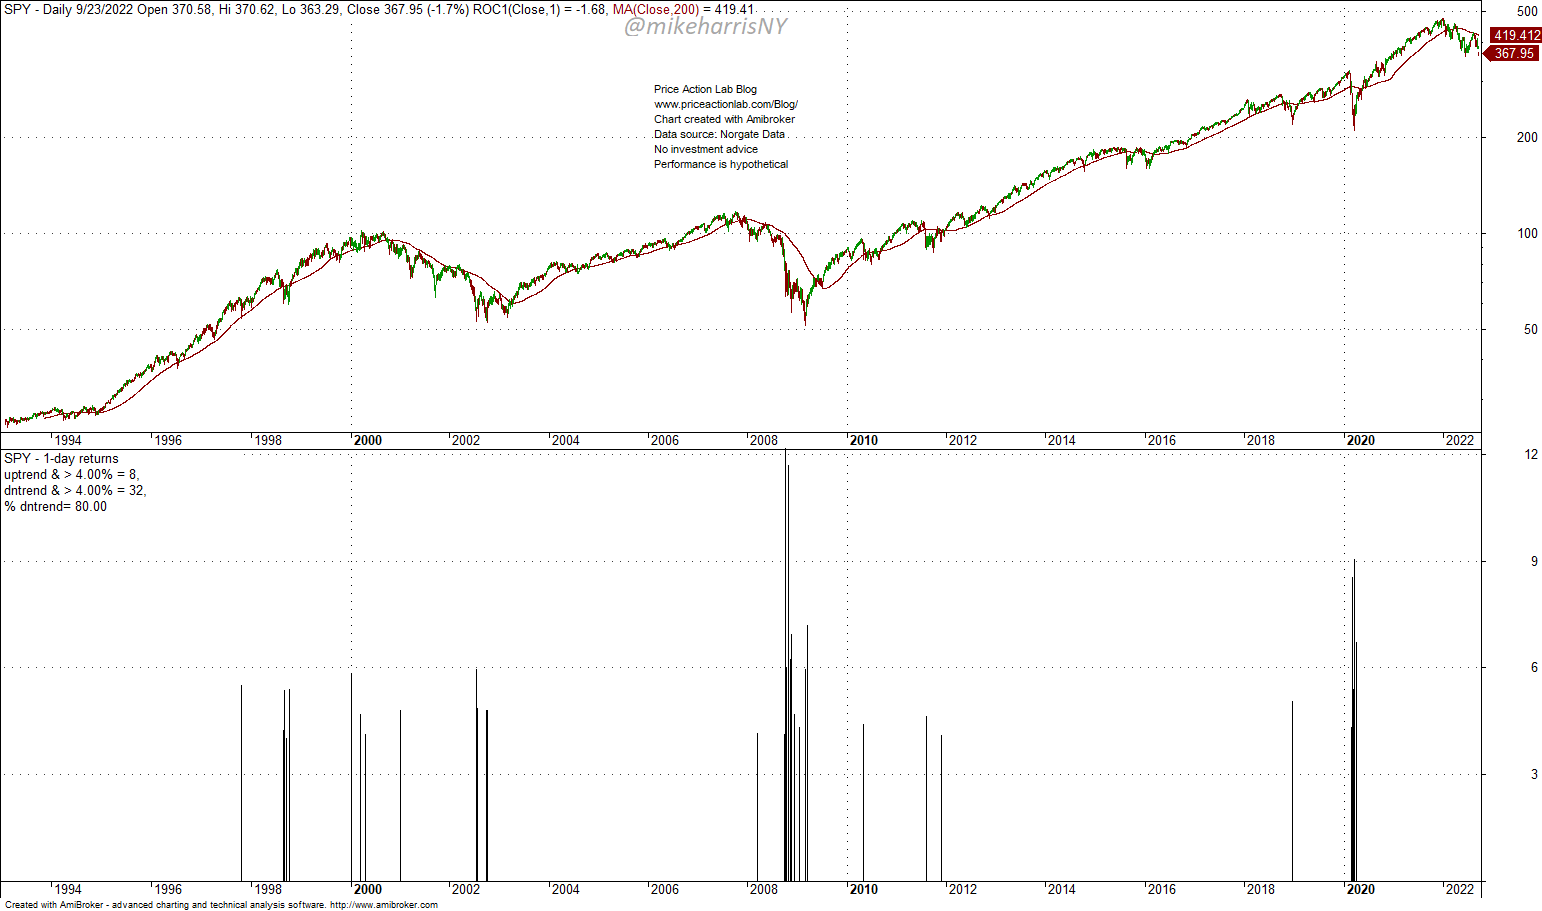
In the case of the QQQ ETF (QQQ), there were more daily gains > 6% during the dot-com bear market, and less during the GFC one.
QQQ ETF Daily Gains Larger Than 6% With Price Below the 200-Day Moving Average (Price Action Lab Blog – Norgate Data)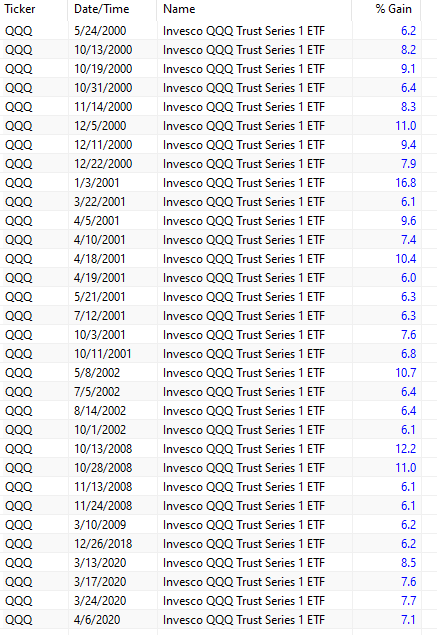
The chart below shows all 32 daily returns larger than 6% with the price below the 200-day moving average, and also 5 returns larger than 6% with the price above the moving average.
QQQ Daily Chart with Daily Returns Larger Than 6% (Price Action Lab Blog – Norgate Data)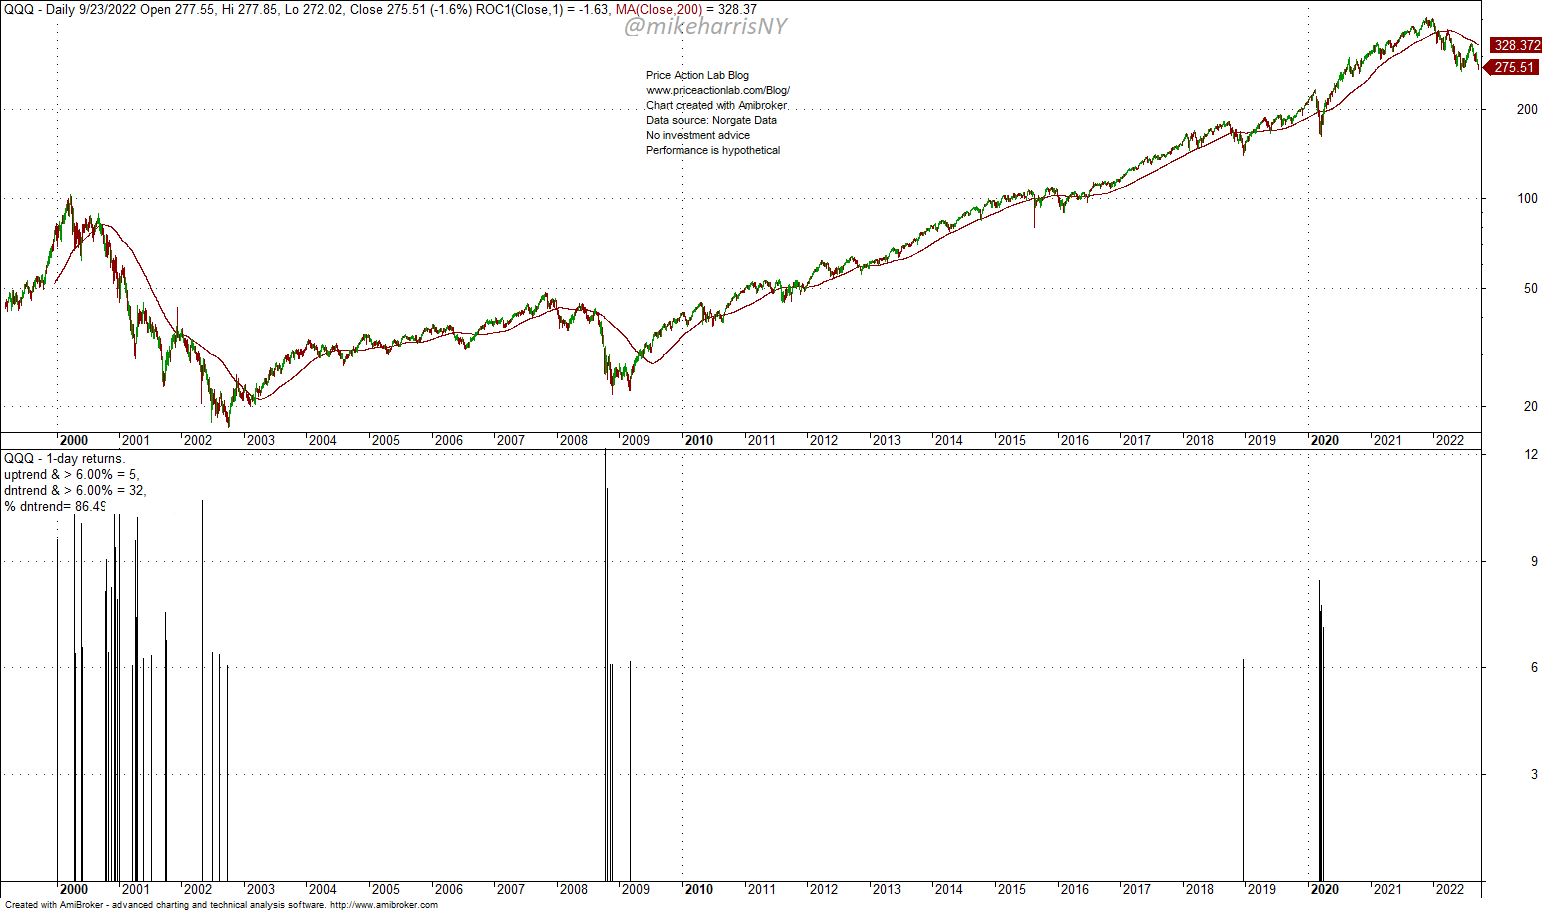
During previous bear markets and large corrections, both the S&P 500 and the NASDAQ-100 experienced strong daily relief rallies.
The market has been falling for nearly 9 months and we still have not seen a strong daily gain in major indexes. What is going on? Below are some possibilities:
- This is the initial phase of the bear market, and strong relief rallies will occur later.
- Due to options trading, large daily relief rallies are not occurring.
- Descriptive statistics of the past are being arbitraged out by algos.
1. In my opinion, this is the most probable explanation, also backed by technical analysis and a variety of indicators. See this recent SA article for more details.
2. This is another good attempt at an explanation, but there is a lot of hand-waving. Daily moves may be capped by dealer option hedging, but I have not read a convincing argument yet, only narratives involving options Greeks that offer no real explanation for what is happening in the market. However, this is a sound hypothesis in principle.
3. Strong daily relief rallies do not occur because algos sell those rallies to shake out weak hands. This is also possible in an algo-dominated market.
The lack of strong daily relief rallies could also be a combination of the above. One thing is certain: times change, markets change, the mix of market participants changes, and naturally, some of the things that occurred in the past may not occur again in the future, or at least with the same intensity as in the past.
Conclusion
Historical data shows that there is a lack of strong daily relief rallies in the stock market recently, but this may be due to a combination of factors.
I suspect the next relief rally will be exceptionally strong and will catch the bears by surprise. Making money by shorting the markets has proven to be a difficult, if not impossible task in the past. This year, shorting stocks has been profitable due to a slow “pain trade”. This may change going forward.
Be the first to comment