

Pgiam/iStock via Getty Images
I just gave a webinar to 300 real estate agents on what to expect in 2023. In the process of researching the data, we found a viewpoint on inflation and interest rates that guided us in our real estate forecast. I think it has value here too.
Quick Summary
We believe the sudden rise in the CPI is over and that inflation and interest rates will slowly return to much lower levels by next summer. It’s based on the idea that the CPI price index has experienced a “step function” that is now flattening out. Let me show you the evidence for this by presenting a few slides from that presentation.
(If this seems too basic and fundamental, I want to apologize but I’ve often found insight focusing just on fundamentals, so please stay with me).
The CPI and Inflation Rate
CPI and the Inflation Rate (Michael McDonald)
The chart above shows consumer prices in blue and the rate of change of those prices in red. The rate of change is the percentage price change over the past 12 months. The FED and economists don’t look at the absolute price level, they focus mostly on its rate of change.
Notice for the last three months that the CPI hasn’t changed much. It’s relatively flat. Yet the price change over the last 12 months is 8.2%. That’s because the 12 months include the prior nine months where in the CPI rose dramatically. If prices stayed flat for the next nine months, the twelve-month rate of inflation would slowly decline to zero. It would be a perfect, real-life example of what’s called a “step function.”
Inflation Step Function
Example of a Step Function (Michael McDonald)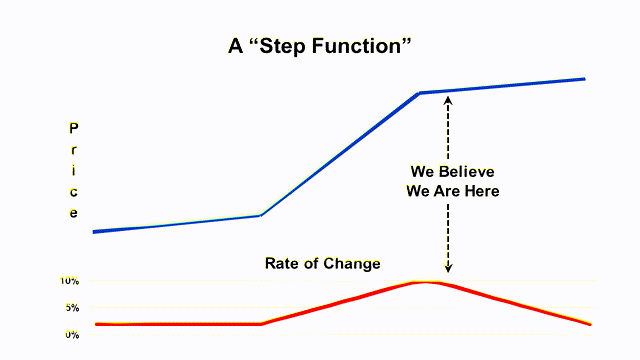
A step function is a sudden jump in price to a higher level over a short period of time. The price increase then ends as suddenly as it began. this graphic shows the step function in blue and in red the rate of change of price as it goes through the sudden start and stop. The rate of change is always slower to respond since it includes the prices before and after the sudden change. We believe we are going through a step function with inflation, and I’ve indicated where we think we are in the cycle. What’s the evidence for this?
The Evidence
Components of Inflation (U.S. Bureau of labor Statistics)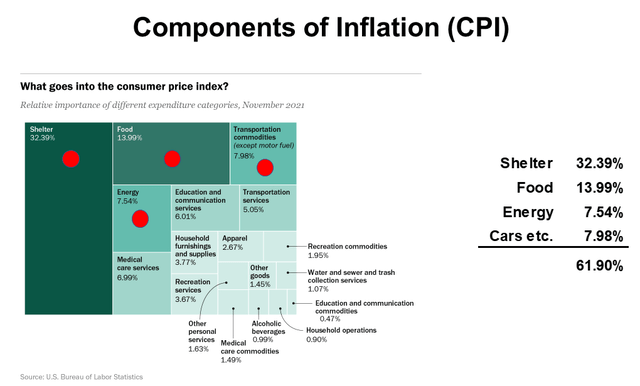
This schematic shows the different price components that make up the CPI and the percent that each contributes to the total. Sixty two percent of the CPI comes from 4 components – shelter, food, energy and cars. Shelter is the largest component at 32%, followed by food at 14%, then energy and cars both at a little over 7%. Let’s look at what each of these four components are doing.
Shelter
The Housing CPI (Michael McDonald)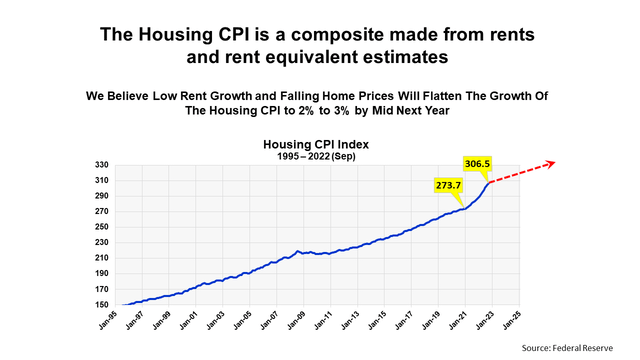
Shelter costs are a complicated calculation that includes numerous factors based on current rents and what a homeowner could rent his property for. Like the CPI index, the housing CPI shows a sudden price jump starting in January of 2021. The starting point is shown by the first yellow price marker. Since then, Shelter costs have risen 12% as of September.
It appears that this component is little slow in reacting, however, and is slightly behind in what is really happening. That’s because they cycle through and check current rents on set number of homes every six months on a rotating basis. Other up-to-date rental metrics we follow show that rents have already started to flatten. This is not yet apparent, however, in the official housing CPI index. No matter, we believe low rent growth and falling home prices will flatten the growth of the housing CPI to 2% to 3% by mid next year.
Rent Increases in LA County (Michael McDonald)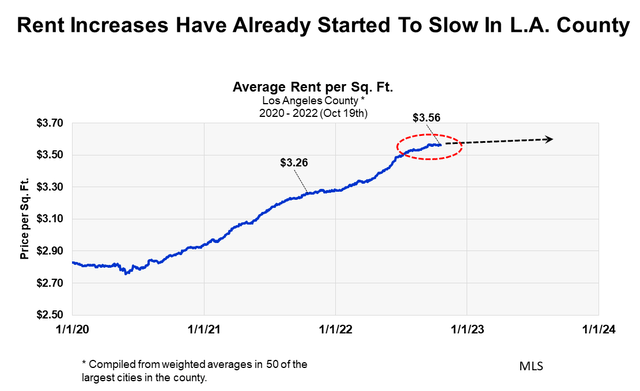
This chart shows average rents per square foot in the Los Angeles County. It clearly shows the distinct pattern of rents slowing over the last four or five months. While LA is a unique area and may not represent the entire country, we believe the pattern of slowing rent growth will occur in most regions going forward.
Used Car Prices
Used Car Prices (Michael McDonald)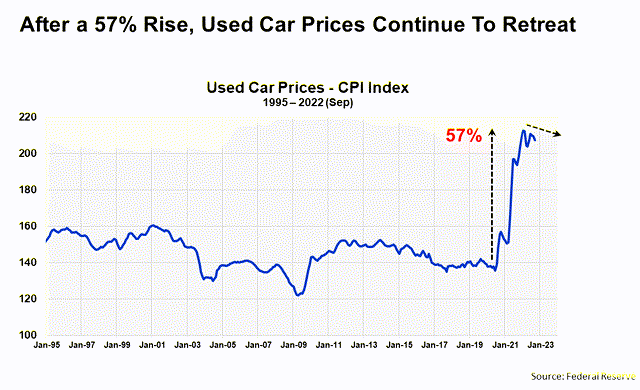
This chart plots the CPI index for used cars and shows the dramatic 57% price increase that occurred over two years. With cars accounting for 7% of the CPI, this increase had a large effect on the overall price increase of the CPI. Since the peak in used car prices, they have been slowly retreating. This now helps bring down the CPI slightly. Remember it’s not the absolute price that’s important but how it’s changing from moment to moment. Right now, used car prices, even though still high, are helping lower the inflation rate. By the way, this chart is the epitome of a step function.
Food Prices
The CPI Food Index (Michael McDonald)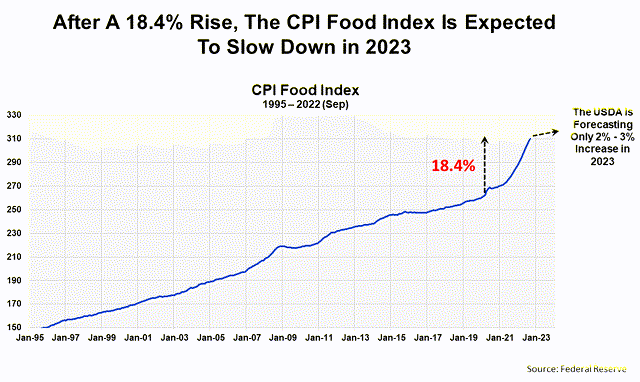
The CPI food index, which is made from a combination of grocer and restaurant prices, shows the same long-term pattern as the other CPI price indexes. There is a sudden rise in price beginning in January of 2021. This price index, however, shows no sign of slowing down yet. While agricultural commodities prices have turned down, it is not reflected yet at the retail level. However, the USDA is forecasting a price slowdown in the food index with increases of 2% to 3% in 2023.
Energy
Gasoline Prices (Michael McDonald)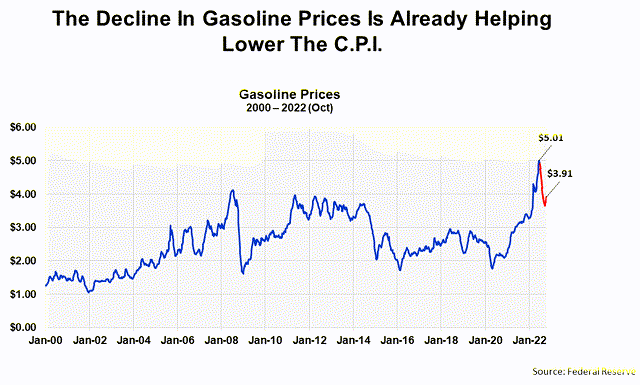
The energy CPI is primarily composed of the price of gasoline. As the chart shows, and everybody knows, there’s been a large, 20% drop in the price of gasoline over the last six months. This decline is now helping bring down the CPI index. Unless there is some global event that upsets this pattern, we fully expect gasoline prices to continue to decline, or at least stay flat at these levels.
Interest Rates
30 Year Mortgage Rates (Michael McDonald)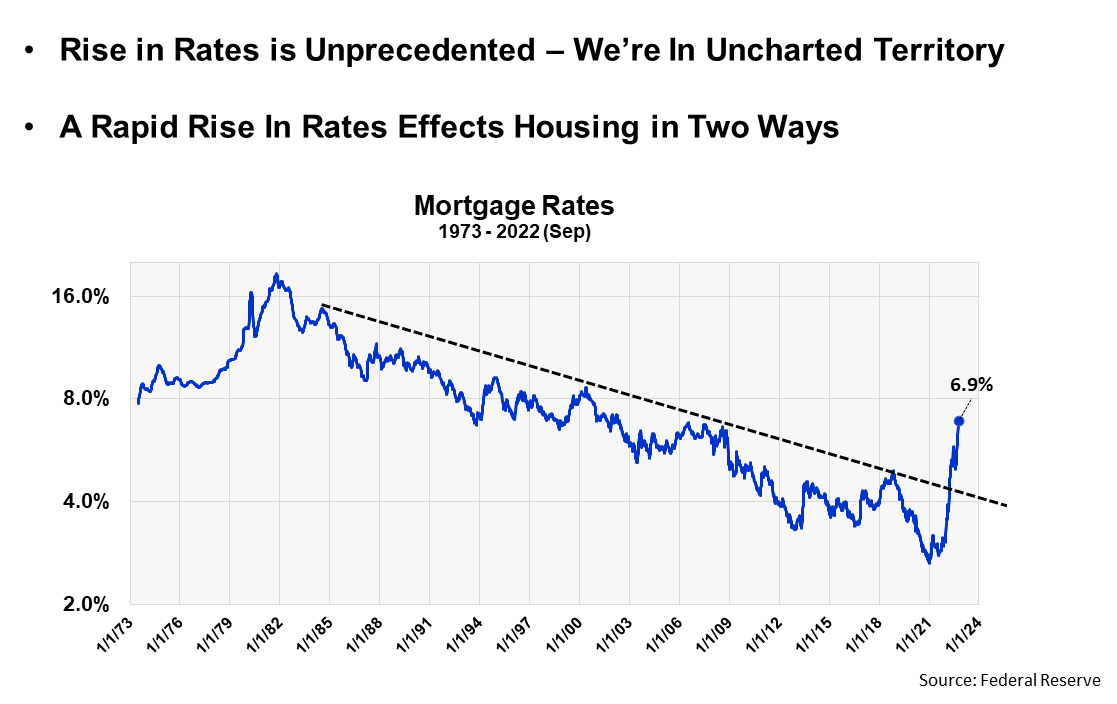
This is a graph of mortgage interest rates back to 1973. It’s a good proxy for the 10-year treasury yield since the two are closely related. The graph shows that the long decline in rates, which began in 1982, clearly ended a few months ago. History will look back and see that a mortgage rate of 2.65% was the lowest ever.
You may be interested in knowing what we meant when we said that the sudden rise in interest rates is affecting housing in two ways. The first way is obvious; there are fewer qualified buyers at these high rates. But the second is less obvious. The number of people listing their homes are down 16%. The turnover rate in housing is down. Few homeowners want to sell their current home with a low mortgage rate, then move and buy somewhere else at a much higher rate. Higher rates are freezing up the housing market on both sides.
This effect should lessen by mid next year if our scenario about inflation rates and interest rates materializes. We think mortgage rates will come back to 4.5% to 5%. Other AAA rated rates will also retreat but not back to their recent historic lows. Since interest rates are fundamental in the calculation of stock values, the net effect of this will be lower expectations for PE ratios going forward.
Summary
We think the data strongly supports the idea that the sudden rise in the CPI is over and that inflation and interest rates will gradually return to lower levels by next summer. If this proves correct, I think investor recognition of it will take place in stages over the next three months. But the Fed will see it too and we should also see a sudden policy shift in reaction to it. That would be the trigger. We’d be in a recession, rates would be ready to move down, and stocks, which always start up in the recession, would be 10% to 15% higher.
The extreme levels of bearish sentiment that we currently have suggests that stock prices will stay around current levels until this transpires.
Be the first to comment