

VioletaStoimenova/E+ via Getty Images
This article was published on Dividend Kings on Monday, December 19th.
———————————————————-
Christmas is a wonderful time to forget about work and focus on what matters, friends, family, and all the things that make life worth living.
But it can be a stressful time in terms of gift-giving. How many hours have you spent each year agonizing over what gifts to get your family? How often have you been disappointed by what you received yourself?
Holiday gift-giving is not that hard if you think through things logically, focusing on what matters and how to give your loved ones things that can make them happy.
Not just for a few years, but potentially for a lifetime. Today I want to highlight why Magellan Midstream (NYSE:MMP) is one of the best gifts you can give, even if it’s only to yourself.
Let me show you why this 8.5% yielding MLP (uses a K1 tax form) can help you lock in a potentially very safe 8.5% yield today while earning around 13% long-term Nasdaq-beating returns for decades to come.
In other words, I’ll show you why this is an 8.5% yielding gift that could keep giving for decades and ultimately provide you a rich retirement.
Magellan: An 8.5% Yield You Can Trust
Bottom line upfront.
- Magellan is an MLP and uses a K-1 tax form
- 5 Things All MLP Investors Need To Know
- typical foreign investors have a 37% withholding (whether they can recoup it depends on their country’s tax code)
Investor presentation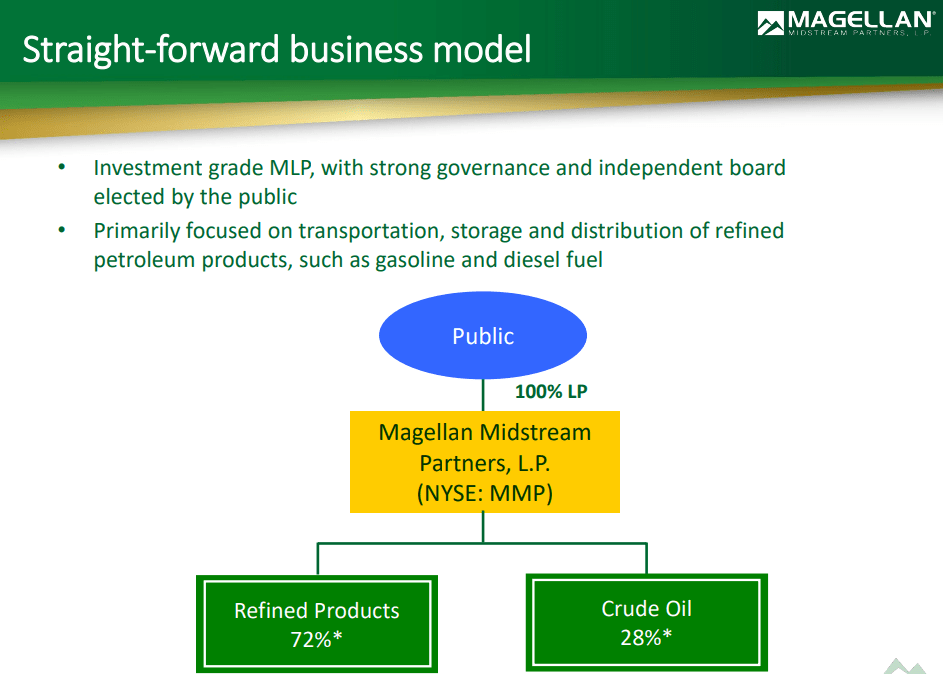
Magellan was one of the first MLPs to buy out its general partner and simplify its business model. In fact, it pioneered the self-funding business model for its industry and literally set the standard for rating agencies about a safe payout ratio for midstream.
- 1.2X coverage ratio = 82% DCF payout ratio
Investor presentation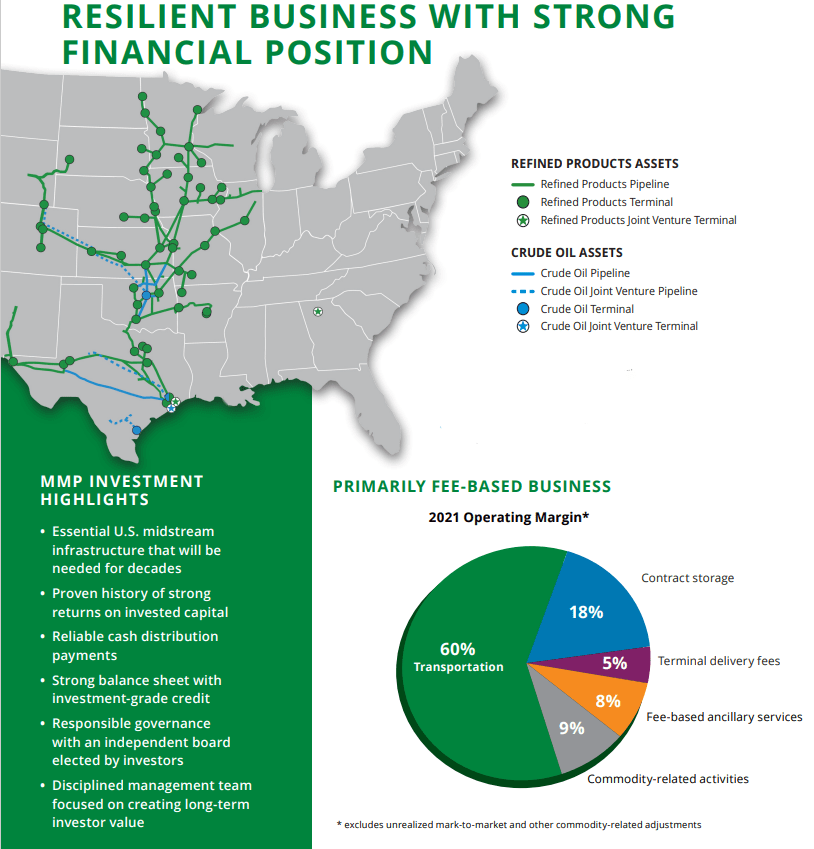
MMP’s core, wide moat business is its 11,000 miles of gasoline, diesel, and jet fuel pipelines that provide 15 states with 50% of their fuel. Is this a growth industry? Nope. In fact, fuel demand hasn’t grown in the midwest for many years. But that’s what makes its wide moat.
It would cost tens of billions to recreate MMP’s pipeline network, and since there is no demand growth, no one wants to do that. The MLP gets 2% to 3% annual rate increases approved by regulators, and none of its refiner customers ever complain since the rate hikes are tied to inflation.
In the high inflation, 2022, MMP was approved for a 6% pipeline price hike, and none of its customers have filed a complaint with regulators (FERC) in decades.
Investor presentation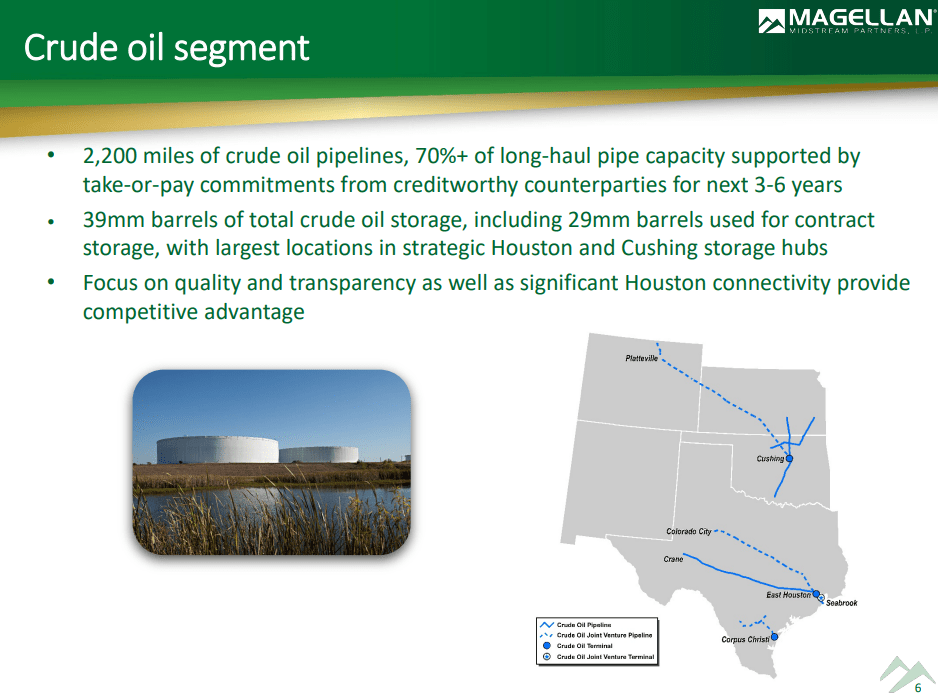
About 13 years ago, MMP began diversifying its business into crude pipelines because that’s where the growth opportunities were. Today, with reduced demand for new pipelines, MMP is focusing on oil exports, a thriving industry thanks to the Russian invasion.
It’s also cut back on growth spending overall and is pursuing one of the most aggressive buyback programs in the industry.
With a newly expanded $1.5 billion unit buyback in place, the partnership has already bought back over $1 billion in units since 2020. With $447 million in completed asset sales as of June 2022, we expect more buybacks in the year’s second half. We estimate debt/EBITDA will remain below 3.5 times, suggesting sizable capital return capacity while maintaining leverage at reasonable levels.” – Morningstar
$1.5 billion in buybacks might not sound impressive in a world where Apple can buy back $20 billion in a single quarter.
Ycharts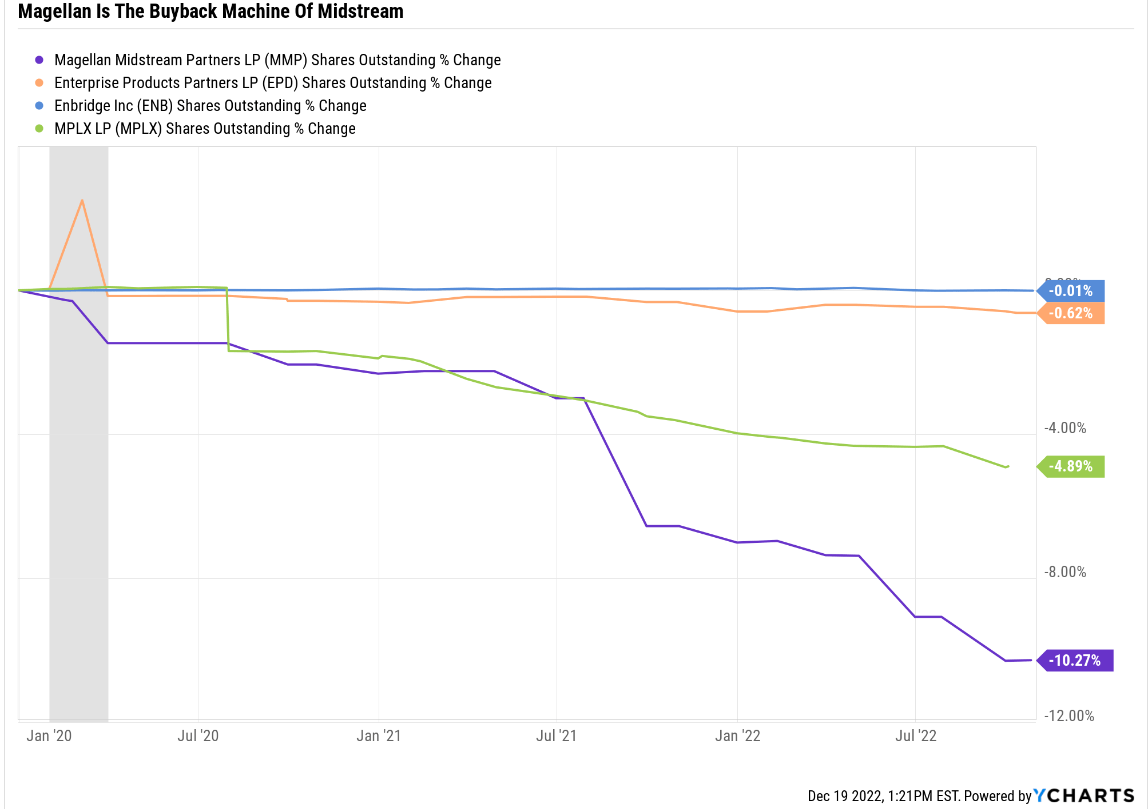
But remember that buybacks are new for midstream, and MMP has a $10 billion market cap. $1.5 billion goes a long way, and MMP has cut its unit found by 10% in the last two years.
And it’s done that while maintaining one of the safest balance sheets in the industry. In fact, at BBB+ stable, it’s tied with EPD, ENB, and TRP for the best credit rating in midstream.
By the end of 2023, analysts expect MMP’s debt/EBITDA or leverage ratio to be 2.9, down from a very safe 3.5 today. For context, rating agencies consider 5.0X or less leverage safe for midstream, though rating agencies want to see 4.0X or less for MMP. Why? Because it tends to use short-term (1 to 3-year) contracts for its core business, while peers can have contracts that run for 15 to 25 years (up to 50 years in the case of ENB).
But shorter contracts aren’t necessarily unsafe since MMP has a virtual monopoly on refinery pipelines in many of its markets.
Investor presentation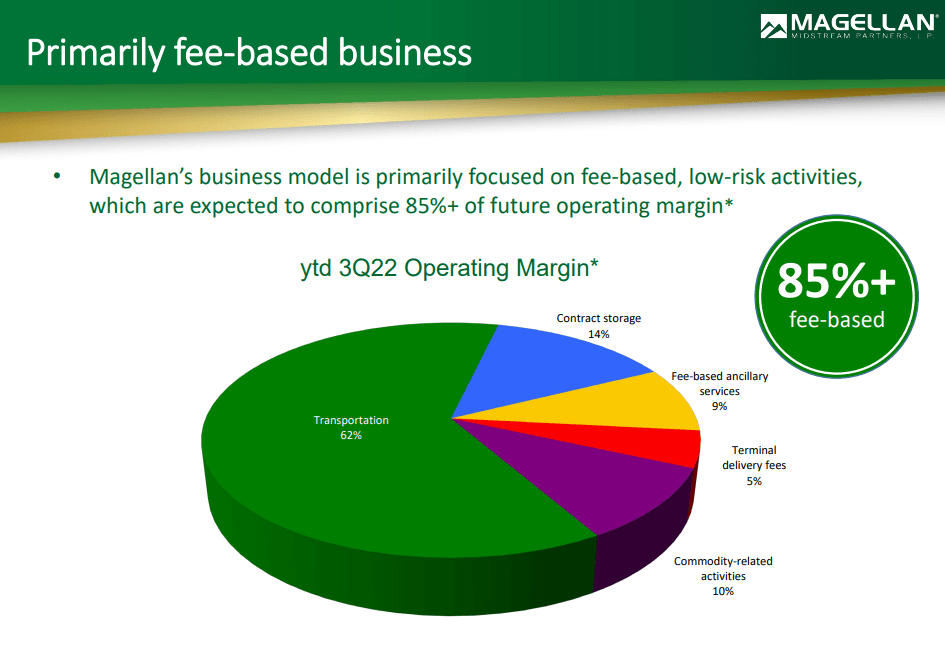
With just 10% of cash flow sensitive to commodity prices, and management using hedging to stabilize cash flow, even more, MMP is an energy utility for its customers.
Investor presentation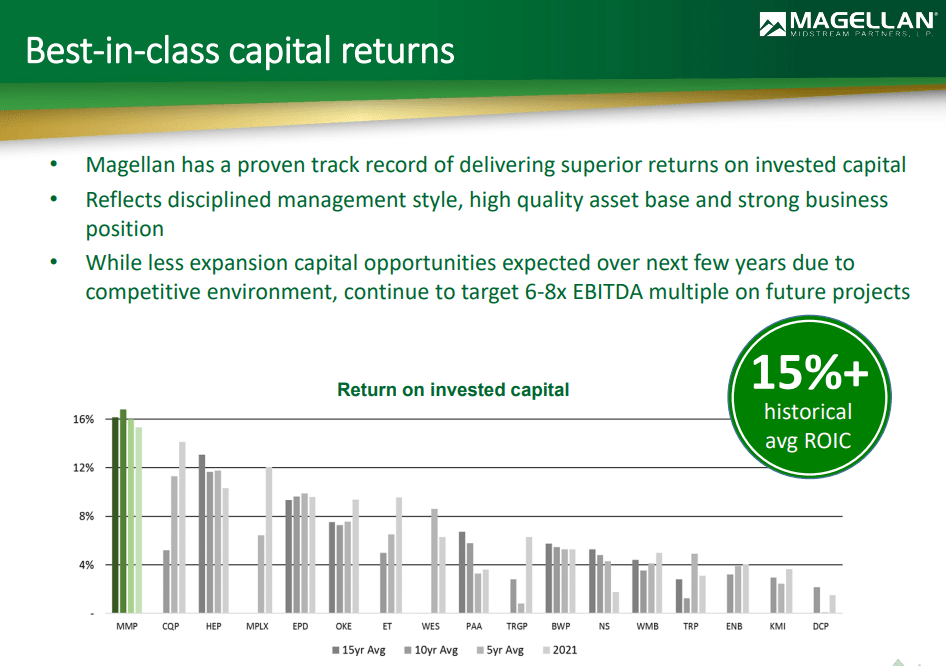
One that has enjoyed the highest returns on invested capital in the industry for over 15 years.
What does that actually mean for income investors?
- a 38% free cash flow margin
- in the top 5% of all companies on earth
Almost 40 cents of every dollar in revenue drops straight to the bottom line for MMP. That’s what pays the 8.5% distribution, which is tax-deferred until you sell it.
Investor presentation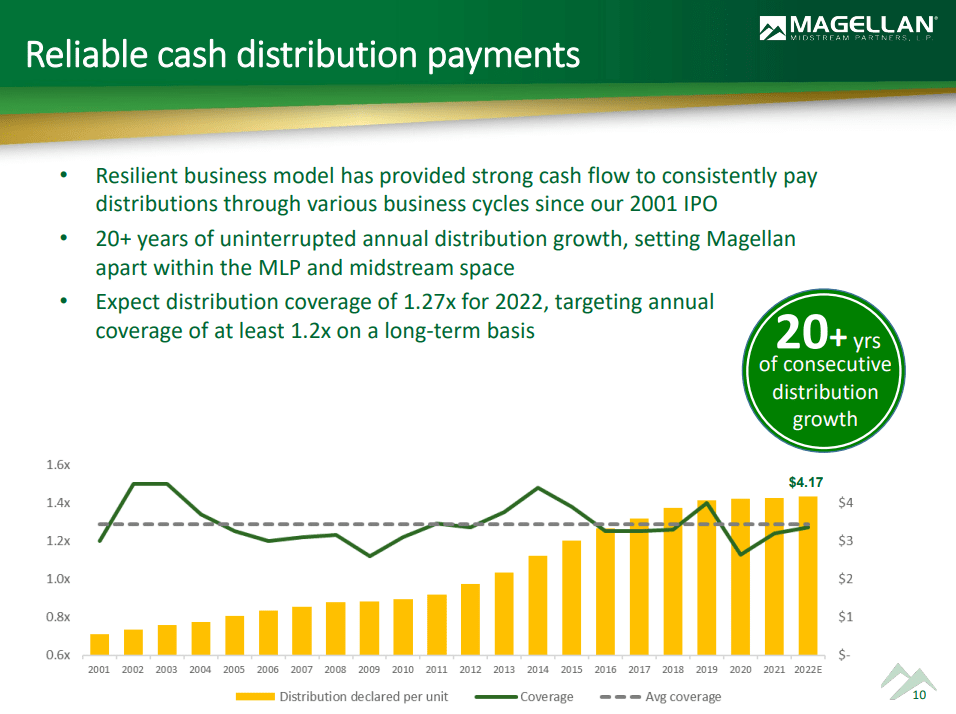
MMP has a 21-year payout growth streak ever since it went public in 2001.
Wells Fargo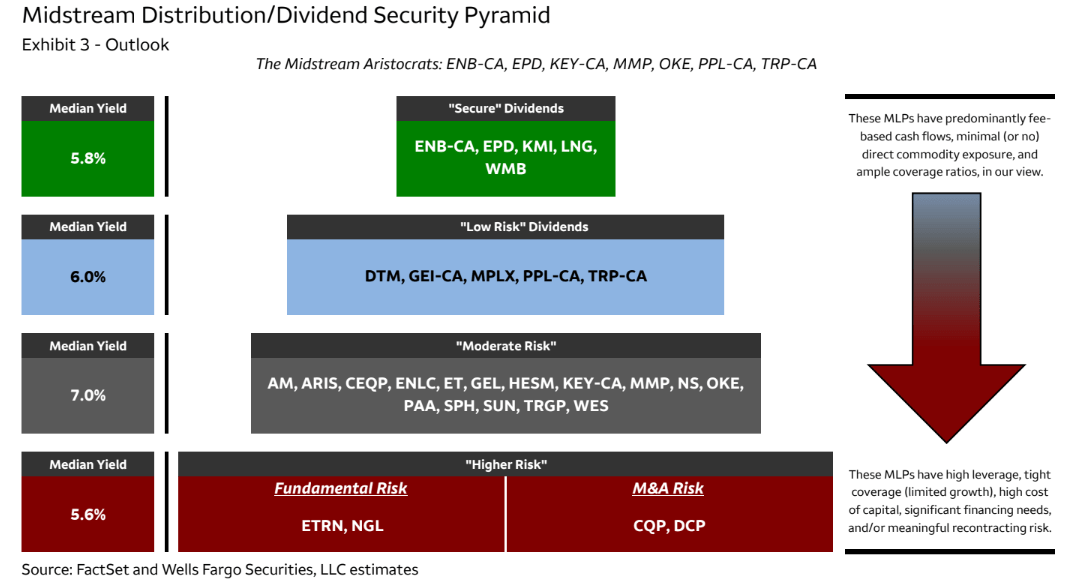
Wells Fargo considers MMP one of its midstream aristocrats, the safest of the safe in this industry.
That’s not just thanks to MMP’s impeccable track record of raising its payout every year but also due to its industry-leading low leverage.
Investor presentation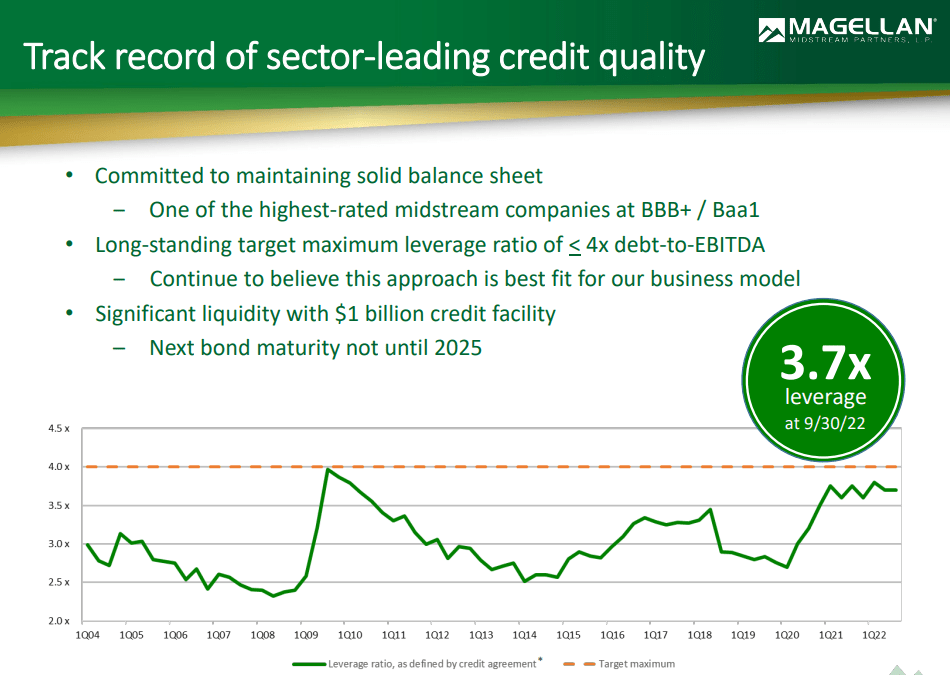
In the past, many MLPs went crazy with leverage, using scary amounts of debt to try to grow like a weed and also fund a lot of growth with stock. For example, Kinder Morgan (KMI) hit a peak leverage of 8.5 in 2014, just before the bottom fell out of oil prices.
MMP has never gone above four since that’s what rating agencies want to see to maintain the strongest credit rating in the industry. In fact, it’s company policy that MMP’s leverage ratio must never rise above 4.
MMP has no bonds maturing until 2025, long after the mild recession is expected to end. It has $1.94 billion in liquidity today, which might not sound like much. But remember, MMP is small, and it barely spends anything on growth.
FactSet Research Terminal 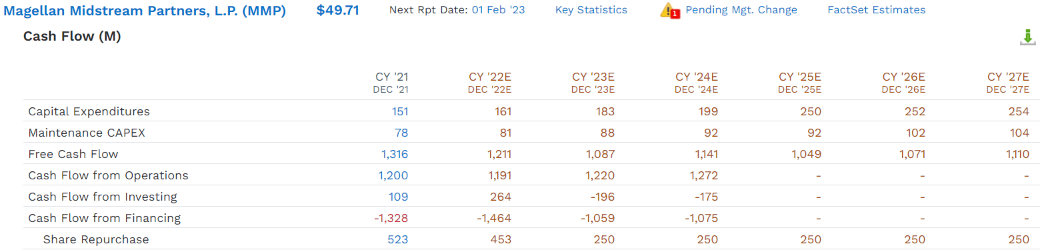
MMP spends about $250 million annually on maintaining and growing its pipeline assets and generates over $1 billion in free cash flow.
- It spends $860 million on distributions
Management targets an 82% DCF payout ratio, and next year analysts expect the payout ratio to be 73%.
More impressively, it’s not just self-funding; it’s free cash-flow self-funding.
- self-funding = no reliance on the stock market to fund growth
- FCF self-funding = no reliance on equity or debt market to fund growth
MMP is generating $250 million more in annual free cash flow than it costs to run the business, grow it, and pay its steadily growing 8.5% yielding distribution.
Analysts expect that to go to funding an annual buyback rate of approximately 2.5% per year at current valuations.
Investor presentation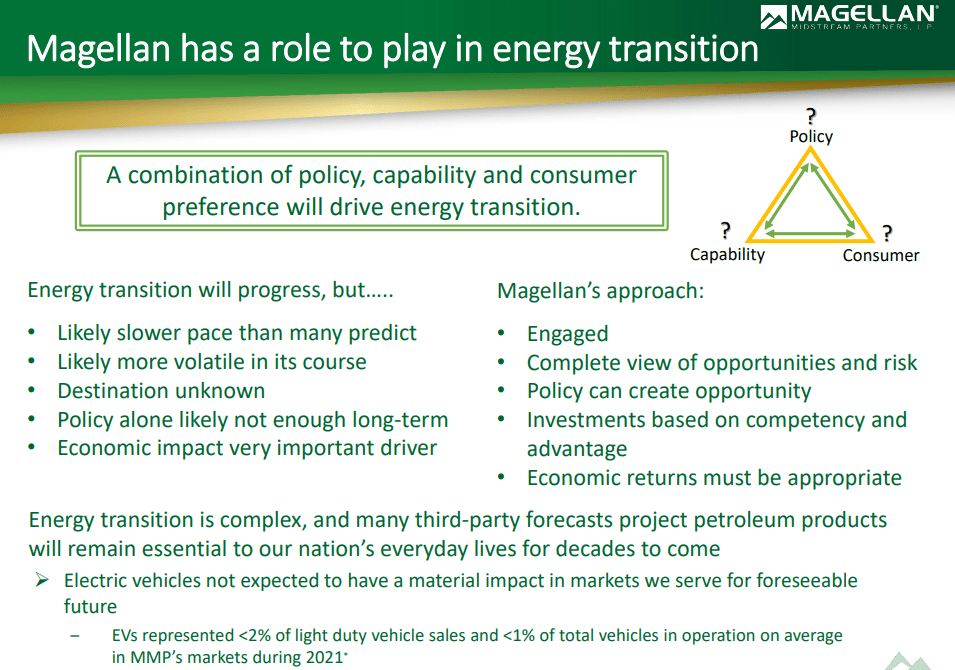
MMP’s energy transition plans are based around biofuels since its core business is refined product pipelines.
MMP’s core business is diesel fuel for big trucks, which the EV transition is expected to take a long time to impact. In fact, according to the Energy Information Administration, demand for MMP’s pipelines isn’t expected to decline through even 2050.
Investor Presentation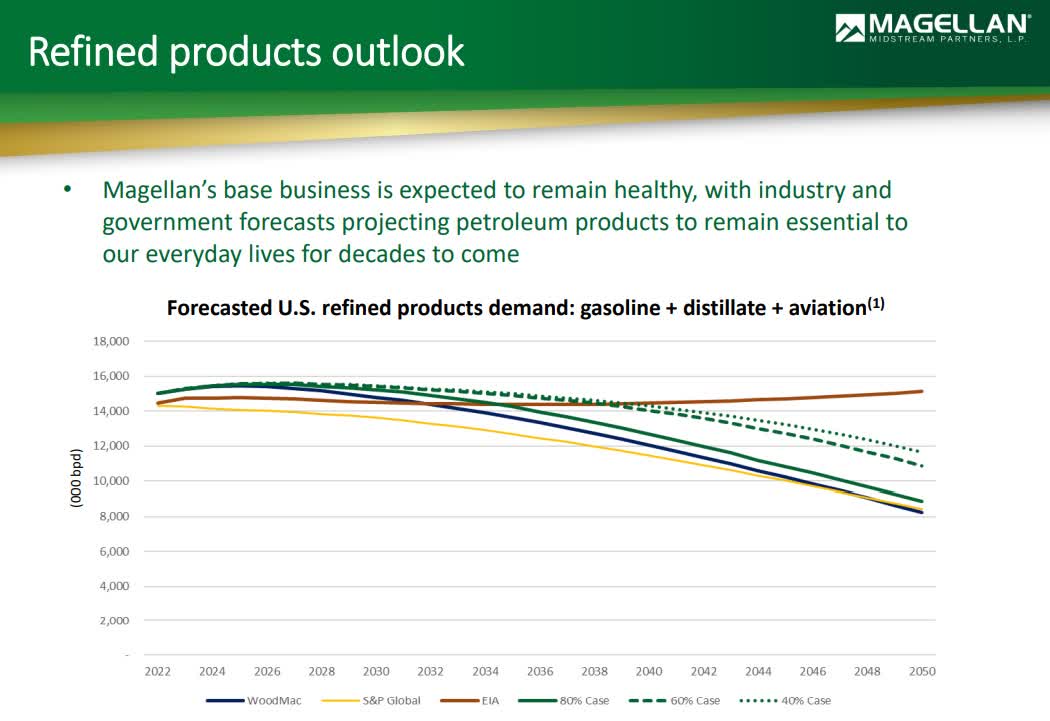
Mind you, that’s an outlier estimate, which is why S&P considers its long-term risk management to be 13th percentile.
- S&P estimates demand for refined products will decline by close to 50% by 2050
That forecast is consistent with other analysts first, such as Wood Mackenzie.
How worried are rating agencies or the bond market about MMP’s business stability?
- Moody’s and S&P rate it BBB+ stable
- both consider its long-term risk management to be negative (Moody’s “moderately negative.”
The bond market is willing to lend MMP millions in bonds that will mature in 2050 at reasonable rates.
A Wonderful Midstream Blue-Chip At A Good Price
(Source: FAST Graphs, FactSet Research) (Source: FAST Graphs, FactSet Research) (Source: FAST Graphs, FactSet Research)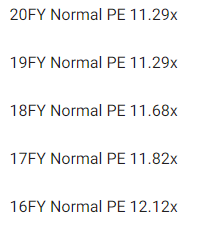
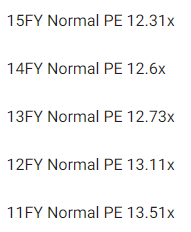

Over the last 20 years, outside of bubbles and bear markets, tens of millions of investors have consistently paid 11X to 13.5X cash flow for MMP.
- 91% statistical probability that this is the fair value range for MMP
| Metric | Historical Fair Value Multiples (16 years) | 2021 | 2022 | 2023 | 2024 | 2025 |
12-Month Forward Fair Value |
| 5-Year Average Yield | 7.93% | $52.08 | $52.84 | $52.84 | $53.85 | $54.10 | NA |
| Operating Cash Flow | 12.73 | $69.25 | $69.51 | $75.49 | $78.29 | NA | NA |
| Average | $59.45 | $60.04 | $62.16 | $63.81 | $54.10 | $62.16 | |
| Current Price | $49.54 | ||||||
|
Discount To Fair Value |
16.67% | 17.48% | 20.31% | 22.36% | 8.43% | 20.31% | |
|
Upside To Fair Value (Including Distributions) |
20.01% | 21.19% | 25.48% | 28.80% | 9.20% | 33.94% | |
| 2022 OCF | 2023 OCF | 2022 Weighted OCF | 2023 Weighted OCF | 12-Month Forward OCF | 12-Month Average Fair Value Forward P/OCF |
Current Forward OCF |
|
| $5.46 | $5.93 | $0.00 | $5.93 | $5.93 | 10.5 | 8.4 |
MMP is worth about 10.5X cash flow and trades at a solid 20% discount at 10.2X cash flow. It offers a 34% upside to fair value, including the 8.5% yield.
| Rating | Margin Of Safety For High Risk 11/13 Blue-Chip (Sleep Well At Night) Quality Companies | 2022 Fair Value Price | 2023 Fair Value Price | 12-Month Forward Fair Value |
| Potentially Reasonable Buy | 0% | $60.04 | $62.16 | $62.16 |
| Potentially Good Buy | 20% | $48.03 | $49.73 | $49.73 |
| Potentially Strong Buy | 30% | $42.03 | $43.51 | $43.51 |
| Potentially Very Strong Buy | 40% | $28.82 | $37.30 | $37.30 |
| Potentially Ultra-Value Buy | 50% | $30.02 | $31.08 | $31.08 |
| Currently | $49.54 | 17.48% | 20.31% | 20.31% |
| Upside To Fair Value (Including Dividends) | 29.64% | 33.94% | 33.94% |
Given its slow green energy transition, I’d like to see a 20% margin of safety to consider MMP a potentially good buy. At a 13% discount, it’s a potentially reasonable buy for anyone comfortable with its risk profile.
Long-Term Return Potential Consensus
| Investment Strategy | Yield | LT Consensus Growth | LT Consensus Total Return Potential |
| Magellan Midstream Partners | 8.5% | 4.3% | 12.8% |
| REITs | 3.9% | 6.1% | 10.0% |
| Schwab US Dividend Equity ETF | 3.4% | 7.6% | 11.0% |
| 60/40 Retirement Portfolio | 2.1% | 5.1% | 7.2% |
| Dividend Aristocrats | 1.9% | 8.5% | 10.4% |
| S&P 500 | 1.7% | 8.5% | 10.2% |
| Nasdaq | 0.8% | 10.9% | 11.7% |
(Source: DK Research Terminal, FactSet, Morningstar, Ycharts)
MMP’s growth is expected to come primarily from buybacks in the future, helping it generate modest 4.3% growth. But a safe 8.5% yield means potentially close to 13% long-term returns, which is more than the S&P, aristocrats, and even the Nasdaq.
But you don’t have to wait for decades to earn great returns from Magellan.
Magellan Midstream Consensus 2024 Total Return Potential
(Source: FAST Graphs, FactSet)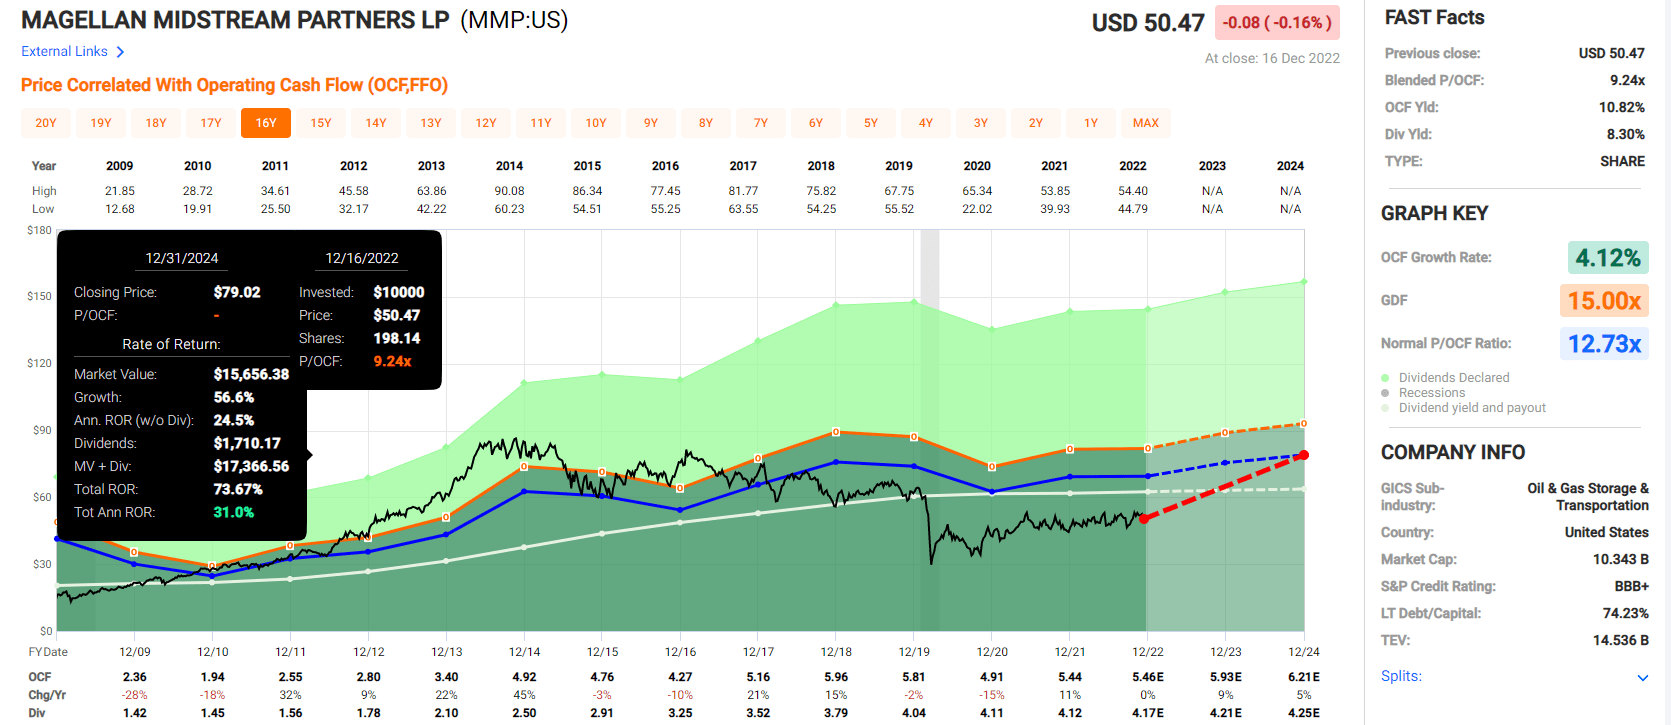
If MMP grows as expected and returns to historical fair value, it could deliver 74% returns over the next two years or 31% annually.
Magellan Midstream Consensus 2028 Total Return Potential
(Source: FAST Graphs, FactSet)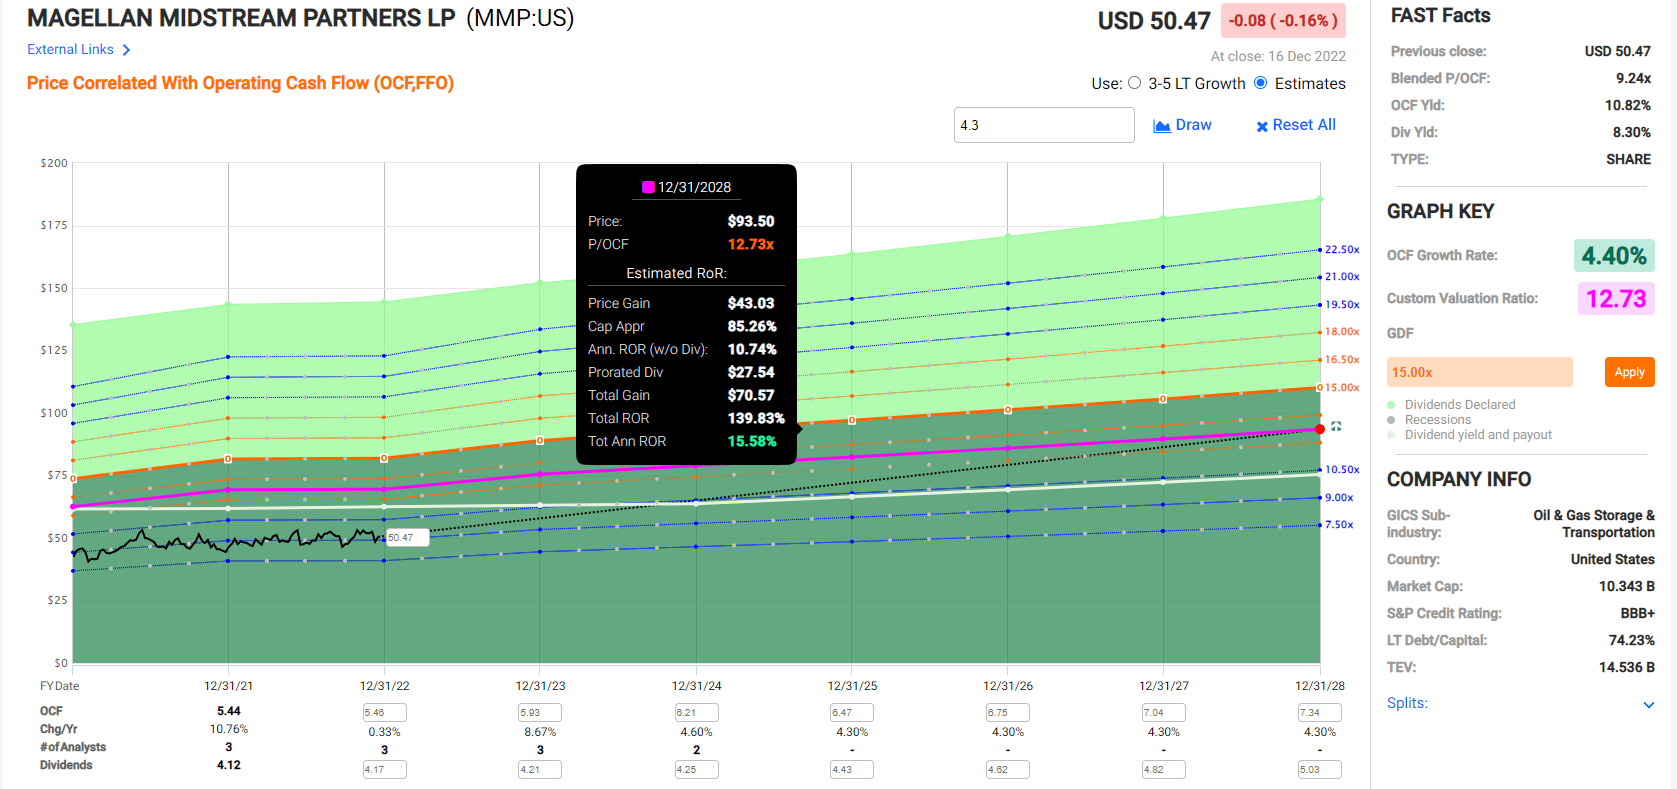
If MMP grows as expected and returns to historical value in the next five years, it could deliver 140% returns or 16% annually.
Magellan Midstream Investment Decision Score
Dividend Kings Automated Investment Decision Score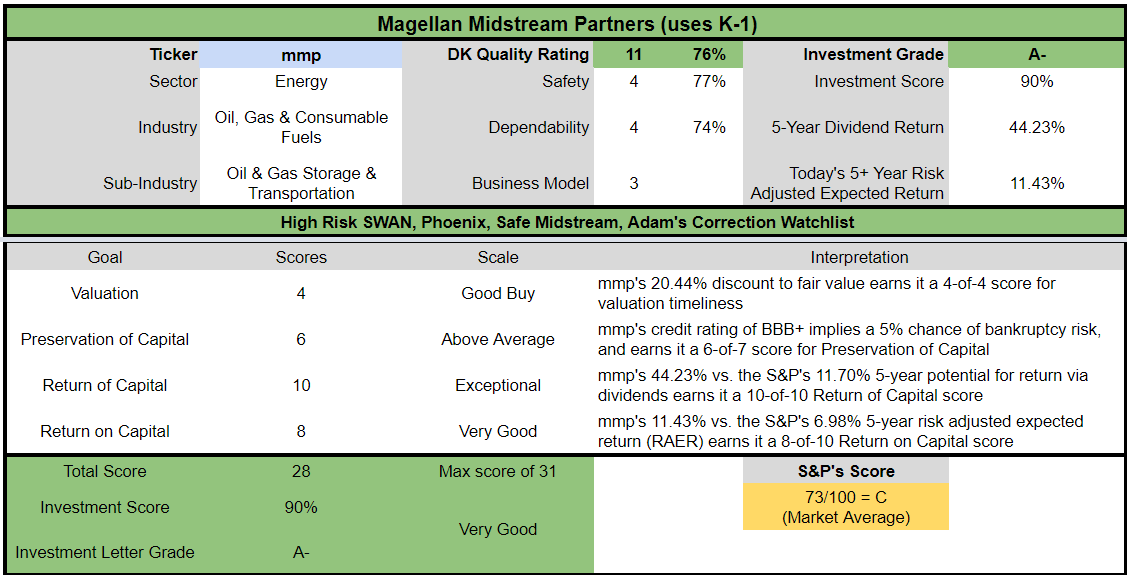
For anyone comfortable with its risk profile, MMP is a potentially very good ultra-yield blue-chip option right now.
- 20% discount to fair value Vs. 1% S&P = 19% better valuation
- 8.5% safe yield vs. 1.7% S&P (5X higher and safer yield)
- 12.8% higher annual long-term return potential vs. 10.2% S&P
- 2X higher risk-adjusted expected returns
- 4X the consensus 5-year income
Bottom Line: 8.5% Yielding Magellan Is The Gift That Could Give You A Rich Retirement
Let me be clear: I’m NOT calling the bottom in MMP (I’m not a market-timer).
MMP could fall hard and fast if the market sells off in early 2023.
Fundamentals are all that determine safety and quality, and my recommendations.
- over 30+ years, 97% of stock returns are a function of pure fundamentals, not luck
- in the short-term, luck is 33X as powerful as fundamentals
- in the long-term, fundamentals are 33X as powerful as luck
While I can’t predict the market in the short term, here’s what I can tell you about MMP.
- One of the potentially highest quality, safest, and most dependable deep value, ultra-yield blue-chips on earth.
- 8.5% very safe yield, growing at about 1% over the coming years
- 12.8% CAGR long-term total return consensus, better than the Nasdaq, aristocrats, S&P 500, SCHD, and REITs.
- 20% historically undervalued, a potentially good buy
- 8.4X cash flow (anti-bubble blue-chip)
- 140% consensus return potential over the next five years, 16% CAGR, about 3X more than the S&P 500
- 2X better risk-adjusted expected returns of the S&P 500 over the next five years.
- 4X better income potential over the next five years
If you’re looking for one of the possibly safest 8.5% yields on earth, Magellan is it.
If you’re looking for a way to potentially earn 30% annual returns for the next two years while enjoying a safe 8.5% yield on day one, Magellan fits the bill.
If you’re looking for a Christmas gift that keeps on giving, year after year, in good times and bad, then Magellan Midstream could be just the Santa blue-chip bargain you want this holiday season.
From everyone at Dividend Kings and iREIT, I want to wish you and yours a safe, healthy, and joyous holiday season:)
Be the first to comment