


Time for a portfolio checkup!
Ирина Мещерякова/iStock via Getty Images
Get ready for charts, images, and tables because they are better than words. The ratings and outlooks we highlight here come after Scott Kennedy’s weekly updates in the REIT Forum. Your continued feedback is greatly appreciated, so please leave a comment with suggestions.
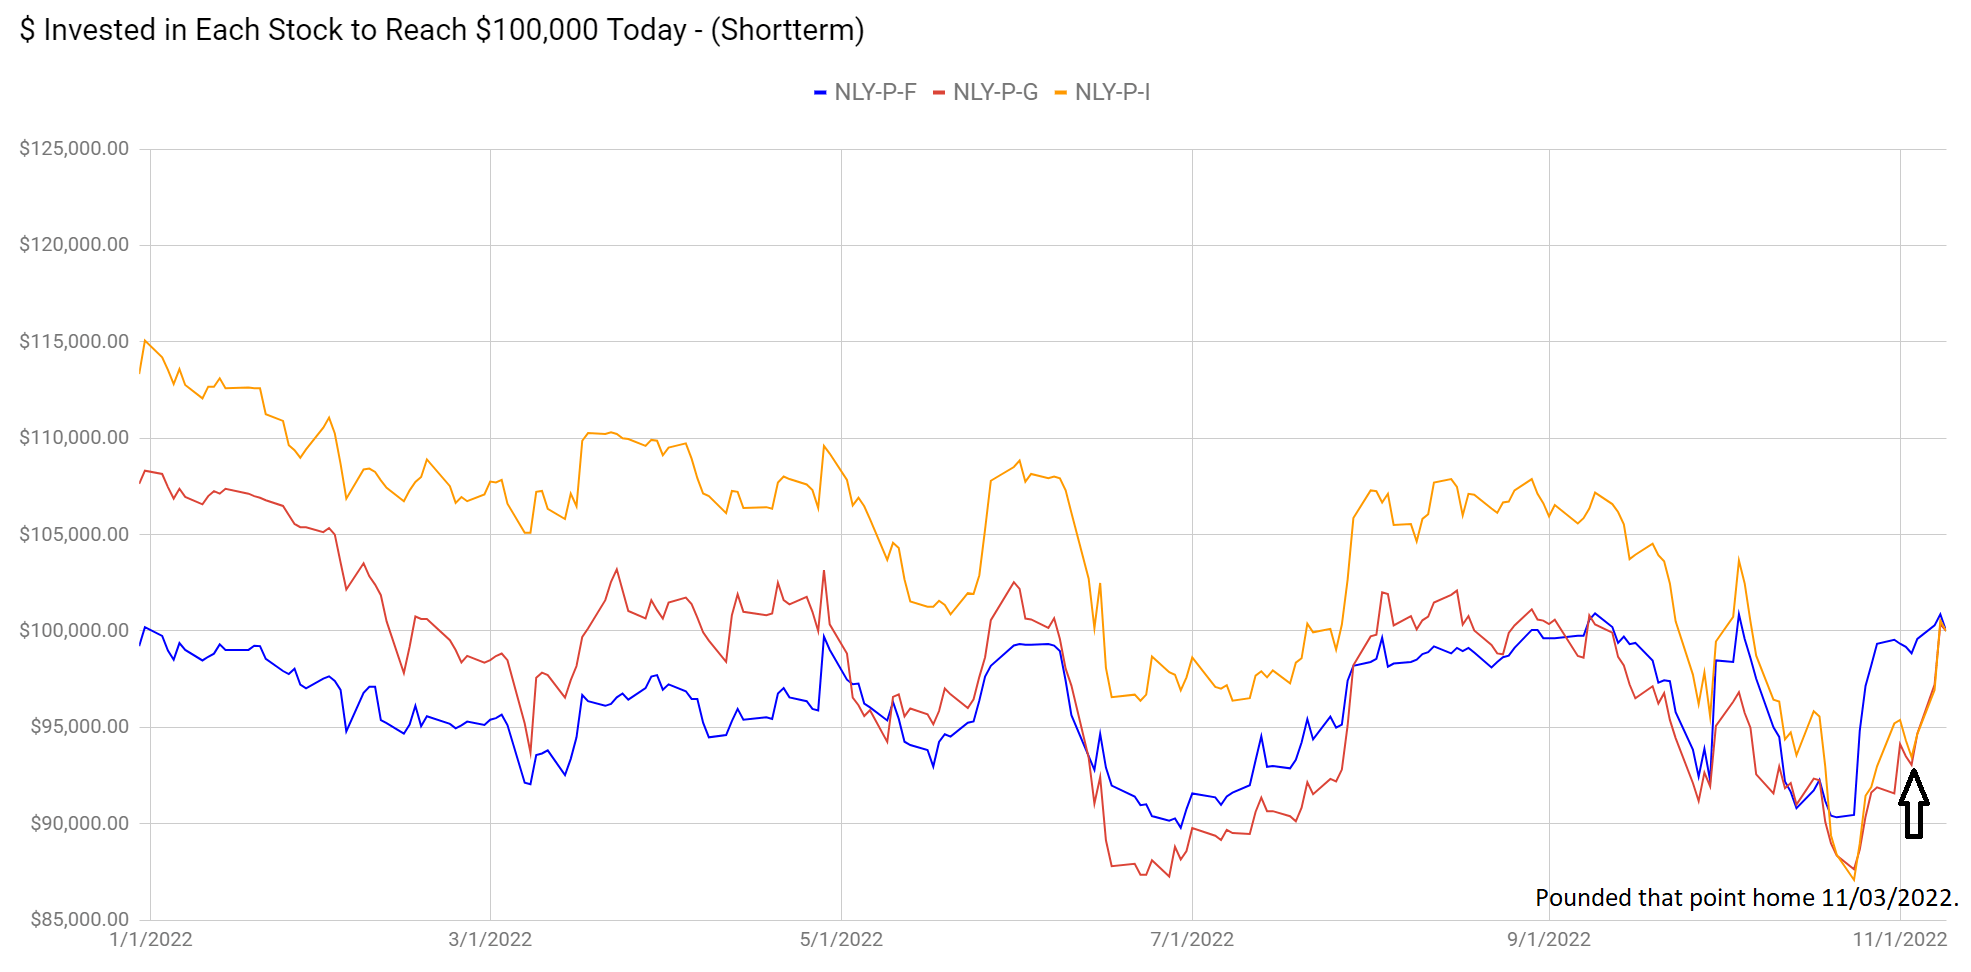
Lately we’ve been talking more about the gap between the preferred shares issued by AGNC Investment Corp. (AGNC) and Annaly Capital Management (NLY).
That gap has been giving investors an opportunity to trade between the shares. We demonstrated how to find that alpha in a public article on November 3rd, 2022. Since then, NLY-I and NLY-G outperformed NLY-F by about 6% in under a week:
The REIT Forum
Looks like the market got the message.
As it stands, relative valuation between NLY-G and NLY-F are about equal today. You can make an argument for one or another share by a slight margin depending on your expectation for future interest rates. That’s how it should be. That’s a more efficient market.
Congratulations to everyone who traded out of NLY-F to immediately lock in a better deal using NLY-G or NLY-I. Getting 6% in a week is pretty nice, especially if investors are rolling a thousand shares or more between positions. On a relative basis, NLY-I is still undervalued. However, the margin is significantly smaller following the route. Within the next 18 months we should see NLY-I outperform again based on the difference in cash flows.
We’re moving over to common shares. Time to talk about Main Street Capital Corp. (MAIN). MAIN reported earnings recently and Scott Kennedy provided an earnings assessment for subscribers. I’ll share part of his commentary here:
Hi subscribers. *I was able to review *MAIN’s* Q3 2022 earnings results.* MAIN’s Q3 2022 NII of $0.832 per share was a modest outperformance versus my projection of $0.770 per share. MAIN’s NII was $0.747 per share for the second quarter of 2022. As such, I projected a NII increase of $0.023 per share. In actuality, MAIN reported a NII increase of $0.085 per share during the third quarter of 2022. The institutional analysts’ consensus average was NII of $0.756 per share. As such, my projection was slightly more accurate when compared to the institutional analysts’ consensus average. Just to confirm, all marketplace service mREIT/BDC core earnings/NII projections were finalized on 10/7/2022-10/9/2022 and are never changed once finalized (unlike other analysts who change estimates after other sub-sector peers provide earnings estimates or reported results). That simply bolsters our reliability and credibility. Let us review MAIN’s income and expense accounts to reconcile the company’s modest NII outperformance during the third quarter of 2022.
Upon reviewing MAIN’s income statement, as generally anticipated, the company’s quarterly interest income increased when compared to the prior quarter. However, the level was enhancement was simply larger than I anticipated. Let us discuss why this occurred. MAIN had quarterly loan originations and add-on investments within the company’s lower middle market (“LMM”) and private loan sub-portfolios of $345 million during the third quarter of 2022. This was a very high quarterly figure. In comparison, I projected quarterly loan originations and add-on investments of only $225 – $275 million (mean of $250 million). MAIN recorded loan prepayments/repayments/restructurings within the company’s lower middle market (“LMM”) and private loan sub-portfolios of only ($87) million during the third quarter of 2022. In comparison, I projected quarterly prepayments/repayments/restructurings of ($150) – ($200) million (mean of ($175) million). When calculated, including scheduled principal payments, amortization, and fair market value (“FMV”) fluctuations, MAIN grew the company’s entire investment portfolio size by $256 million or 7% during the third quarter of 2022. Considering broader market volatility, this should be considered a modest-notable increase for just 1 quarter. In comparison, I projected MAIN would increase the company’s investment portfolio size by 0% – 5% (mean increase of 2.5%). So, simply put, a modestly larger increase when compared to my expectations.
In addition, MAIN experienced a quick rise in the company’s weighted average annualized yield during the third quarter of 2022 when compared to the prior quarter. Simply put, this was due to the continued rapid increase in LIBOR/SOFR/PRIME. This was correctly anticipated. MAIN reported a weighted average annualized yield of 9.45% and 10.59% for the second and third quarter of 2022, respectively. When calculated, this was a quarterly increase of 1.14%. In comparison, I projected a quarterly weighted average annualized yield increase of 1.10%. So, a very minor outperformance when compared to my expectations which added a bit of additional interest income. This metric should continue to increase during the remainder of 2022; a positive catalyst I have continued to point out back in 2021 before this trend started occurring. That said, it should be noted the higher LIBOR/SOFR/PRIME rises, the more underlying credit risk (non-accruals) needs to be respected (and monitored). This will have heightened importance heading into 2023.
The full review is around 4 to 5 times longer, but I think that preview contains more than you’ll expect to find anywhere else.
Scott also traded in the shares of MAIN recently by purchasing shares at $33.24 on 9/30/2022, collecting the $.22 dividend, and closing the position out at $39.50 on 11/4/2022. It was a quick 19.5%, which is far better than a poke in the eye.
Here are the alerts from our channel for trade alerts:
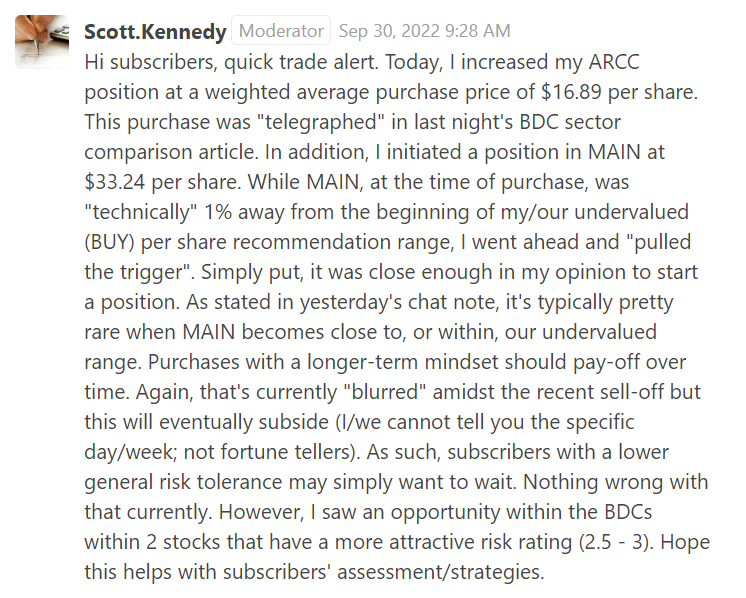
The REIT Forum
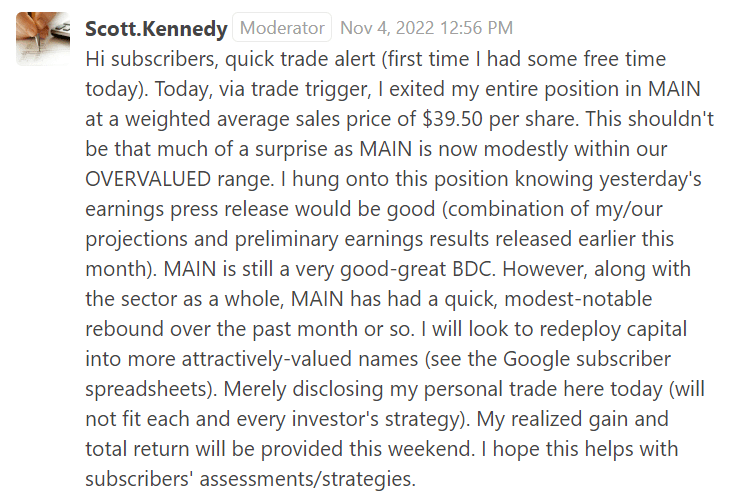
The REIT Forum
Those shares of Ares Capital Corp. (ARCC) aren’t doing too poorly either. They are up about 12.7% as of writing.
Moving over to one of the mortgage REIT common shares, we also had results from MFA Financial (MFA) recently. As before, I’ll share a small portion of his commentary:
Hi subscribers. I was able to review MFA’s Q3 2022 earnings results. MFA reported a GAAP BV as of 9/30/2022 of $15.31 per common share (6.8% decrease) versus my prior projection of $14.45 per common share (12.0% decrease). I consider this a modest – notable (at or greater than a 5.0% variance) and was slightly OUTSIDE my $13.90 – $15.00 per common share range.
When reviewing MFA’s investment portfolio, a couple minor surprises jumped out regarding the company’s origination and valuation fluctuations. With the Lima One Capital (Lima One) acquisition being finalized during the second half of 2021, MFA continued to originate residential whole loans. However, unlike the broader origination sector, MFA kept pretty good pace regarding the overall quantity of loans originated during the third quarter of 2022 when compared to the prior quarter. This was a bit of a surprise. For example, in one sub-sector, Lima One funded $425 million of business purpose loans during the second quarter of 2022. In comparison, Lima One funded $413 million of business purpose loans during the third quarter of 2022. As it simply was not a great environment during the third quarter of 2022 to originate loans/mortgages as credit spreads continued to notably widen, I was a bit surprised by this type of continued volume. Simply put, pricing pressure negatively impacts gain-on-sale margins. In addition, securitizing recent originations from late last year-early this year (which had very low-low coupons when compared to current market rates) added pressure to net spreads as the market quickly soured to rapidly-rising borrowing costs (demand for a product that would notably shrink net spreads is never high).
First, MFA’s investment portfolio largely performed as expected from a fair market value (“FMV”) perspective when compared to my expectations. This was mainly due to the valuation fluctuations of MFA’s residential whole loans. MFA’s total investment portfolio size decreased less than (1%) as of 9/30/2022 when compared to 6/30/2022 (when based on FMV). As such, quarterly originations and purchases were basically “matched” by portfolio run-off, sales, and declines in valuations. Due to volatility across financial markets during the third quarter of 2022, I largely correctly anticipated an overall investment portfolio fluctuation of (5.0%) – 0% (mean decrease of (2.5%)). MFA continued to mainly invest in residential whole loans but the fairly recent Lima One acquisition does add a bit on the origination and servicing side as well. With a relatively unchanged investment portfolio size, along with modest-severe FMV declines, MFA’s leverage increased from 3.3x as of 6/30/2022 to 3.6x as of 9/30/2022 (when excluding all “to-be-announced” [TBA] mortgage-backed securities [MBS] positions; position of $0 as of 9/30/2022). This should continue to be considered modest leverage in the current hybrid mREIT sub-sector environment.
As before, this is a small chunk of the total review. But it covers some of the major factors.
Outlooks
Bullish on MFA. Shares put together a huge rally from their 52-week low, but still have a substantial discount to current estimated book value.
We’re expecting NLY-I to outperform NLY-F and NLY-G over the next year, though we can’t nail down precisely when that happens. The cash flow picture still favors NLY-I as the superior choice. The prior article explained this concept a bit more.
Stock Table
We will close out the rest of the article with the tables and charts we provide for readers to help them track the sector for both common shares and preferred shares.
We’re including a quick table for the common shares that will be shown in our tables:
Let the images begin!
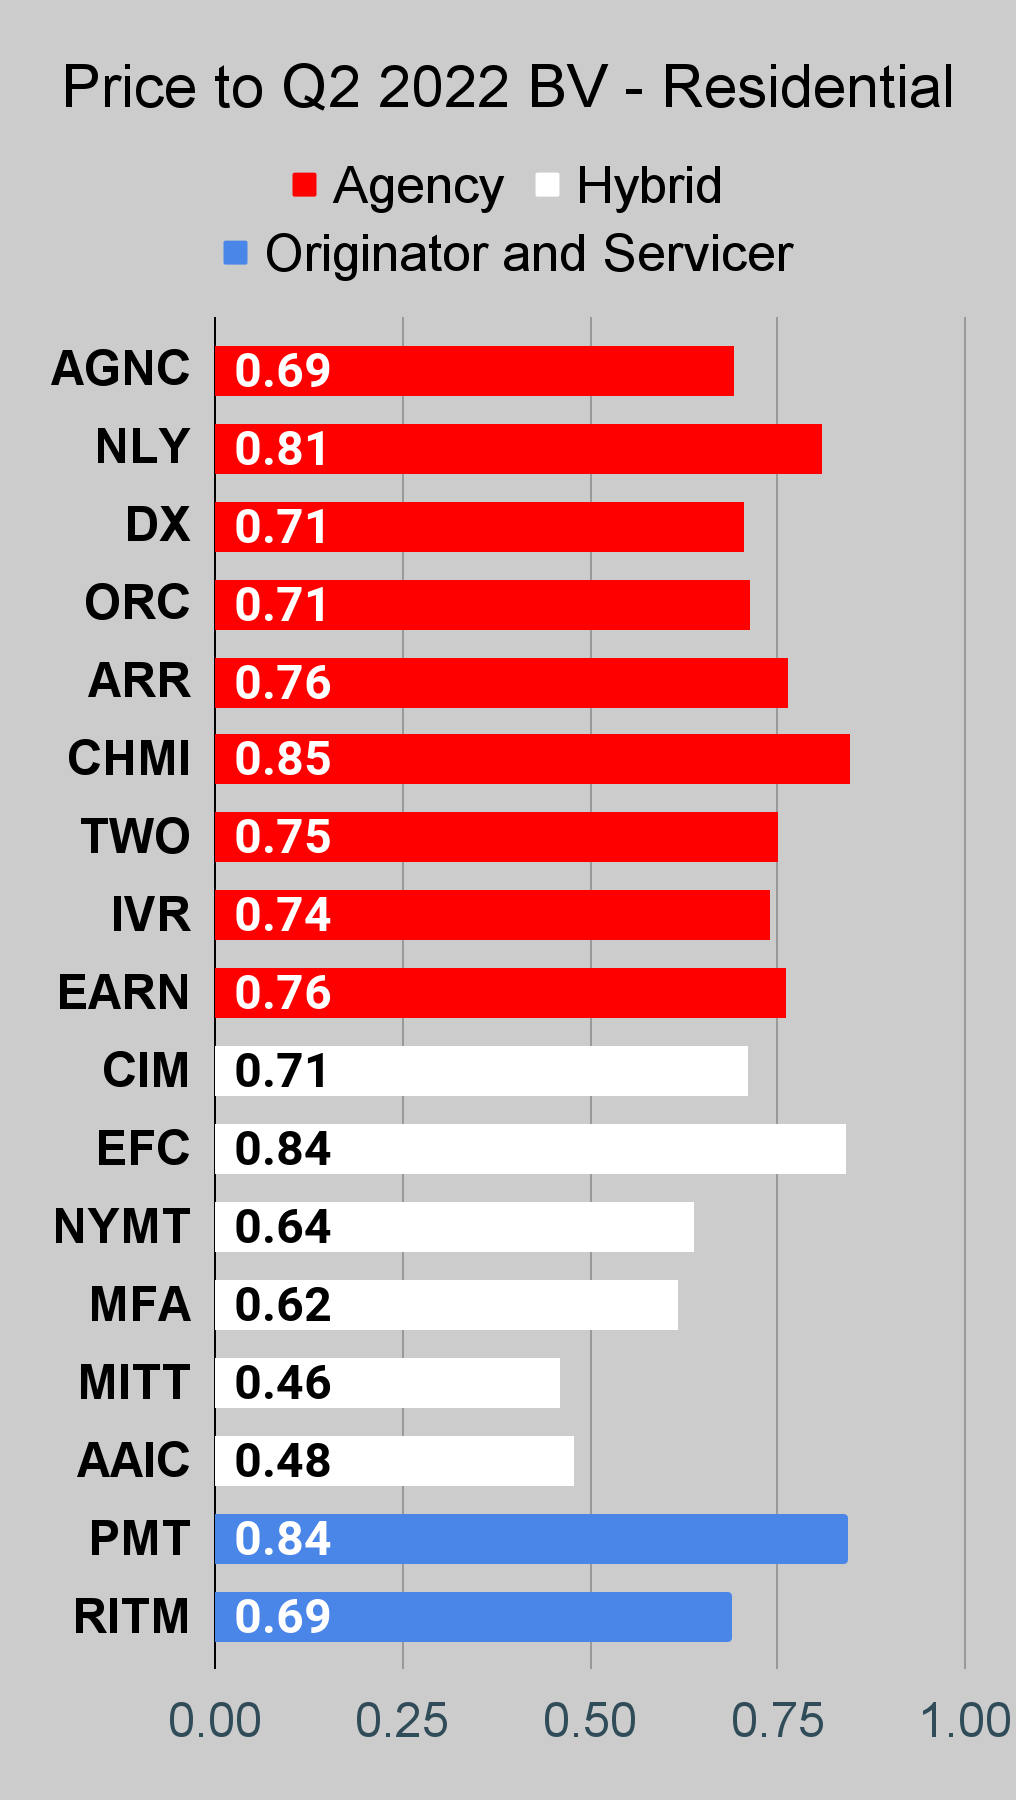
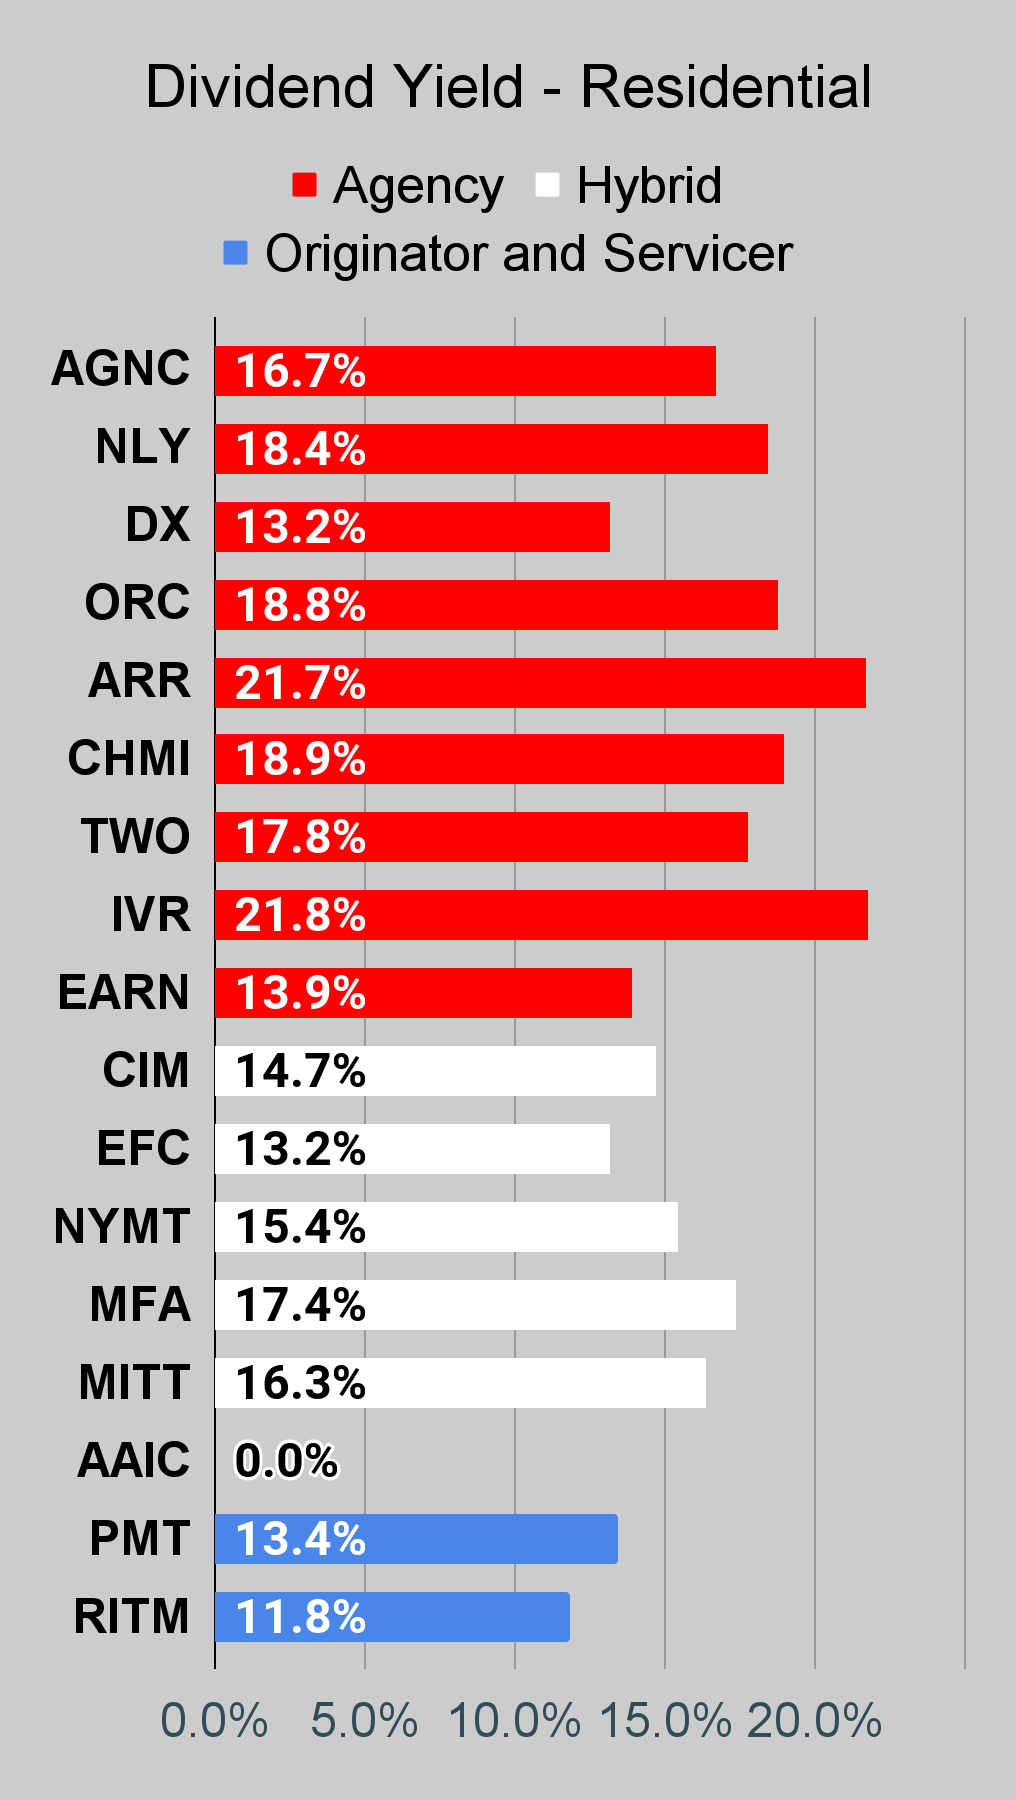
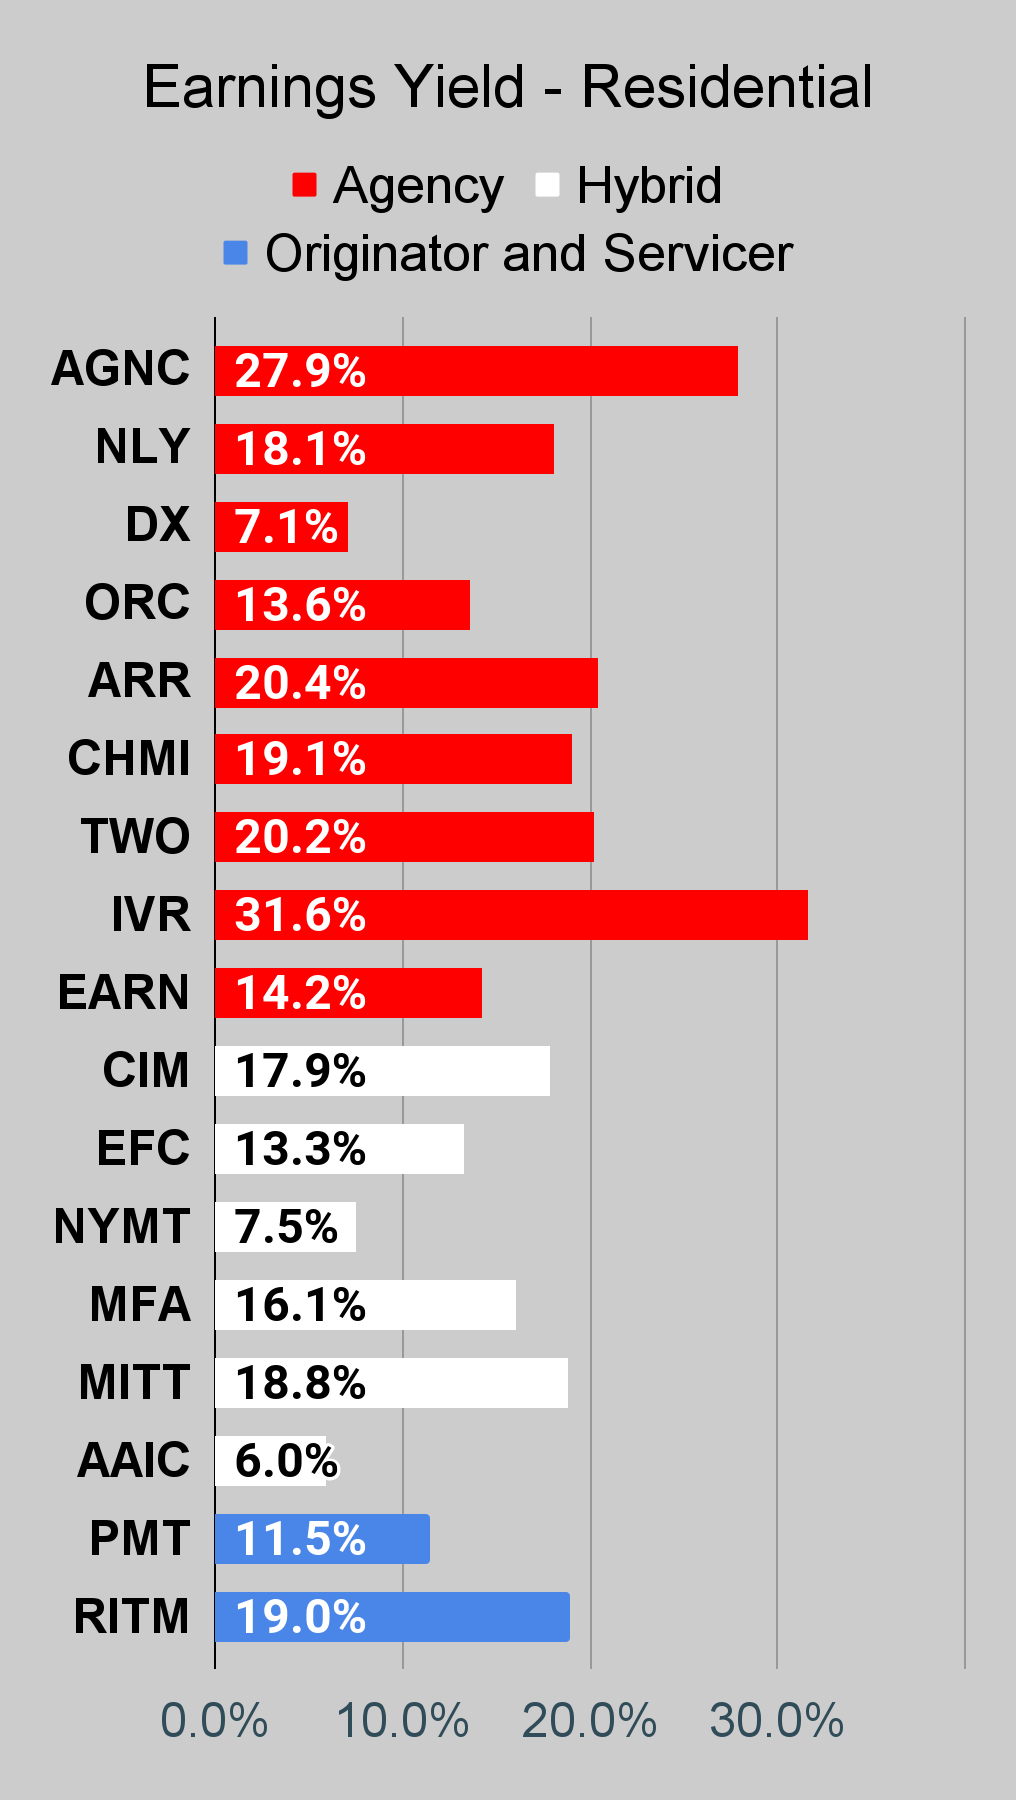
Residential Mortgage REIT Charts
Note: The chart for our public articles uses the book value per share from the latest earnings release. Current estimated book value per share is used in reaching our targets and trading decisions. It is available in our service, but those estimates are not included in the charts below. PMT and NYMT are not showing an earnings yield metric as neither REIT provides a quarterly “Core EPS” metric.
 The REIT Forum |
 The REIT Forum |
 The REIT Forum |
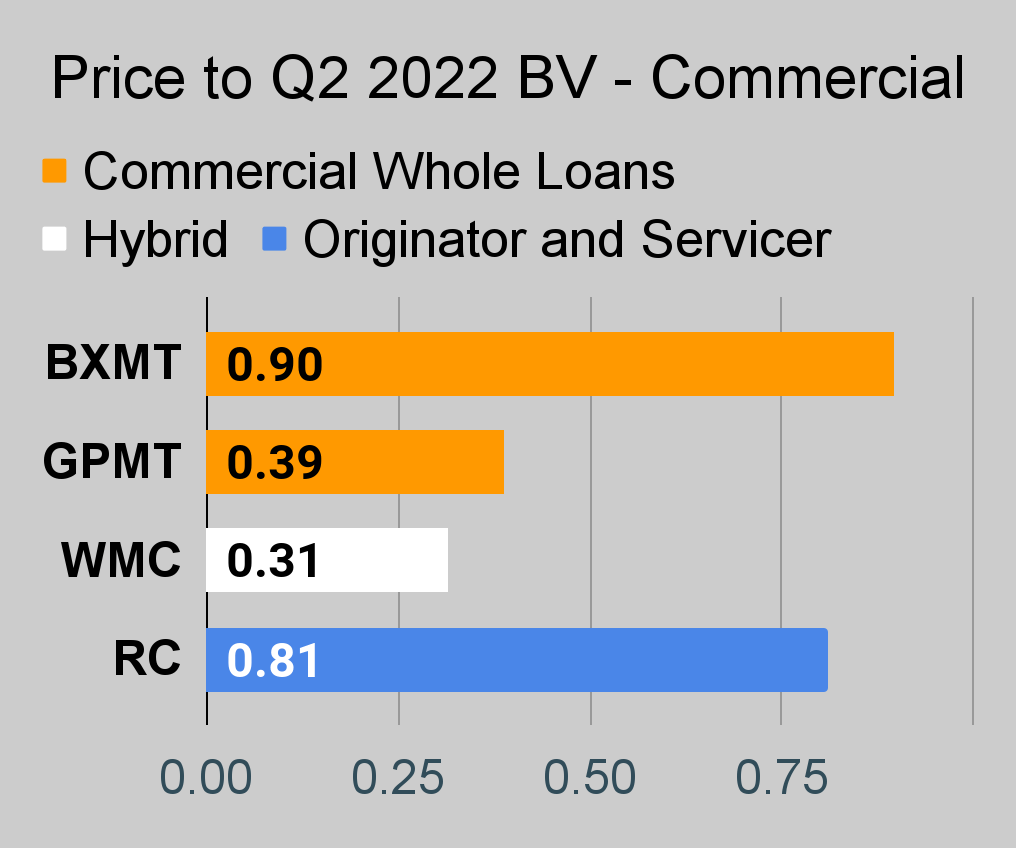
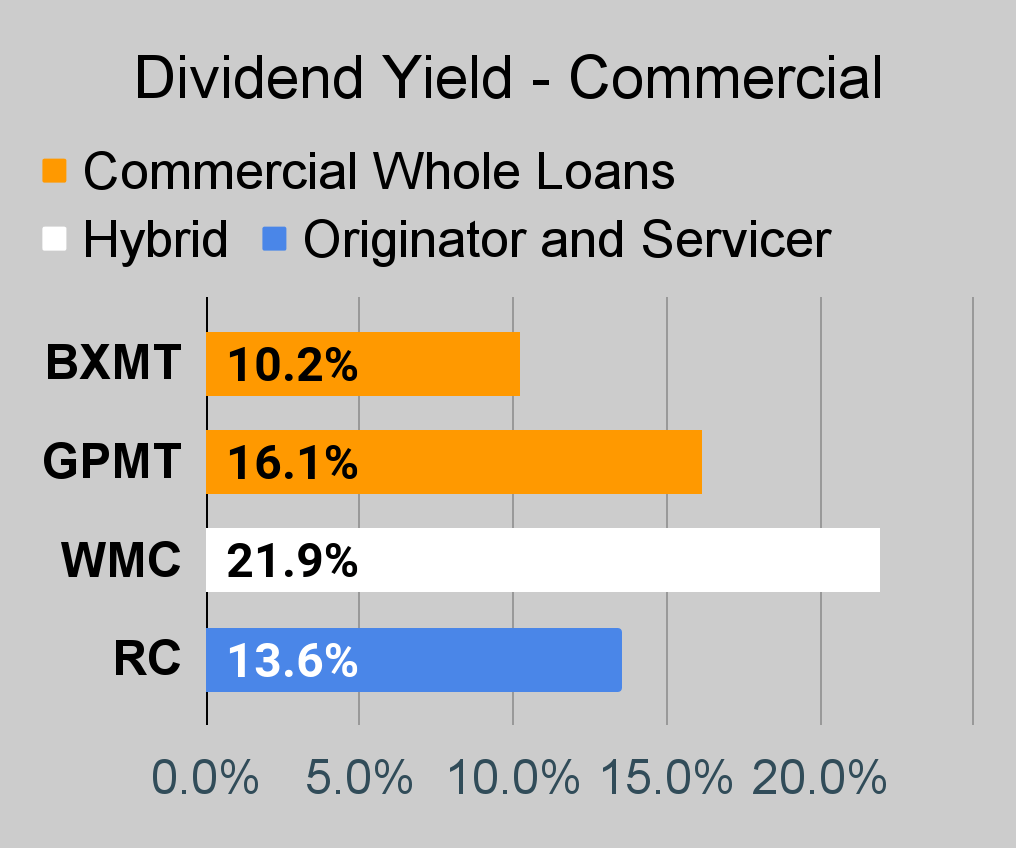
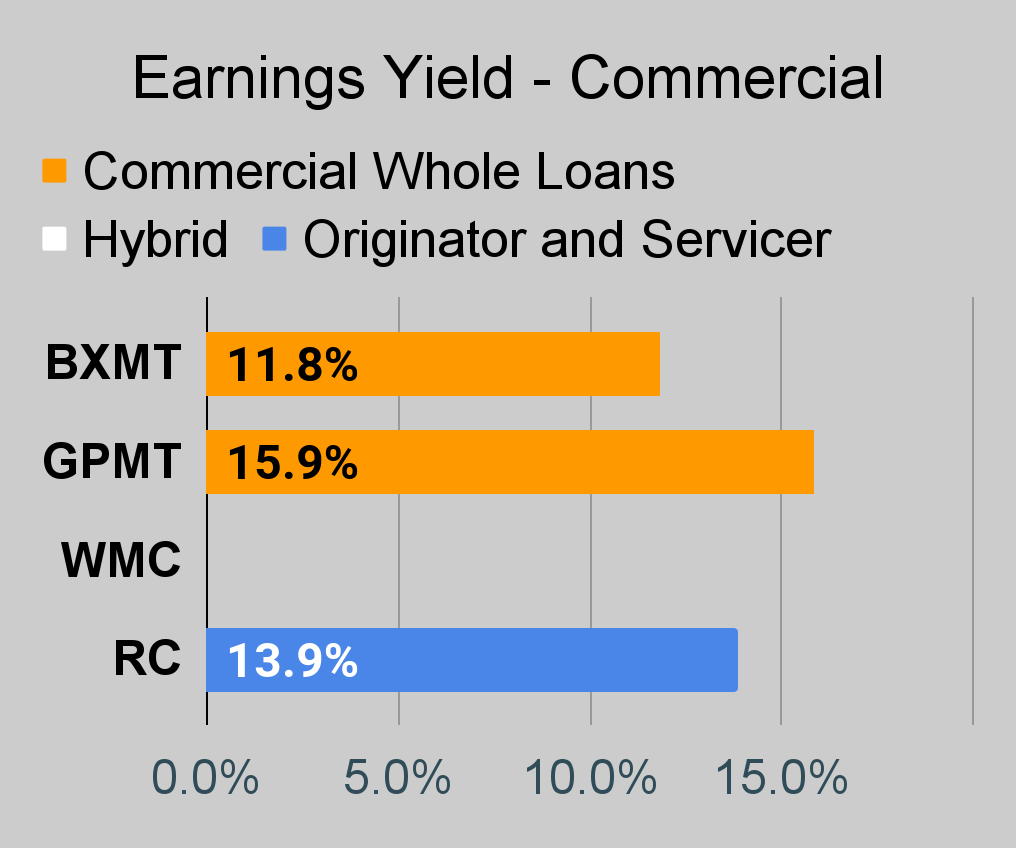
Commercial Mortgage REIT Charts
 The REIT Forum |
 The REIT Forum |
 The REIT Forum |
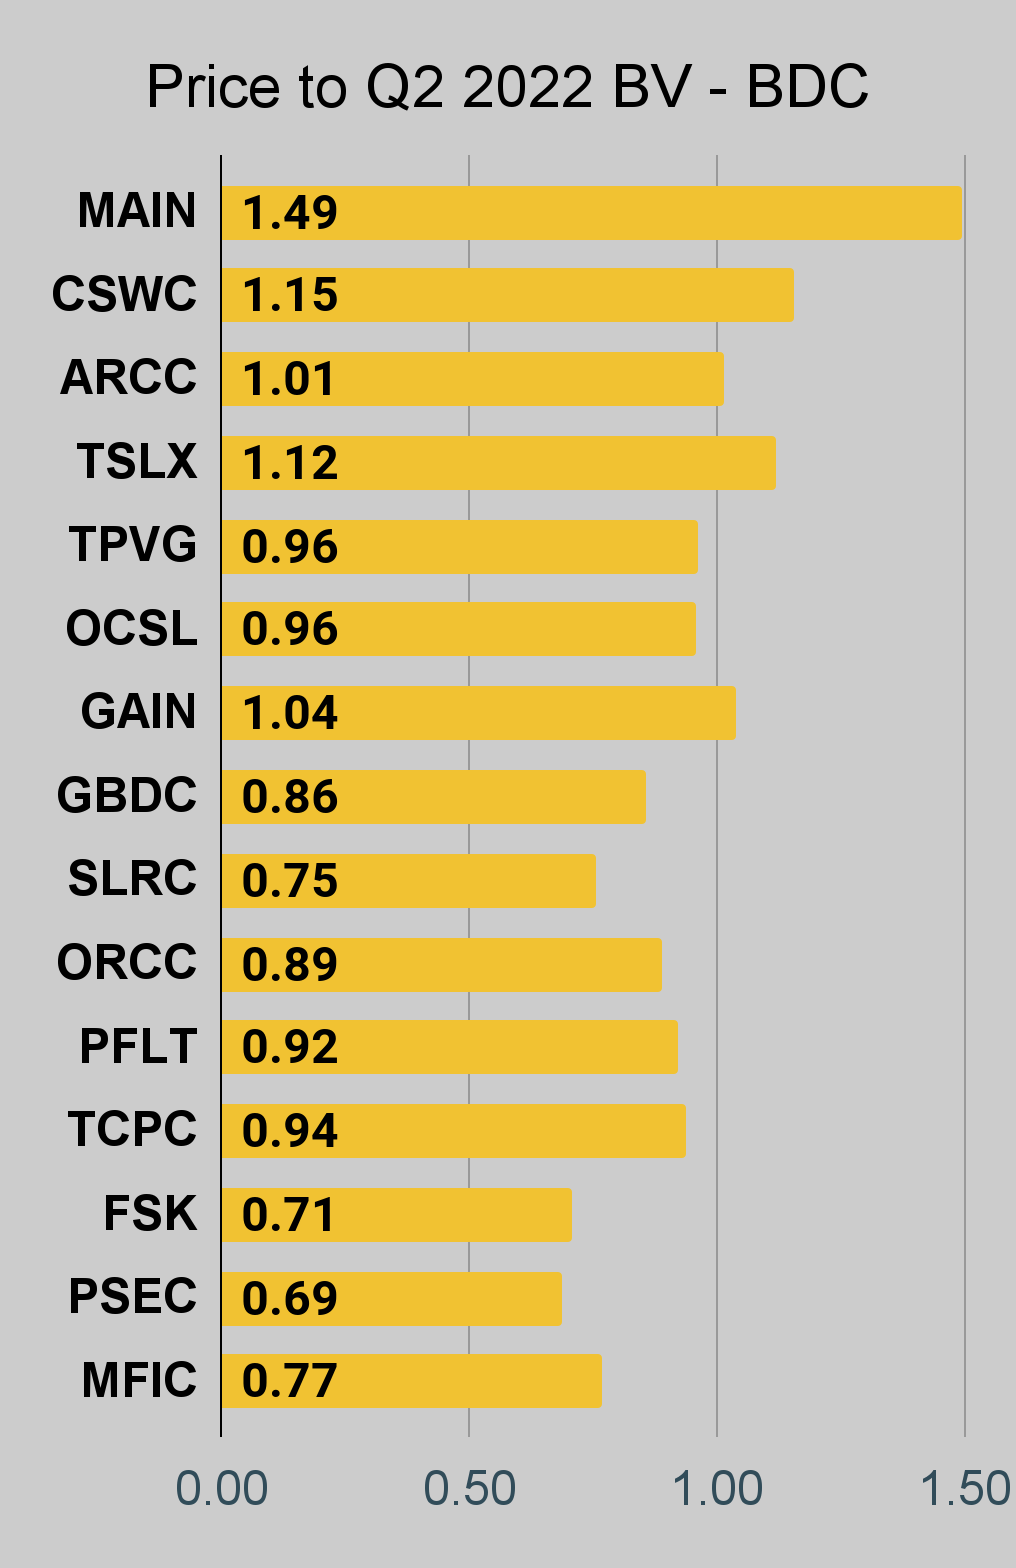
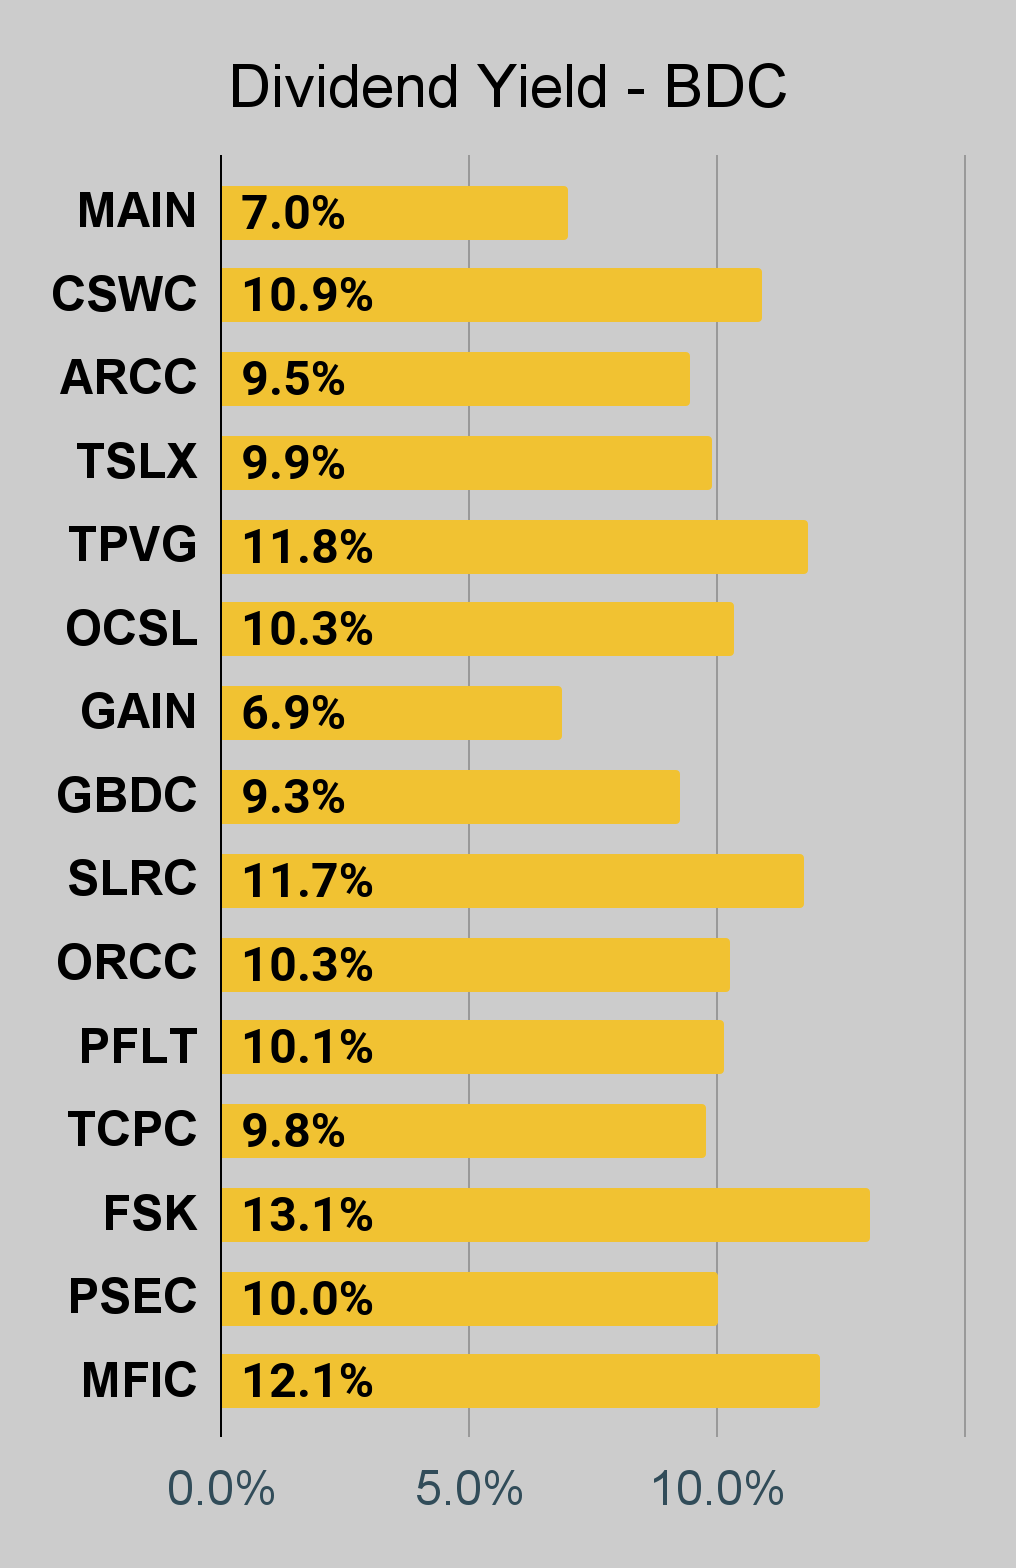
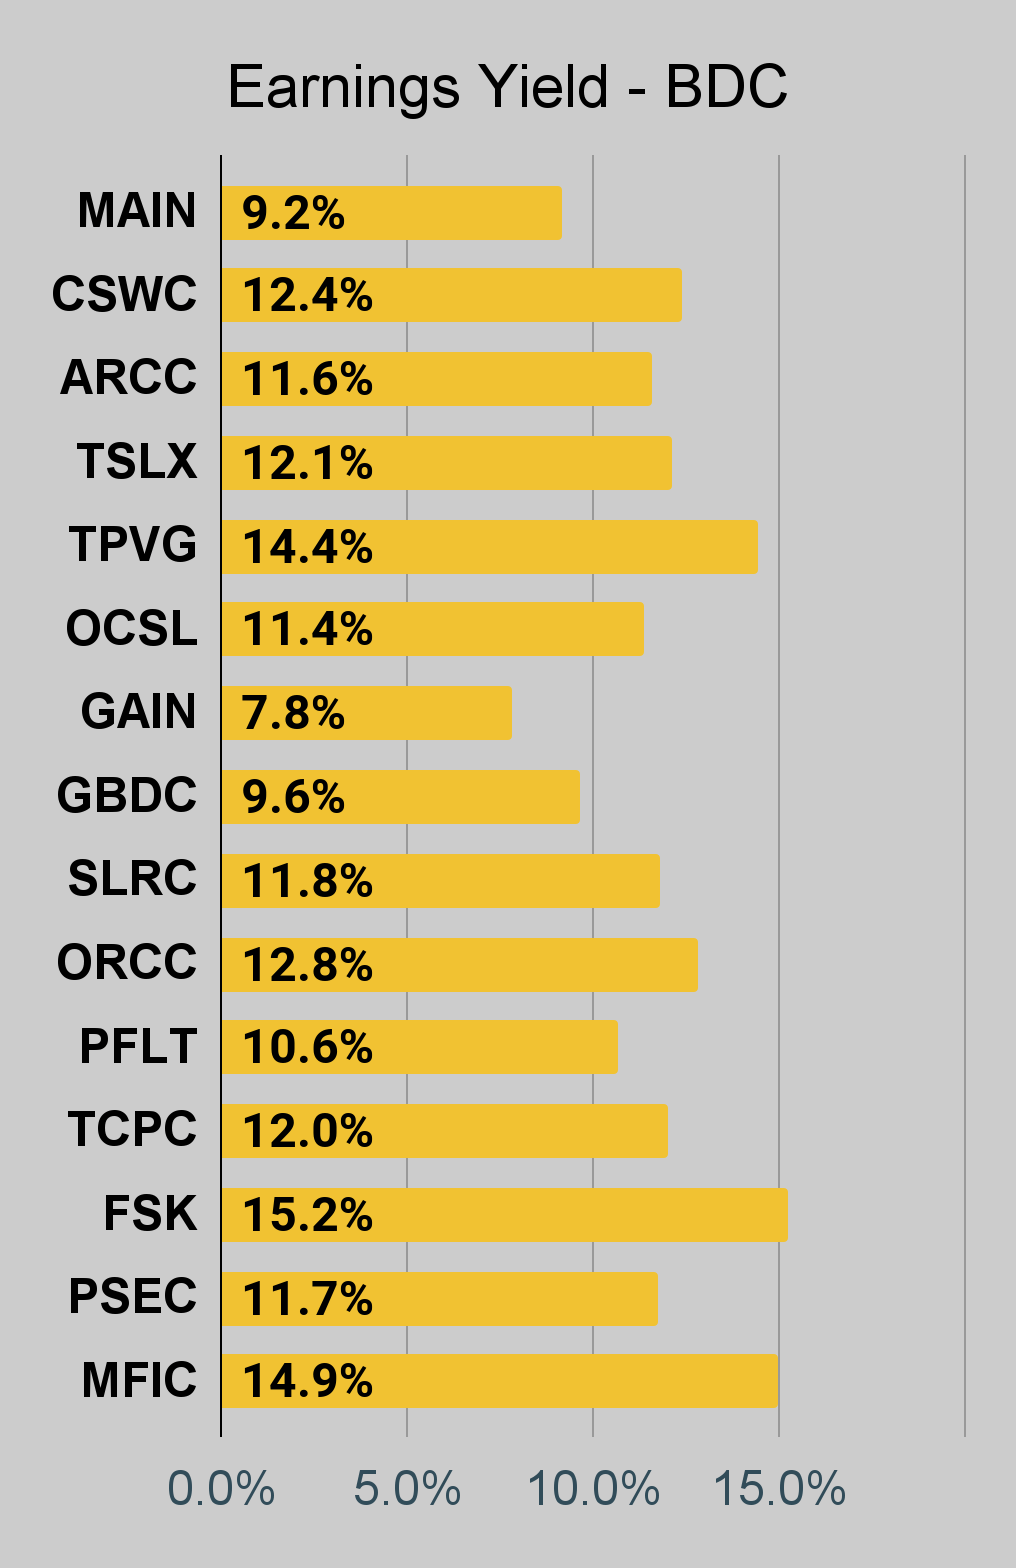
BDC Charts
 The REIT Forum |
 The REIT Forum |
 The REIT Forum |
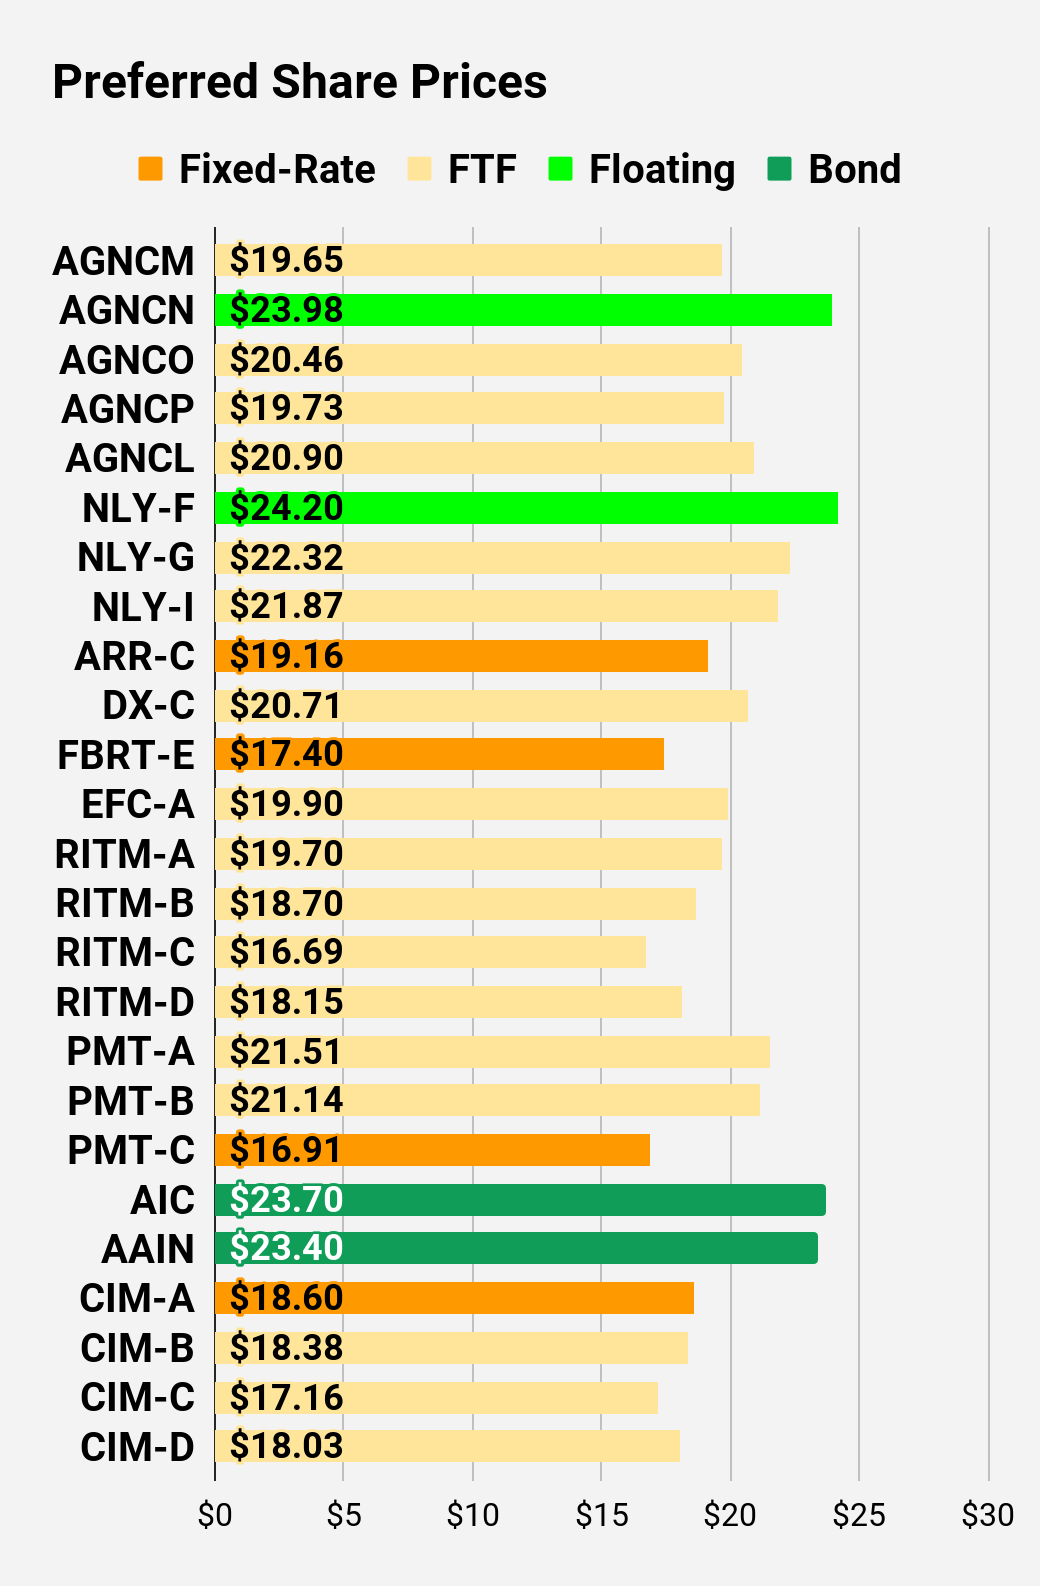
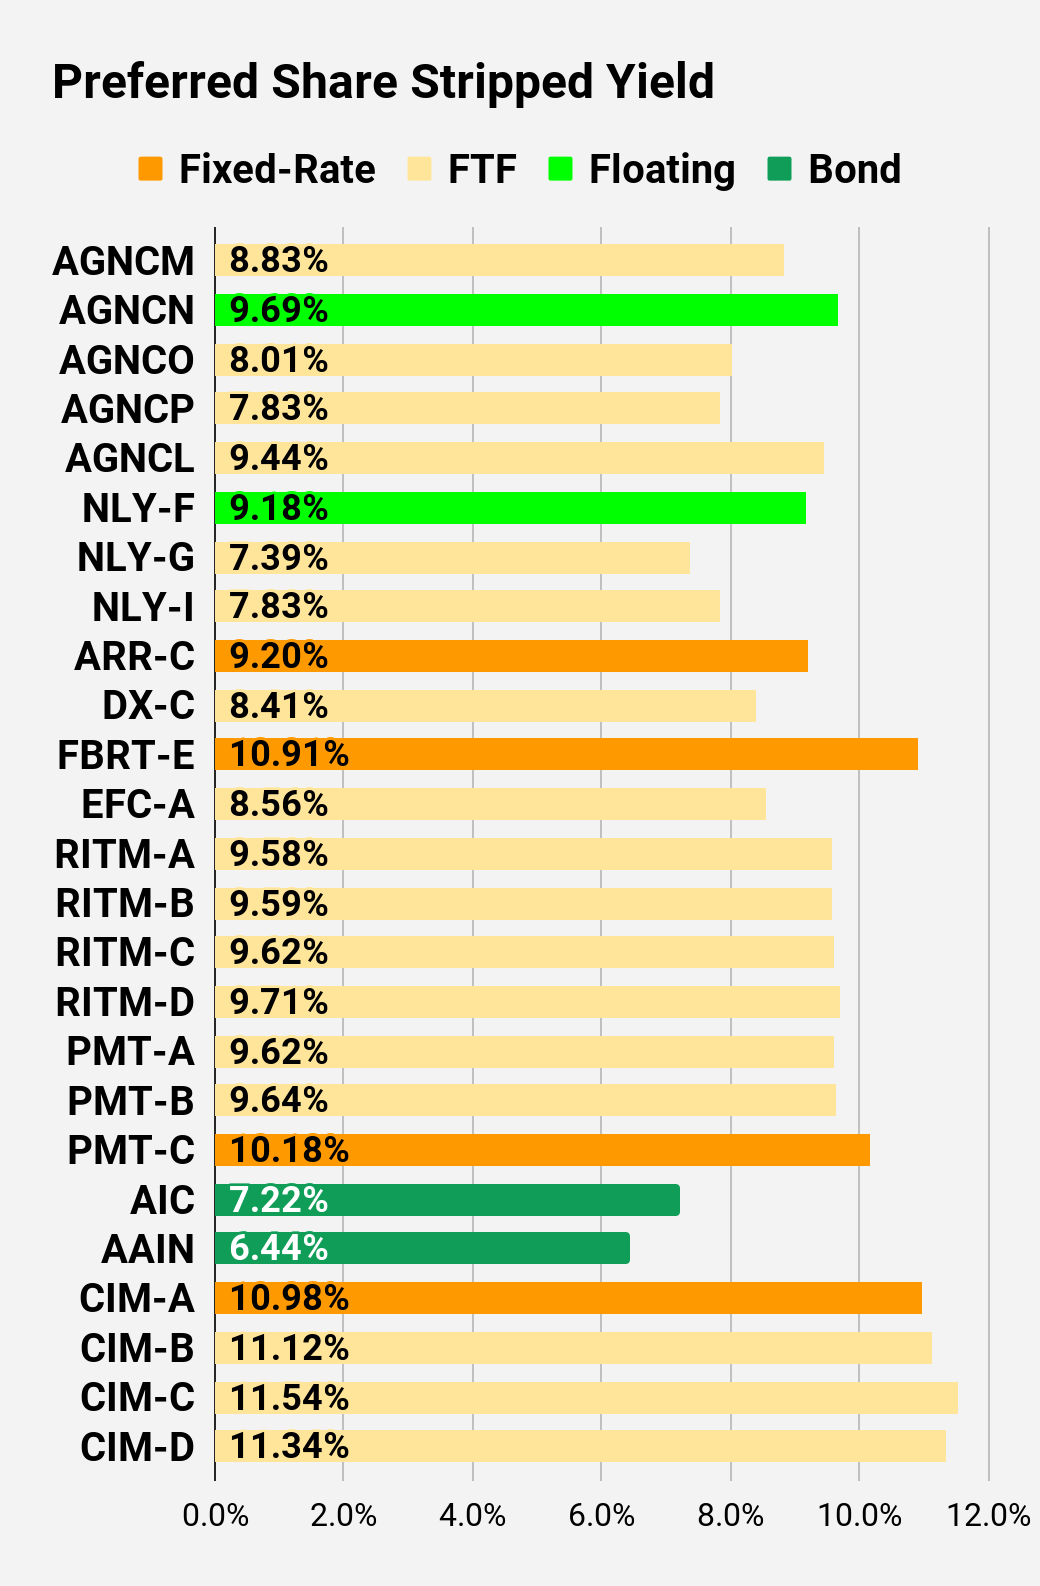
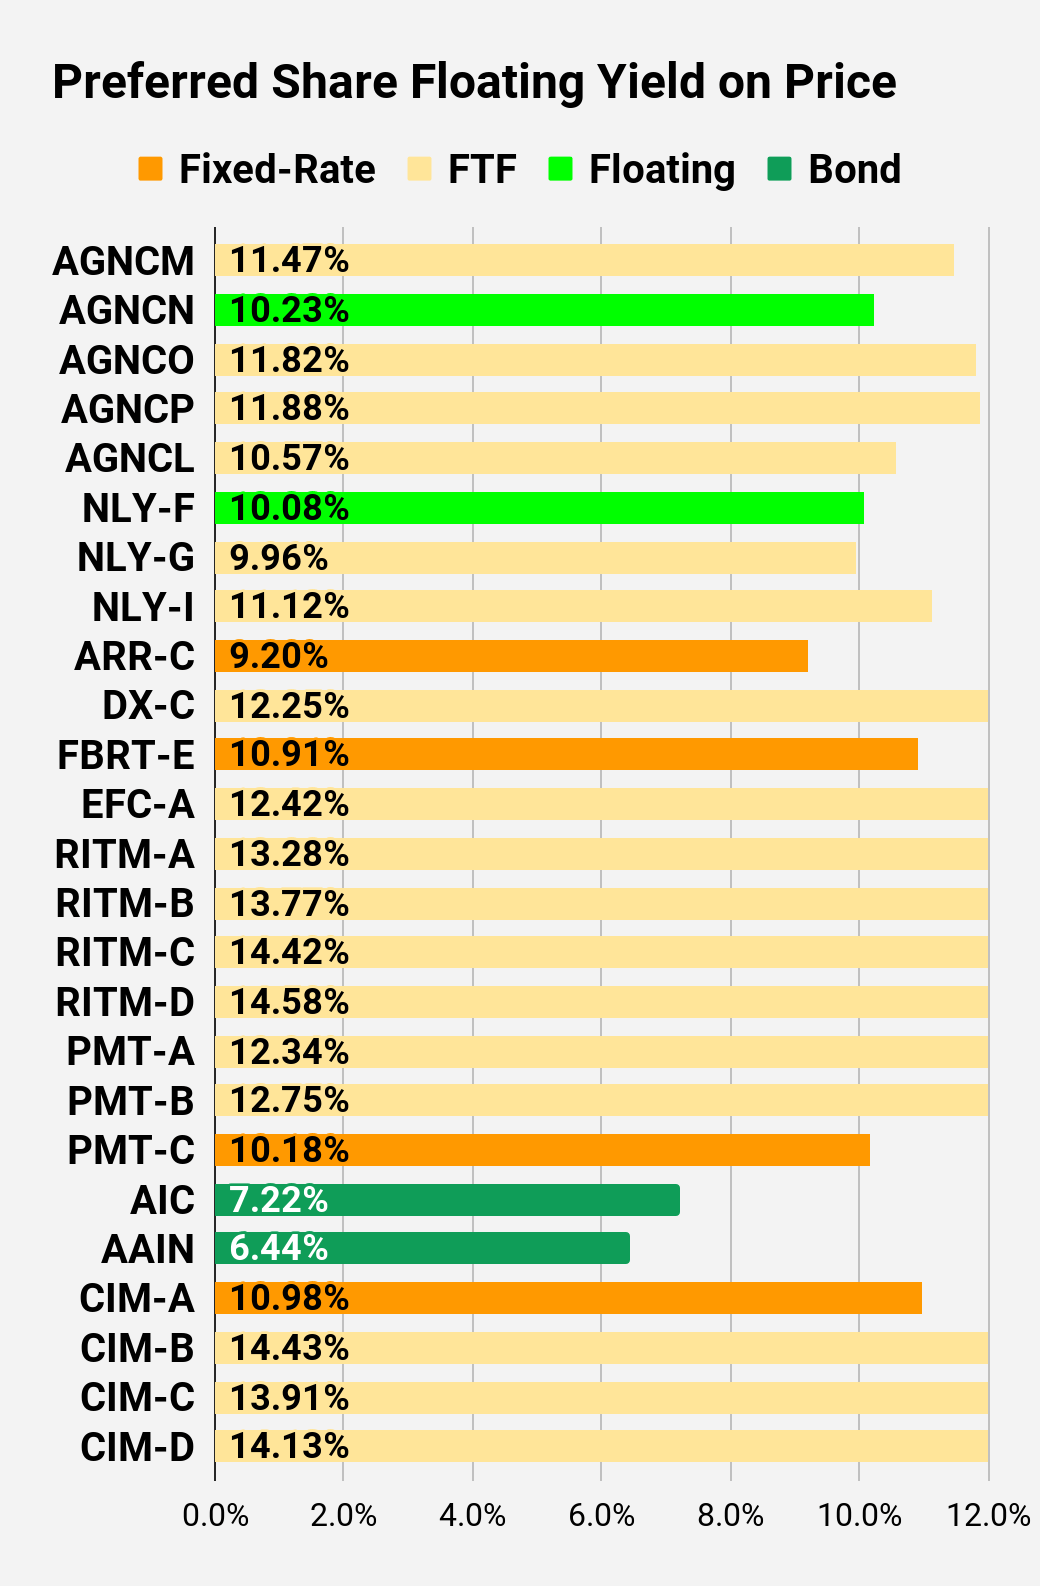
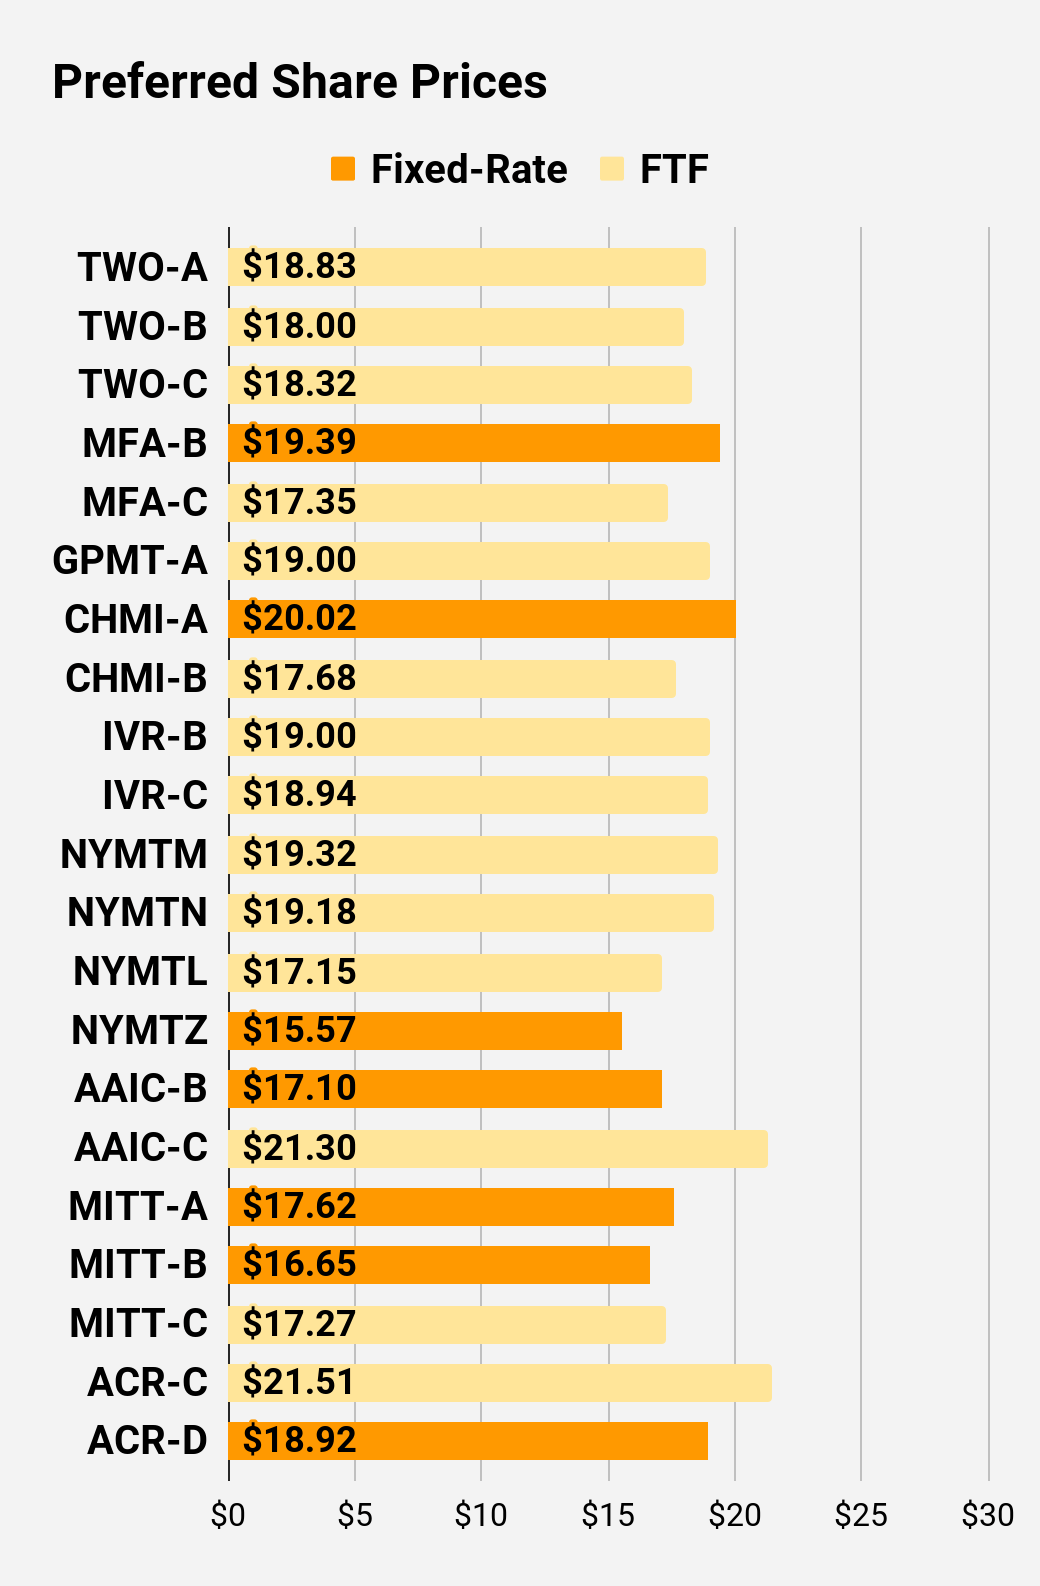
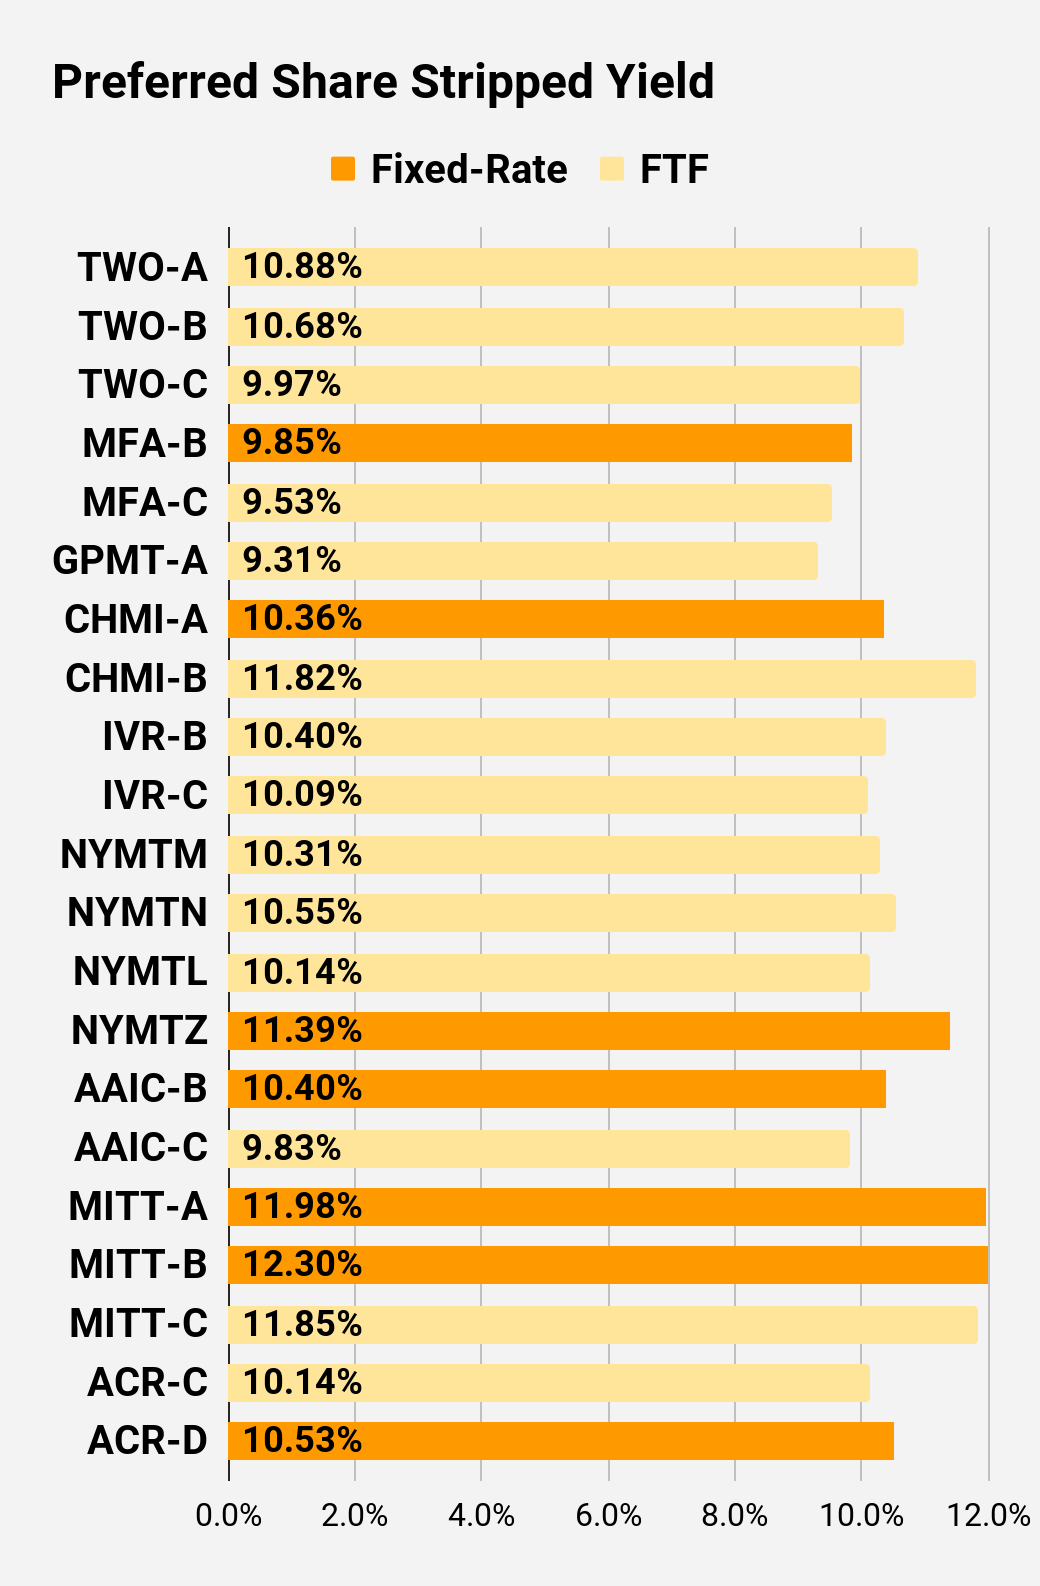
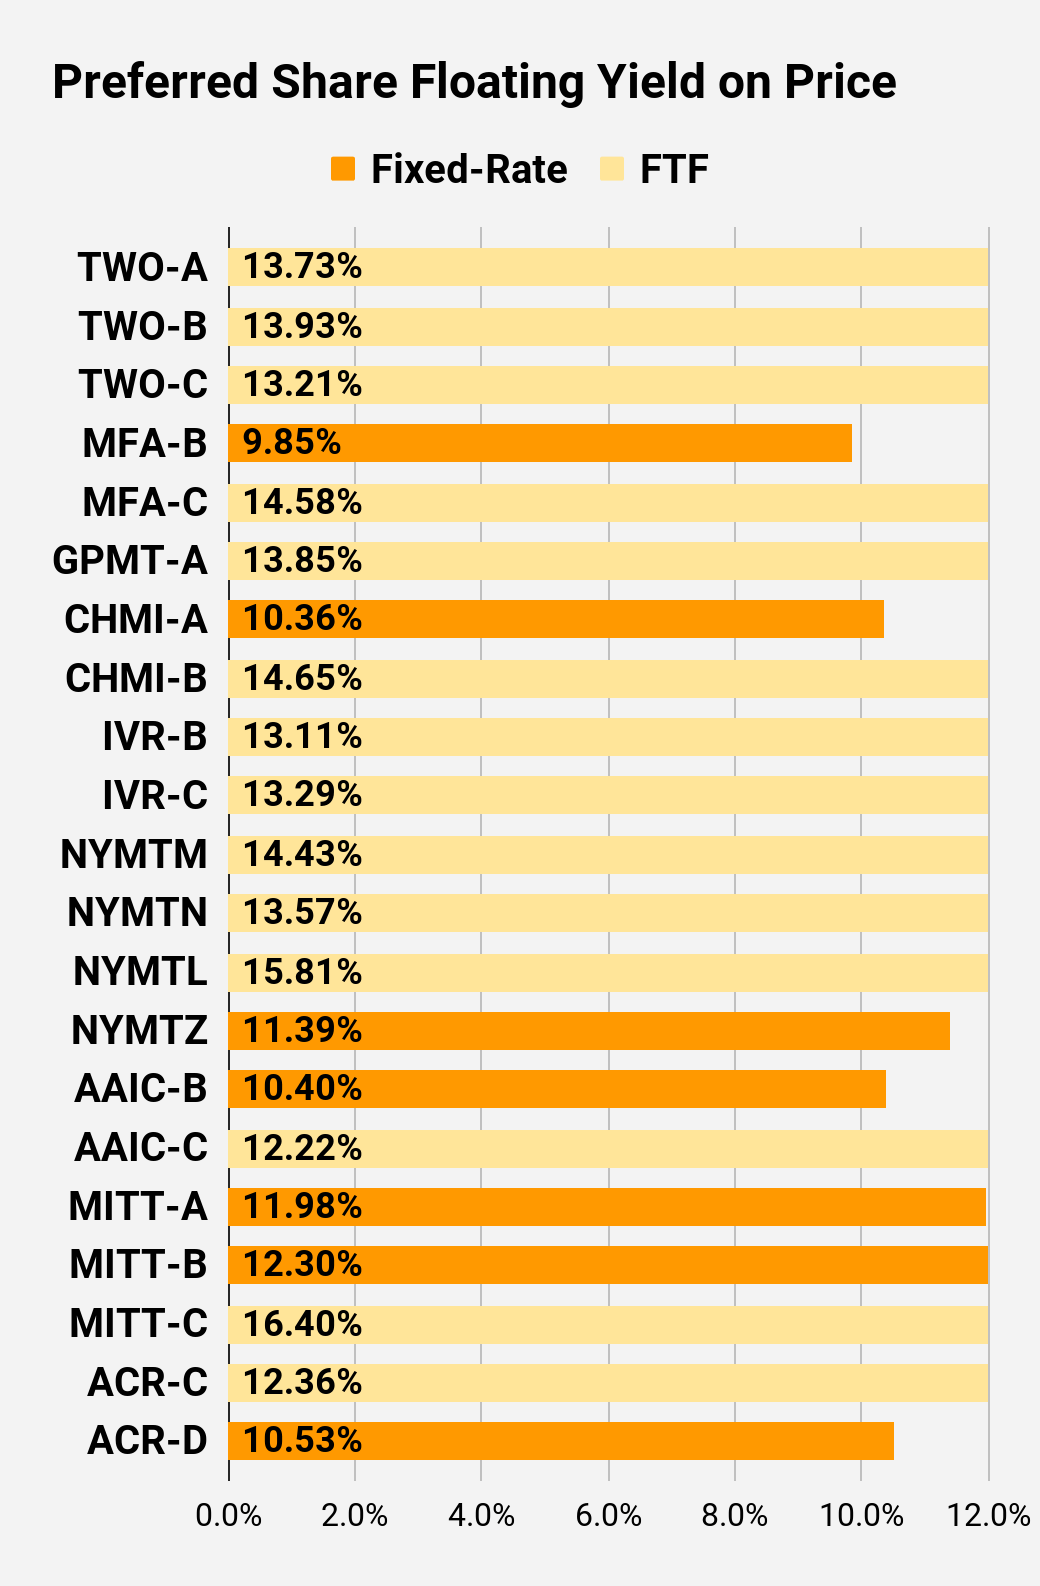
Preferred Share Charts
I changed the coloring a bit. We needed to adjust to include that the first fixed-to-floating shares have transitioned over to floating rates. When a share is already floating, the stripped yield may be different than the “Floating Yield on Price” due to changes in interest rates. For instance, NLY-F already has a floating rate. However, the rate is only reset once per 3 months. The stripped yield is calculated using the upcoming projected dividend payment and the “Floating Yield on Price” is based on where the dividend would be if the rate reset today. In my opinion, for these shares the “Floating Yield on Price” is clearly the more important metric.
 The REIT Forum |
 The REIT Forum |
 The REIT Forum |
 The REIT Forum |
 The REIT Forum |
 The REIT Forum |
Preferred Share Data
Beyond the charts, we’re also providing our readers with access to several other metrics for the preferred shares.
After testing out a series on preferred shares, we decided to try merging it into the series on common shares. After all, we are still talking about positions in mortgage REITs. We don’t have any desire to cover preferred shares without cumulative dividends, so any preferred shares you see in our column will have cumulative dividends. You can verify that by using Quantum Online. We’ve included the links in the table below.
To better organize the table, we needed to abbreviate column names as follows:
- Price = Recent Share Price – Shown in Charts
- BoF = Bond or FTF (Fixed-to-Floating)
- S-Yield = Stripped Yield – Shown in Charts
- Coupon = Initial Fixed-Rate Coupon
- FYoP = Floating Yield on Price – Shown in Charts
- NCD = Next Call Date (the soonest shares could be called)
- Note: For all FTF issues, the floating rate would start on NCD.
- WCC = Worst Cash to Call (lowest net cash return possible from a call)
- QO Link = Link to Quantum Online Page
Second Batch:
Strategy
Our goal is to maximize total returns. We achieve those most effectively by including “trading” strategies. We regularly trade positions in the mortgage REIT common shares and BDCs because:
- Prices are inefficient.
- Long-term, share prices generally revolve around book value.
- Short-term, price-to-book ratios can deviate materially.
- Book value isn’t the only step in analysis, but it is the cornerstone.
We also allocate to preferred shares and equity REITs. We encourage buy-and-hold investors to consider using more preferred shares and equity REITs.
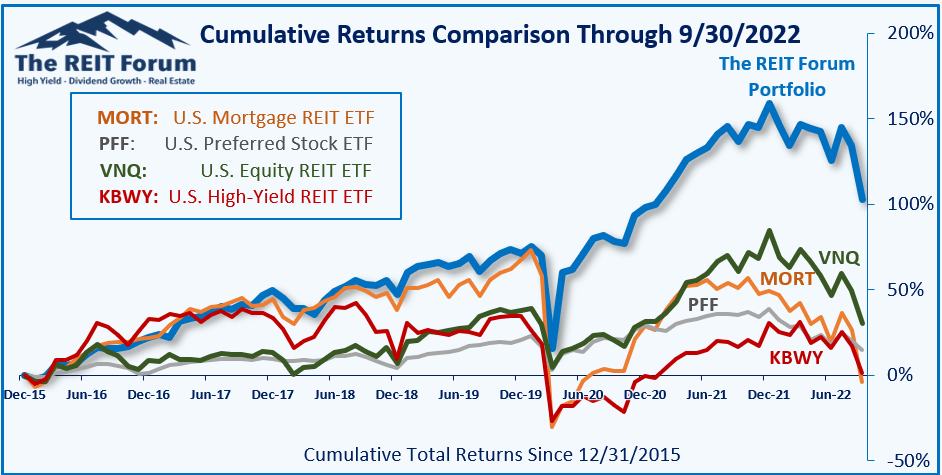
Performance
We compare our performance against 4 ETFs that investors might use for exposure to our sectors:
The REIT Forum
The 4 ETFs we use for comparison are:
|
Ticker |
Exposure |
|
One of the largest mortgage REIT ETFs |
|
|
One of the largest preferred share ETFs |
|
|
Largest equity REIT ETF |
|
|
The high-yield equity REIT ETF. Yes, it has been dreadful. |
When investors think it isn’t possible to earn solid returns in preferred shares or mortgage REITs, we politely disagree. The sector has plenty of opportunities, but investors still need to be wary of the risks. We can’t simply reach for yield and hope for the best. When it comes to common shares, we need to be even more vigilant to protect our principal by regularly watching prices and updating estimates for book value and price targets.
Ratings: Bullish on MFA.
Expecting NLY-I to outperform NLY-F and NLY-G over the next 18 months.
Be the first to comment