

Jose Luis Pelaez Inc
Many have asked me why I cover or buy non-dividend growth stocks like Amazon (NASDAQ:AMZN) or Alphabet (NASDAQ:GOOG)(NASDAQ:GOOGL).
The answer is simple. My goal is to help you maximize long-term income, and nothing does that better than a barbell approach that combines hyper-growth with high-yield blue-chips.
Here is a great example using Altria (MO), Magellan Midstream Partners (MMP), Amazon, and Alphabet.
I call this barbell approach of growth + yield the Zen Phoenix strategy, because it creates the optimal outcome for most investors if practiced within a diversified and prudently risk-managed portfolio.
In fact, let me show you the four reasons why I think it’s a good idea for most dividend investors to buy AMZN and GOOG (combined with their favorite high-yield blue-chips) today.
Reason One: Growth + Value = Higher Yield Than Most High-Yield ETFs
| Company | Yield | LT Consensus Growth | LT Consensus Total Return Potential | Long-Term Risk-Adjusted Expected Return | Long-Term Inflation And Risk-Adjusted Expected Returns | Years To Double Your Inflation & Risk-Adjusted Wealth |
10-Year Inflation And Risk-Adjusted Expected Return |
| Amazon | 0.0% | 22.1% | 22.1% | 15.5% | 13.0% | 5.5 | 3.4 |
| Alphabet | 0.0% | 14.3% | 14.3% | 10.0% | 7.5% | 9.5 | 2.1 |
| Altria | 8.4% | 5.0% | 13.4% | 9.3% | 6.9% | 10.5 | 1.9 |
| Magellan Midstream Partners (Uses A K-1 Tax Form) | 8.5% | 4.9% | 13.4% | 9.4% | 6.9% | 10.4 | 1.9 |
| Average | 4.2% | 11.6% | 15.8% | 11.0% | 8.6% | 9.0 | 2.3 |
| High-Yield (SCHD) | 3.7% | 8.5% | 12.3% | 8.6% | 6.1% | 11.8 | 1.81 |
(Sources: DK Research Terminal, Morningstar, Ycharts, FactSet)
For the reasons I explain in this article, Schwab’s US Dividend Equity ETF (SCHD) is the gold standard of high-yield ETFs.
Combining AMZN, GOOG, MO, and MMP create an Ultra SWAN (sleep well at night) basket of blue-chips that yields more than SCHD (and VYM, another wonderful high-yield ETF).
But one that has about 50% higher growth consensus and thus analysts think could outperform SCHD by about 3.5% annually over the long-term.
Inflation-Adjusted Consensus Total Return Potential (Ignoring Valuation): $1,000 Initial Investment
| Time Frame (Years) | 7.7% CAGR Inflation-Adjusted S&P Consensus | 9.8% Inflation-Adjusted SCHD Consensus | 13.3% CAGR Inflation-Adjusted AMZN/GOOG/MO/MMP Guidance | Difference Between Inflation-Adjusted AMZN/GOOG/MO/MMP Consensus And SCHD Consensus |
| 5 | $1,451.05 | $1,598.10 | $1,869.50 | $271.39 |
| 10 | $2,105.56 | $2,553.93 | $3,495.01 | $941.08 |
| 15 | $3,055.27 | $4,081.45 | $6,533.91 | $2,452.46 |
| 20 | $4,433.36 | $6,522.58 | $12,215.12 | $5,692.54 |
| 25 | $6,433.04 | $10,423.76 | $22,836.11 | $12,412.35 |
| 30 | $9,334.69 | $16,658.26 | $42,692.02 | $26,033.76 |
(Source: DK Research Terminal, FactSet Research)
Even if AMZN and GOOG only grow as analysts expect for 10 years, we’re talking about the potential for 3.5X inflation-adjusted returns.
- and that’s ignoring the deep value discounts for all four companies
- assumes zero multiple expansion to historical fair value
| Time Frame (Years) | Ratio AMZN/GOOG/MO/MMP/SCHD Consensus | Ratio Inflation-Adjusted AMZN/GOOG/MO/MMP Consensus vs. S&P consensus |
| 5 | 1.17 | 1.29 |
| 10 | 1.37 | 1.66 |
| 15 | 1.60 | 2.14 |
| 20 | 1.87 | 2.76 |
| 25 | 2.19 | 3.55 |
| 30 | 2.56 | 4.57 |
(Source: DK Research Terminal, FactSet Research)
That means potentially 66% better return potential than the S&P 500 and 37% more than SCHD, just over the next decade.
- and with a very safe 4.2% yield on day one
Ok, so maybe combining high-growth with high-yield can let you have your cake and eat it too, but how can buying non-dividend stocks result in higher income?
Thanks to the magic of annual rebalancing. Let me show you what I mean.
Reason Two: Far More Long-Term Income Than Pure High-Yield Alone
Hyper-growth blue-chips appreciate faster than most high-yield blue-chips, thus helping to compound long-term income much faster than pure high-yield investing alone.
Let’s look at how AMZN, GOOG, MO, and MMP have done historically, both in terms of returns and, most importantly, safe income over time.
Historical Returns Since September 2004 (Equal Weighting, Annual Rebalancing)
The future doesn’t repeat, but it often rhymes. – Mark Twain
Past performance is no guarantee of future results, but studies show that blue-chips with relatively stable fundamentals over time offer predictable returns based on yield, growth, and valuation mean reversion.
Bank of America
So let’s see how these four Ultra SWANs performed over the last 18 years when approximately 91% of total returns were explained by fundamentals and not luck.
(Source: Portfolio Visualizer Premium)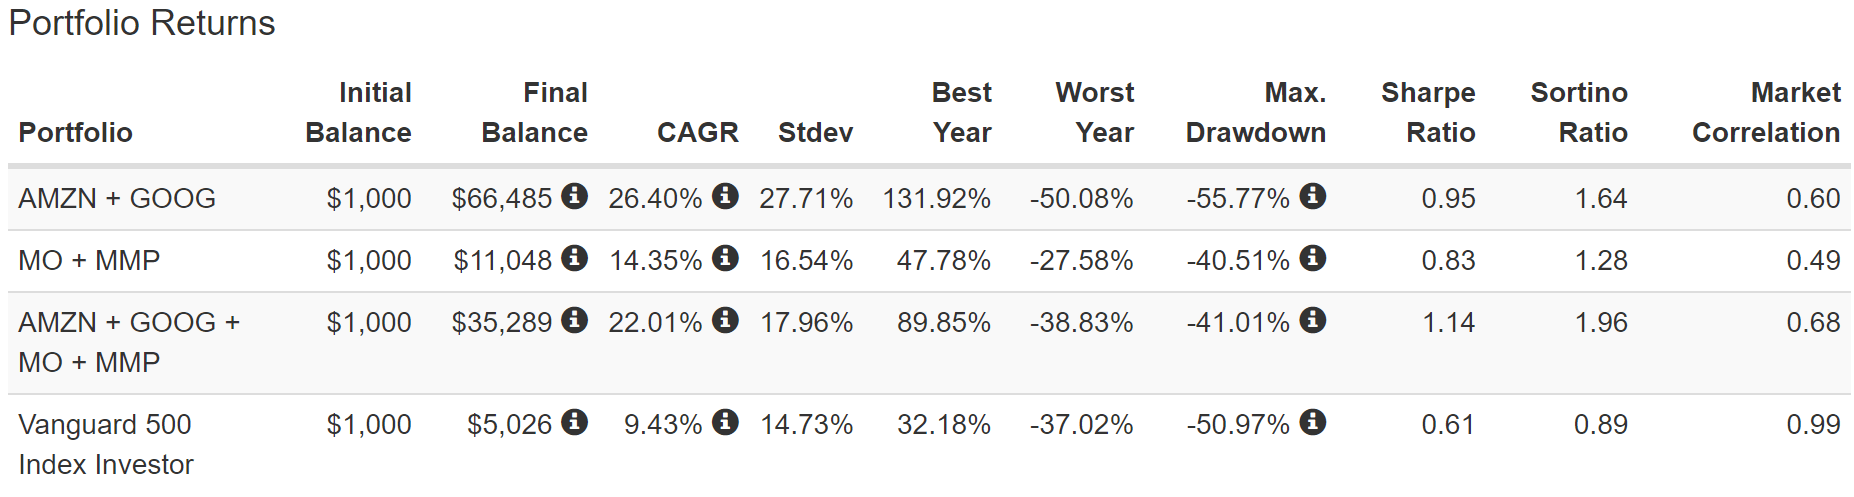
Not surprisingly, AMZN and GOOG have delivered sensational 26% annual returns since 2004, while MO and MMP have also delivered exceptional 14.4% annual returns.
But combining the four together created a 22% annual return, with far less volatility than the growth stocks alone, including a peak decline of just 41% during the Great Recession.
- a 15% smaller decline than the growth blue-chips alone
In fact, on a negative-volatility-adjusted total return basis (Sortino Ratio), combining growth and high-yield delivered:
- 20% better than AMZN + GOOG
- 53% better than MO + MMP
- 120% better than the S&P 500
(Source: Portfolio Visualizer Premium)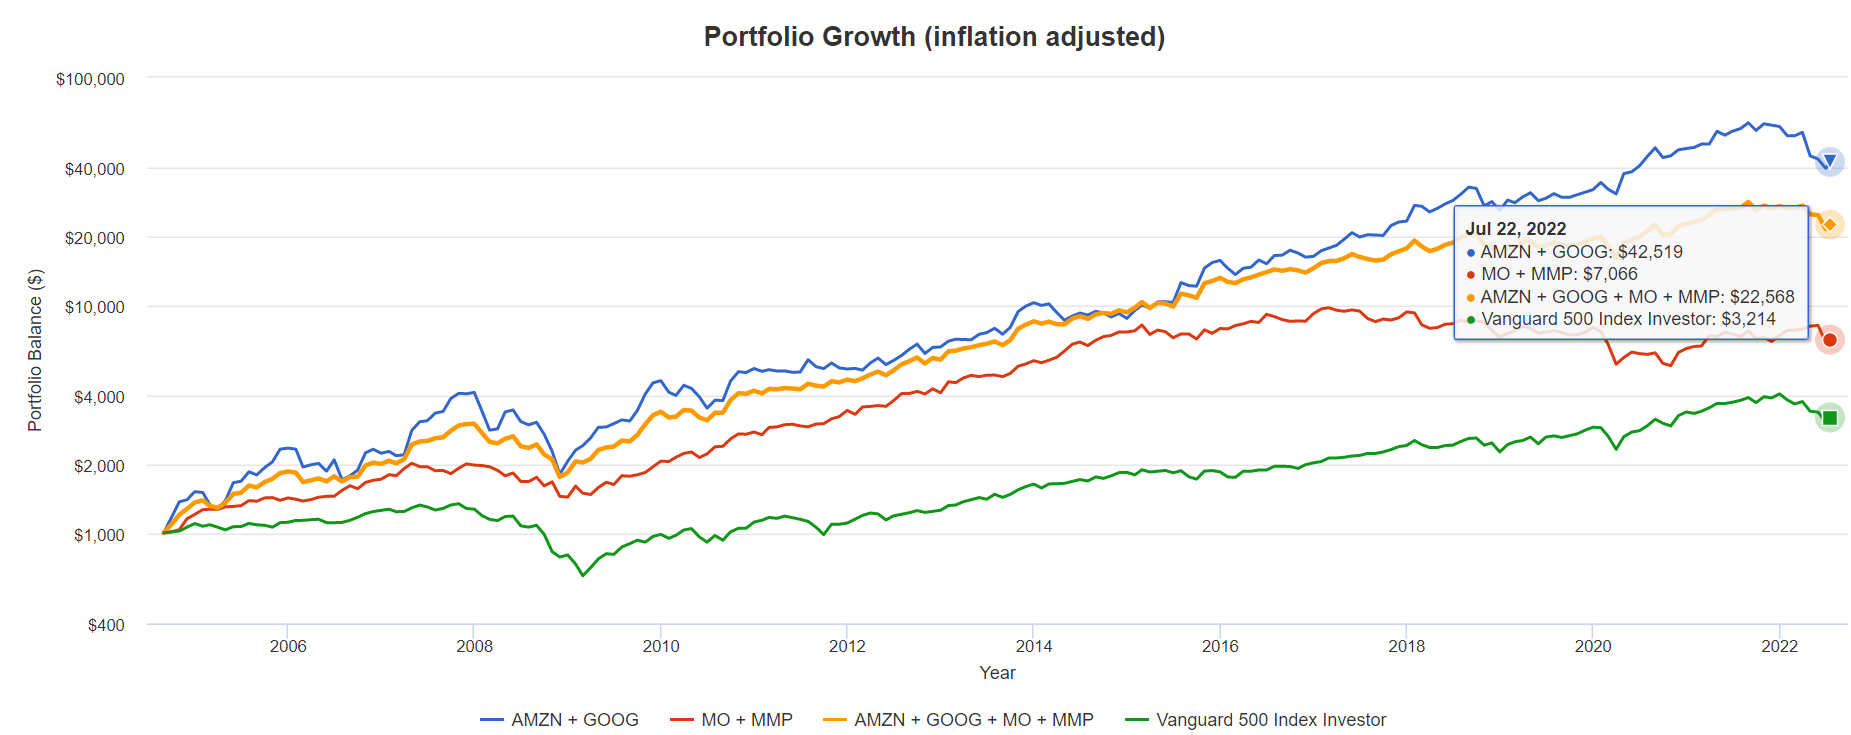
Over the last 18 years, this combo of growth + yield delivered 23X inflation-adjusted returns:
- 7X more than the S&P 500
- 3X more than MO + MMP
- MO + MMP delivered over 2X more than the S&P 500
(Source: Portfolio Visualizer Premium)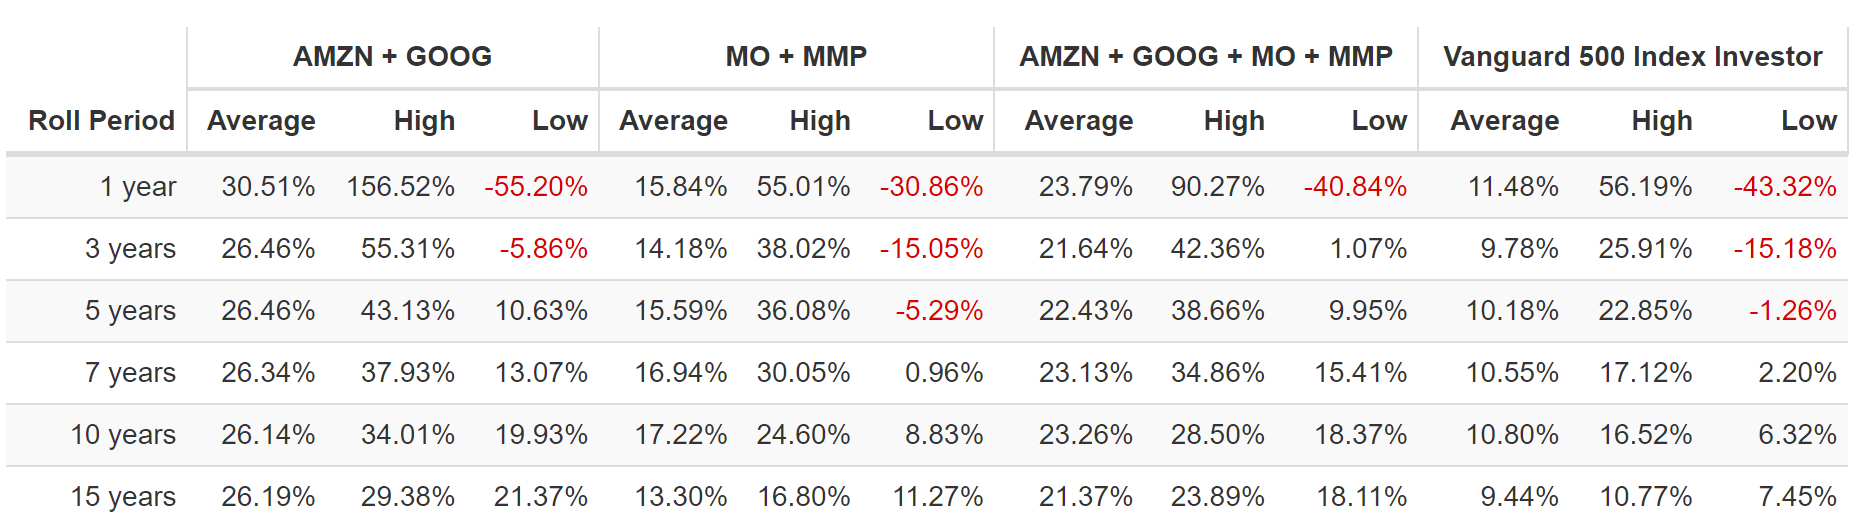
The lowest 10-year return from these four Ultra SWANs is higher than the market’s best 10-year return since 2004.
(Source: Portfolio Visualizer Premium)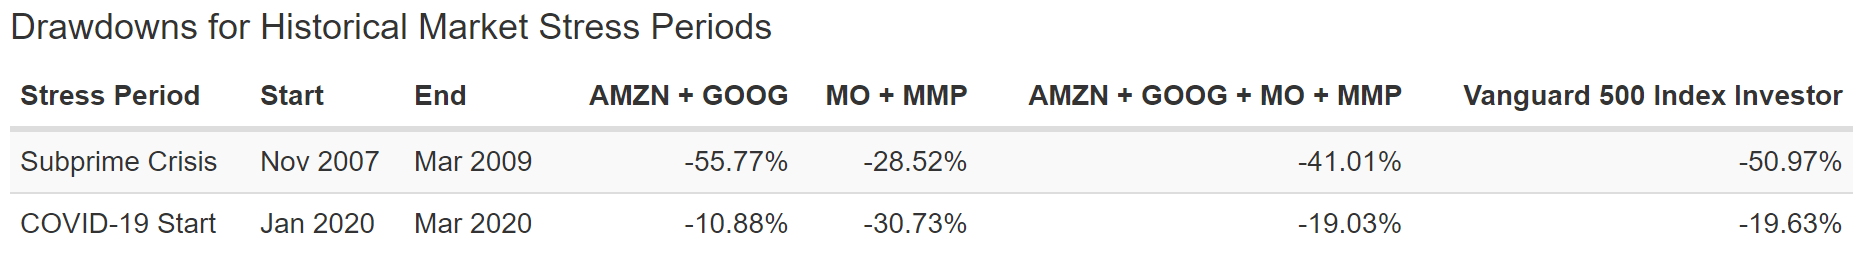
During the Great Recession high-yield Ultra SWANs like MO and MMP were defensive, falling about half as much as the market and a lot less than tech.
During the Pandemic, it was the opposite.
Combine the two, and you had a far less stressful time in both market crises.
(Source: Portfolio Visualizer Premium)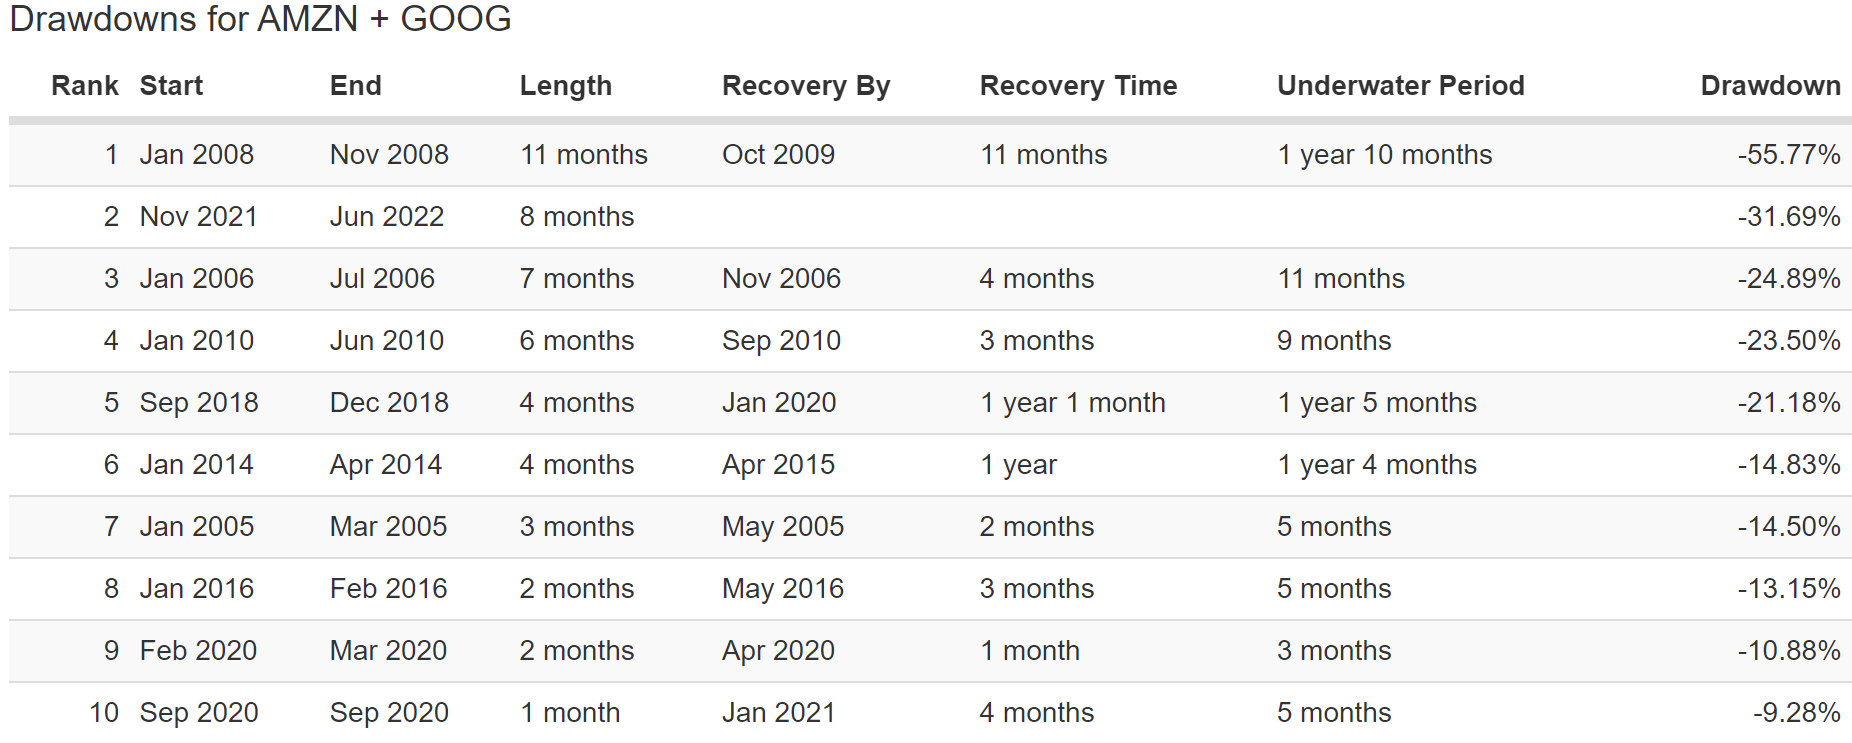
(Source: Portfolio Visualizer Premium)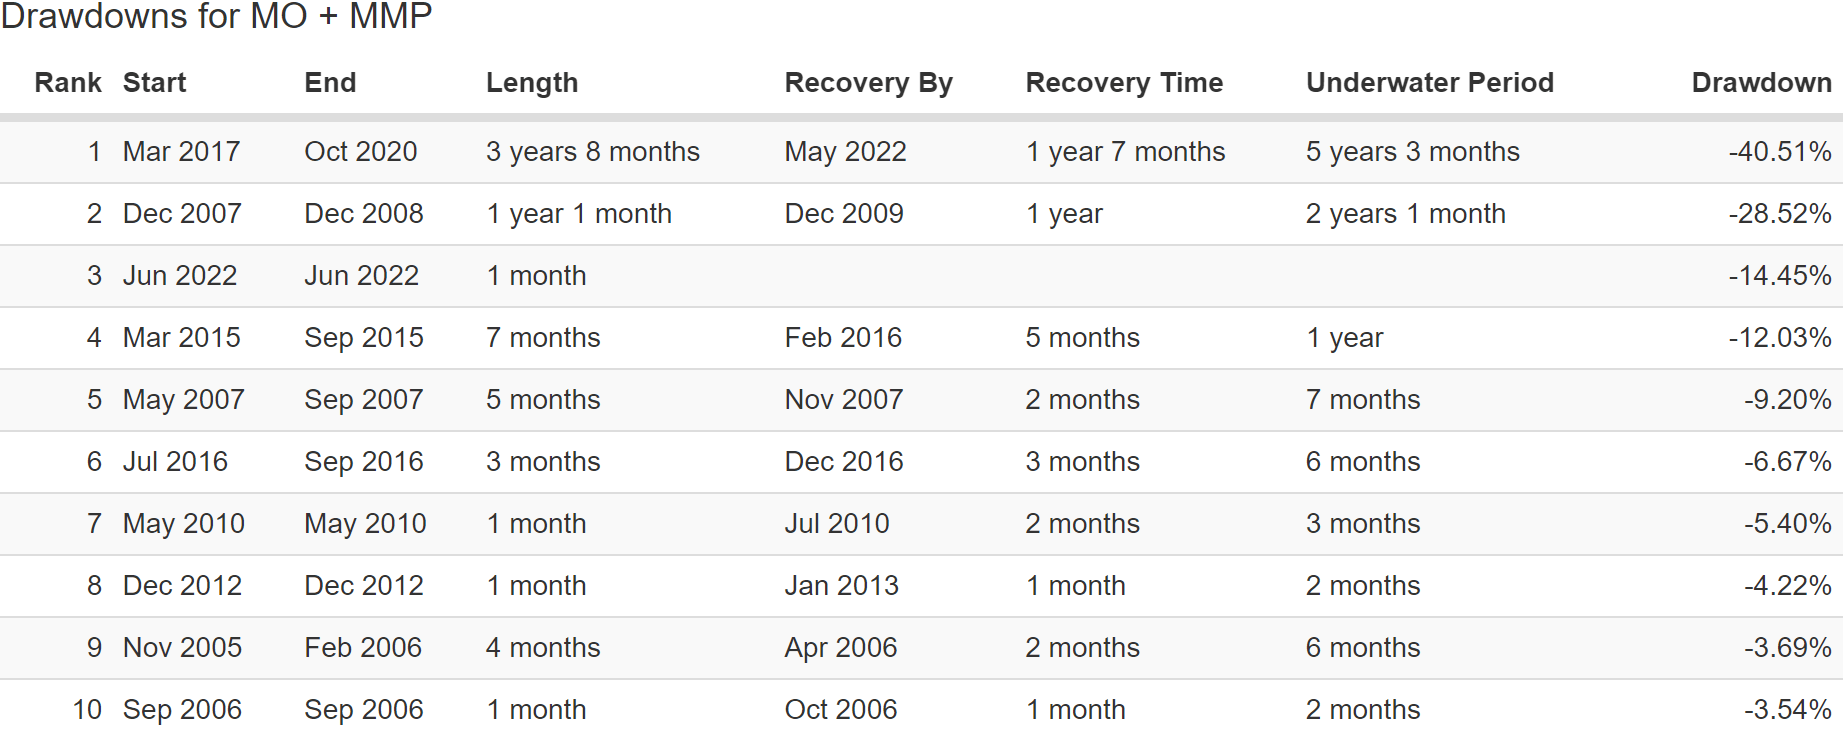
Growth and high-yield have both been through some massive bear markets over the years, including a 32% decline for AMZN and GOOG in 2022.
(Source: Portfolio Visualizer Premium)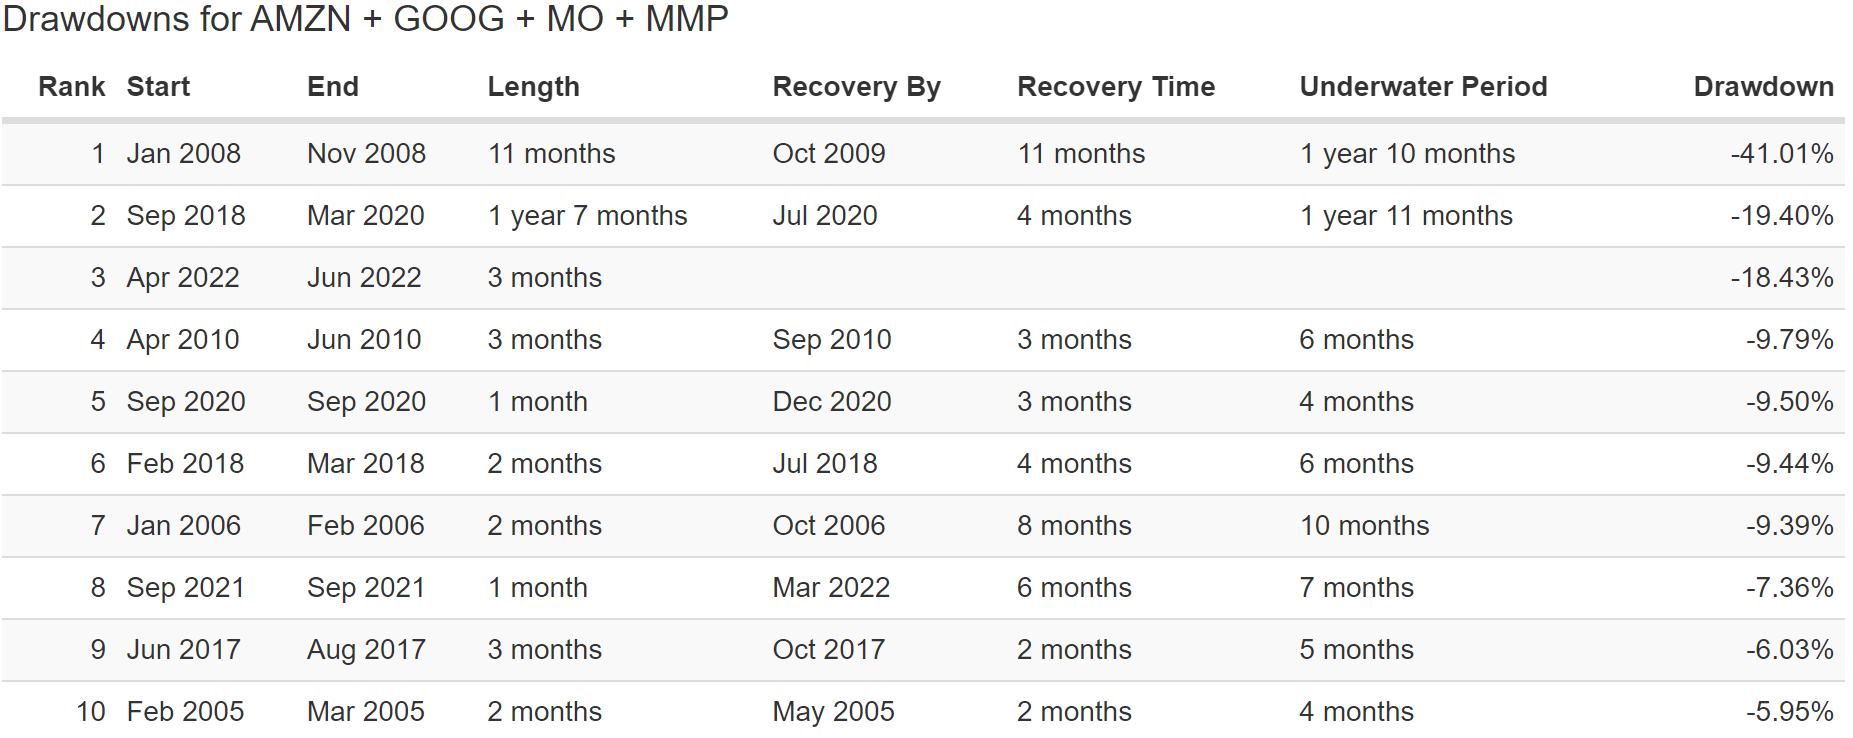
(Source: Portfolio Visualizer Premium)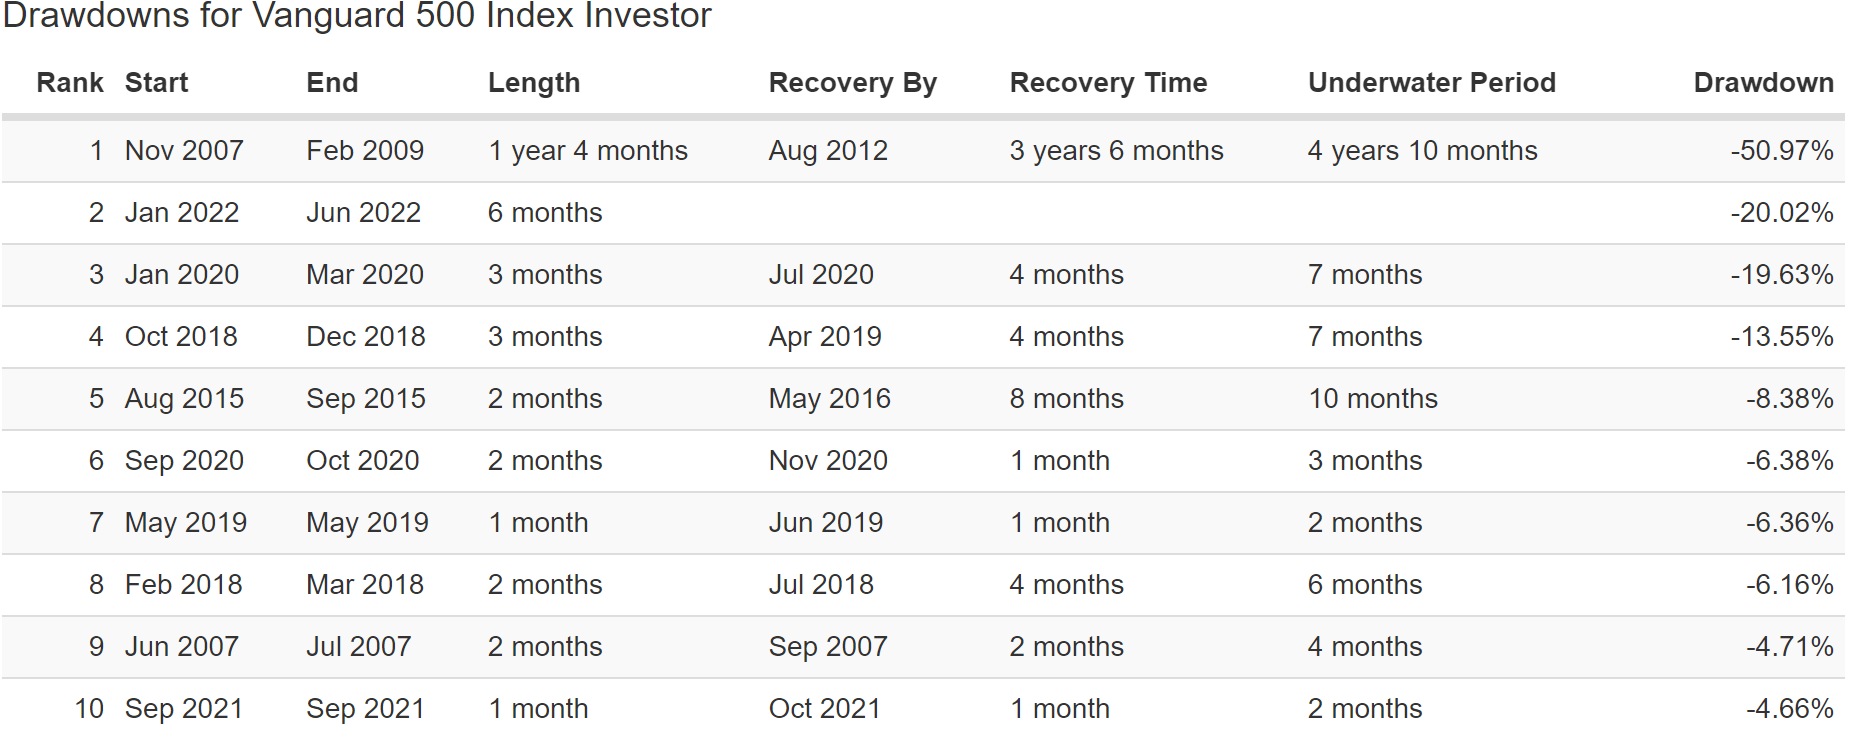
But combine the two strategies, and you get just one bear market since 2004, and the 2022 bear market is just an 18.4% decline, slightly less than the S&P 500’s peak fall.
(Source: Portfolio Visualizer Premium)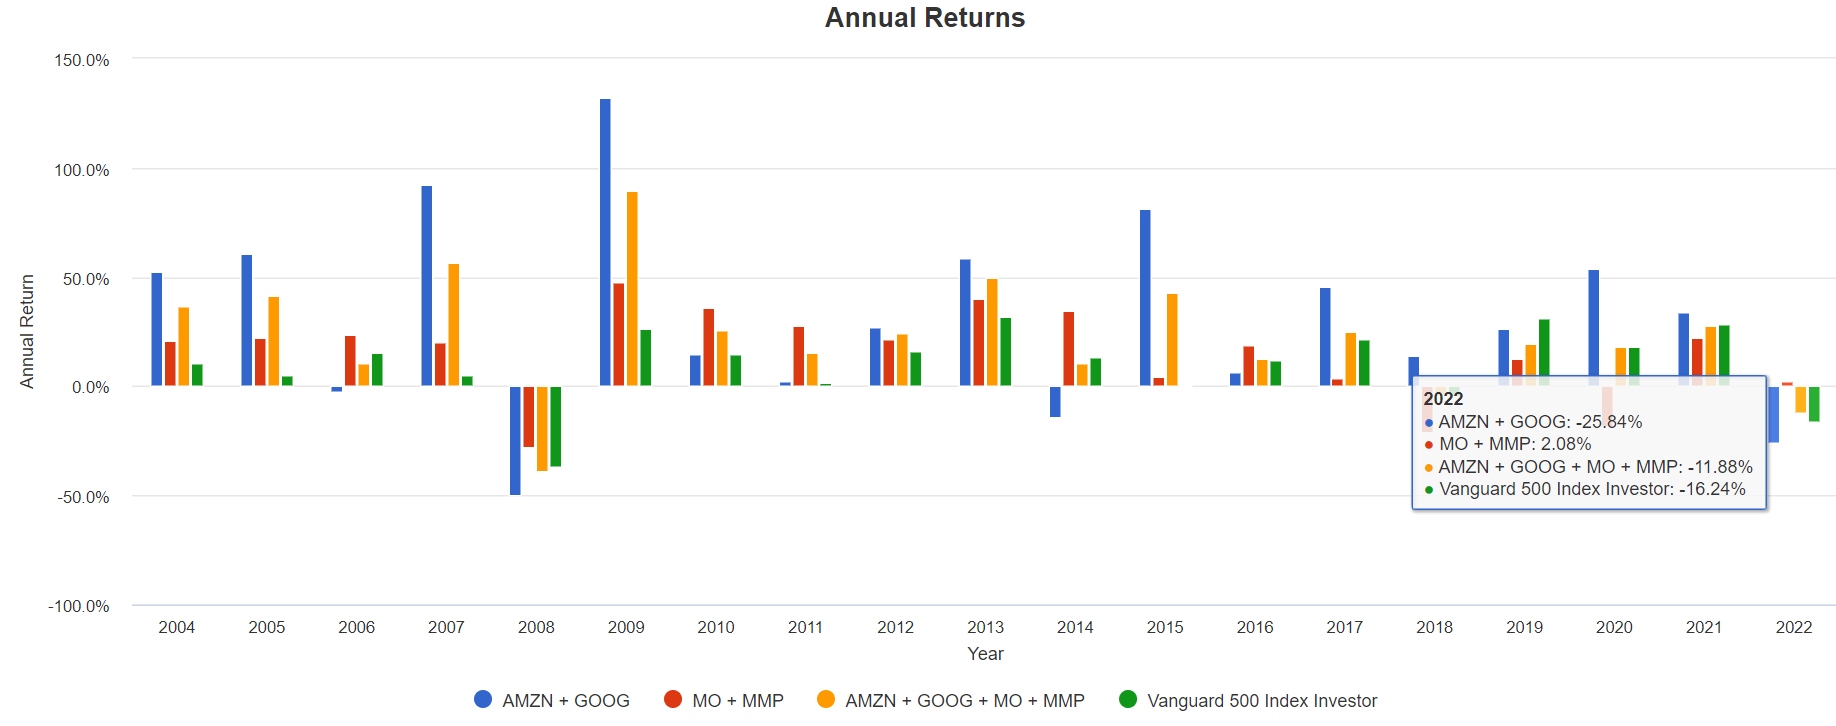
In 2022 MO and MMP are up 2%, while AMZN + GOOG are down 26%. Together, all four Ultra SWANs are down just 12%, a 25% smaller decline than the S&P 500 as of July 24th.
OK, so a high, safe yield, exceptional returns, and lower volatility. That’s wonderful but did I promise superior long-term income? Indeed I did, and that’s what these four Ultra SWANs delivered.
Superior Long-Term Income
2008 Was MO’s Spin-Off Of PM (Source: Portfolio Visualizer Premium)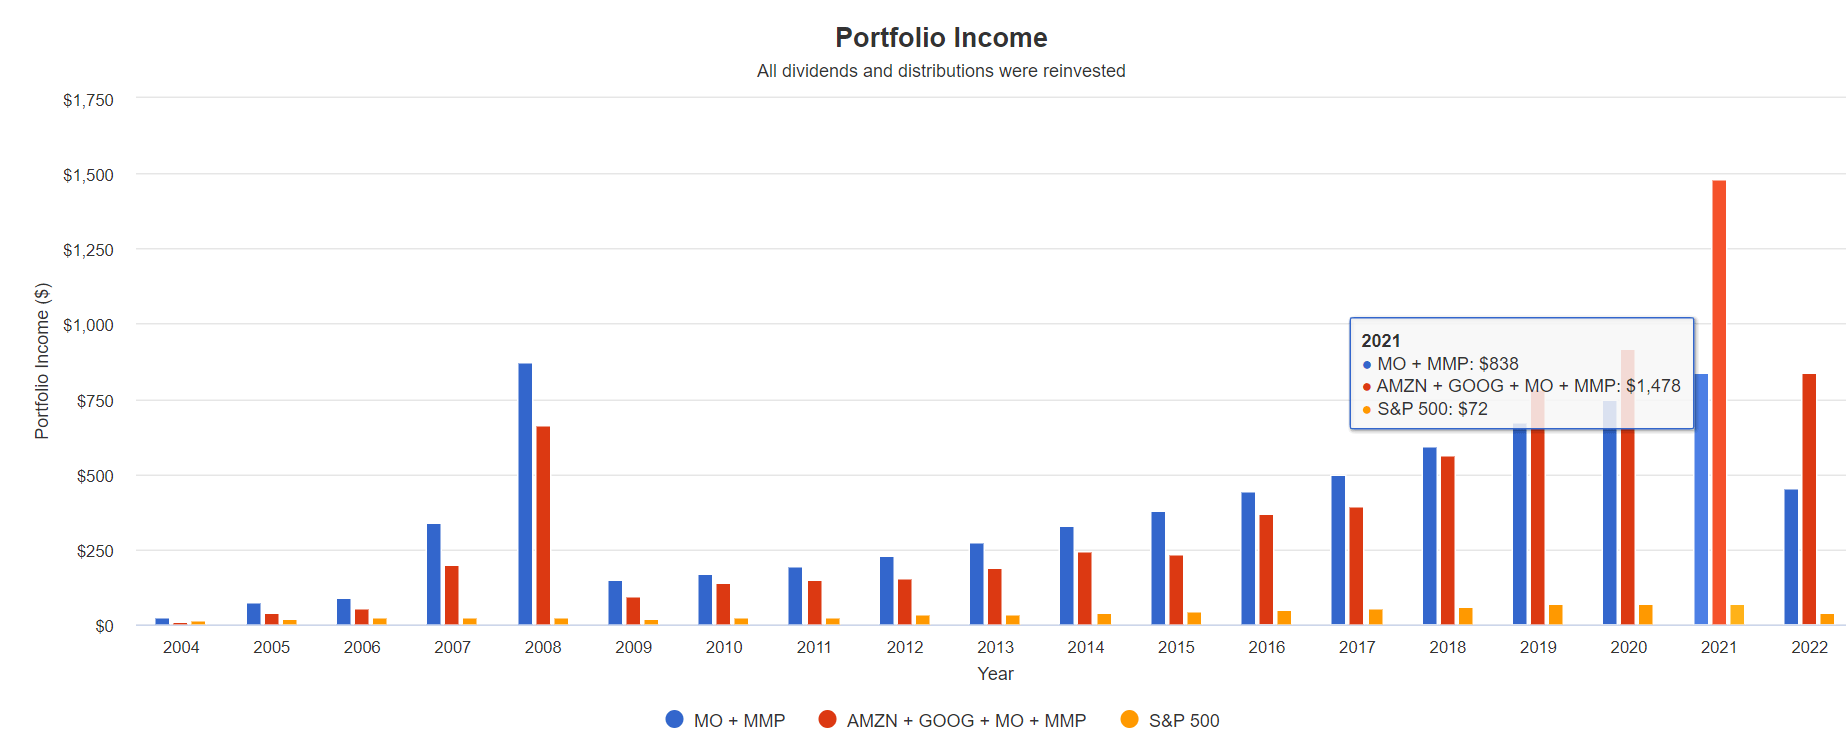
The S&P 500 has delivered 8% annual income growth since 2005 while MO + MMP twice that, a very impressive 16% annually.
| Portfolio | 2005 Income Per $1000 Investment | 2022 Income Per $1000 Investment | Annual Income Growth | Starting Yield |
2022 Yield On Cost |
| S&P 500 | $20 | $74 | 8.00% | 2.0% | 7.4% |
| MO + MMP | $72 | $904 | 16.05% | 7.2% | 90.4% |
| AMZN + GOOG + MO + MMP | $41 | $1,672 | 24.37% | 4.1% | 167.2% |
(Source: Portfolio Visualizer Premium)
But combining Ultra SWAN growth with high-yield? That delivered 3X the income growth of the S&P 500 and 50% higher than MO + MMP alone.
In fact, it turned a 4.1% yield in 2005 into a yield on cost of 167% by 2022.
- not counting the dividends from MO’s spin-offs
- or the August dividend hike analysts expect from MO (7.5% consensus)
Future Income Growth Consensus
| Analyst Consensus Income Growth Forecast | Risk-Adjusted Expected Income Growth | Risk And Tax-Adjusted Expected Income Growth |
Risk, Inflation, And Tax Adjusted Income Growth Consensus |
| 17.5% | 12.2% | 10.4% | 7.9% |
(Source: DK Research Terminal, FactSet)
Obviously, these companies aren’t likely to grow as fast as they have in the past, but analysts still expect an incredible 17.5% annual income growth going forward.
If we adjust for the historical risk of these companies not growing as expected, inflation, and rebalancing taxes, we get a very healthy 8% long-term real expected income growth.
Now compare that to what analysts expect from the S&P 500.
| Time Frame | S&P Inflation-Adjusted Dividend Growth | S&P Inflation-Adjusted Earnings Growth |
| 1871-2021 | 1.6% | 2.1% |
| 1945-2021 | 2.4% | 3.5% |
| 1981-2021 (Modern Falling Rate Era) | 2.8% | 3.8% |
| 2008-2021 (Modern Low Rate Era) | 3.5% | 6.2% |
| FactSet Future Consensus | 2.0% | 5.2% |
(Sources: S&P, FactSet, Multipl.com)
- 1.7% post-tax inflation-adjusted income growth from the S&P 500
- S&P 500’s historical post-tax inflation-adjusted income growth rate (current tax code) is 5.8% CAGR
What about a 60/40 retirement portfolio?
- 0.5% consensus inflation, risk, and tax-adjusted income growth.
Or, to put it another way:
- 2.5X the market’s yield today (and a much safer yield at that)
- with potentially 4.6X faster real income growth than the S&P 500
- and potentially 16X faster real income growth than a 60/40
Even if you assume the S&P 500’s real income growth will continue to be its historical 5.8%, these four Ultra SWANs combining yield and growth still offer almost 3X the income today and about 2% faster income growth over time.
- over 30 years, that’s 87% higher annual income
But we’re only talking about annual income growth rates here. What about cumulative income? That’s where the power of combining yield and growth blue-chips really shines.
More Income + Faster Income Growth + More Wealth = Retiring In Safety And Splendor
| Year | S&P 500 | MO + MMP Income |
AMZN + GOOG + MO + MMP Income |
| Total | $779 | $7,772 | $8,340 |
| Annualized Income Growth Rate | 8.00% | 16.05% | 24.37% |
| Total Income/Initial Investment | 0.78 | 7.77 | 8.34 |
| Inflation-Adjusted Income/Initial Investment | 0.50 | 5.01 | 5.38 |
(Source: Portfolio Visualizer, DK Research Terminal, Bureau of Labor Statistics)
Since 2005 the S&P 500 has paid half an investor’s initial investment in inflation-adjusted dividends.
MO + MMP has delivered 5X your initial investment in inflation-adjusted dividends.
Together, these four Ultra SWANs delivered 5.4X your initial investment in inflation-adjusted dividends and are expected to deliver far superior income growth in the future.
This is why dividend investors should own both growth and yield.
- higher returns
- lower volatility
- less frustration during high-yield bear markets
- MORE SAFE INCOME OVER TIME
OK, so that’s why high-yield + growth blue-chip investing is a great long-term strategy, but why Amazon and Alphabet in particular? Well, for one thing, both are likely to become two of the greatest dividend growth blue-chips of the coming decades.
Reason Three: Amazon And Alphabet Are Likely To Become Two Of The Best Dividend Growth Blue-Chips Of All Time
Right now, neither AMZN nor GOOG pay a dividend or are expected to through at least 2027. But here is why, if both companies grow as expected, a dividend from AMZN and GOOG becomes a virtual mathematical certainty.
Alphabet Balance Sheet Consensus Forecast
| Year | Total Debt (Millions) | Cash | Net Debt (Millions) |
| 2020 | $13,932 | $26,465 | -$122,762 |
| 2021 | $14,817 | $20,945 | -$124,832 |
| 2022 | $15,572 | $41,657 | -$135,219 |
| 2023 | $15,656 | $103,146 | -$122,208 |
| 2024 | $16,180 | $155,779 | -$172,674 |
| 2025 | $13,804 | $274,048 | -$160,913 |
| 2026 | $13,804 | $371,021 | -$264,839 |
| 2027 | $14,817 | $434,354 | -$315,415 |
| Annualized Growth | 0.88% | 49.14% | 14.43% |
(Source: FactSet Research Terminal)
GOOG’s cash pile is expected to grow from $21 billion in 2021 to $435 billion by 2027. Adjusting for its modest debt as well as various working capital requirements, that’s a $315 billion net cash position.
- including the company’s epic and rapidly growing buybacks
For context, Apple (AAPL) started paying a dividend when its cash position (not even net cash) reached $250 billion.
Alphabet Medium-Term Growth Consensus Forecast
| Year | Sales | Free Cash Flow | EBITDA | EBIT (Operating Income) | Net Income |
| 2020 | $182,527 | $42,843 | $67,912 | $41,224 | $40,269 |
| 2021 | $257,637 | $67,012 | $106,531 | $78,714 | $76,033 |
| 2022 | $293,650 | $78,125 | $119,468 | $84,911 | $72,521 |
| 2023 | $334,041 | $89,938 | $136,872 | $96,792 | $83,877 |
| 2024 | $369,464 | $107,701 | $156,529 | $112,130 | $94,951 |
| 2025 | $410,531 | $126,306 | $169,376 | $122,840 | $109,753 |
| 2026 | $460,856 | $141,327 | $186,972 | $135,911 | $116,820 |
| 2027 | $516,905 | $158,784 | $217,741 | $158,226 | $135,016 |
| Annualized Growth | 16.03% | 20.58% | 18.11% | 21.18% | 18.87% |
| Annualized Growth (Post Pandemic) | 12.31% | 15.46% | 12.65% | 12.34% | 10.04% |
| Cumulative (2022 Through 2027) | $2,385,447 | $543,397 | $769,217 | $552,584 | $477,922 |
(Source: FactSet Research Terminal)
GOOG is such a cash machine it’s converting 114% of earnings into free cash flow.
- what’s left over after spending on future growth
- $32.3 billion in 2022 consensus capex
- $39.1 billion in 2022 consensus R&D
- $43.2 billion on SG&A
- $114.6 billion in total growth spending in 2022
- and $78.1 billion in free cash flow left over
GOOG’s growth spending in 2022 alone is larger than the GDP of all but 59 countries on earth.
Through 2027 it’s expected to generate:
- $2.4 trillion in sales
- $544 billion in free cash flow
What does that mean in terms of a potential dividend and buybacks?
- GOOG’s consensus retained free cash flow through 2027 is enough to potentially buyback 38% of shares at current valuations
| Year | Dividend Consensus | FCF/Share Consensus |
| 2022 | $0.00 | $6.07 |
| 2023 | $0.00 | $7.23 |
| 2024 | $0.00 | $9.72 |
| 2025 | $0.00 | $14.06 |
| 2026 | $0.00 | $16.41 |
| 2027 | $0.00 | $19.27 |
| Total 2022 Through 2027 | $0.00 | $72.76 |
| Annualized Rate | NA | 25.99% |
(Source: FactSet Research Terminal)
GOOG is expected to buy back so much stock that its FCF/share grows by 26% per year.
- including 17% FCF share growth in 2027
- a year it’s expected to generate $159 billion in free cash flow
How much stock is GOOG expected to buy back in the coming years?
Alphabet Buy Back Consensus Forecast
| Year | Consensus Buybacks ($ Millions) | % Of Shares (At Current Valuations) | Market Cap |
| 2022 | $52,005 | 3.8% | $1,440,025 |
| 2023 | $55,126 | #REF! | $1,440,025 |
| 2024 | $56,705 | 3.9% | $1,440,025 |
| 2025 | $75,784 | 5.3% | $1,440,025 |
| 2026 | $84,796 | 5.9% | $1,440,025 |
| 2027 | $95,271 | 6.6% | $1,440,025 |
| Total 2022-2027 | $367,682 | 25.5% | $1,440,025 |
| Annualized Rate | 4.79% | Average Annual Buybacks | $61,280 |
(Source: FactSet Research Terminal)
Analysts currently expect GOOG to average $61 billion in buybacks through 2027, for a total of $368 billion.
- 2027 consensus buybacks of $95 billion is larger than the GDP of all but 64 countries on earth
And after spending $368 billion on repurchasing its own stock? GOOG is still expected to have $315 billion in net cash and be generating almost $160 billion in annual free cash flow, growing at 17% per year!
- GOOG will have to pay a dividend one day if it grows as expected
- big institutions that own it simply won’t allow its cash pile to grow to the sky
What about Amazon? Here the consensus forecasts are even more incredible.
Amazon Balance Sheet Consensus Forecast
| Year | Total Debt (Millions) | Cash | Net Debt (Millions) |
| 2020 | $31,816 | $42,122 | -$5,079 |
| 2021 | $48,744 | $36,220 | -$20,346 |
| 2022 | $51,750 | $68,289 | -$3,269 |
| 2023 | $51,586 | $99,454 | -$25,610 |
| 2024 | $48,772 | $147,232 | -$67,123 |
| 2025 | $47,108 | $243,955 | -$86,463 |
| 2026 | $47,108 | $370,913 | -$166,404 |
| 2027 | $46,691 | $464,732 | -$239,566 |
| Annualized Growth | 5.63% | 40.91% | 73.42% |
(Source: FactSet Research Terminal)
Analysts expect AMZN’s net cash position to grow at 73% annually through 2027, reaching $239 billion in cash by the end of that year.
Total cash is expected to reach $465 billion.
- larger than the GDP of all but 24 countries on earth
How fast is Amazon expected to grow AFTER the pandemic pulled forward so much sales demand?
Amazon Medium-Term Growth Consensus Forecast
| Year | Sales | Free Cash Flow | EBITDA | EBIT (Operating Income) | Net Income |
| 2020 | $386,064 | $31,018 | $57,284 | $22,899 | $21,331 |
| 2021 | $469,822 | -$9,069 | $71,994 | $24,879 | $33,364 |
| 2022 | $519,694 | $7,417 | $73,079 | $17,327 | $8,563 |
| 2023 | $602,268 | $32,758 | $91,346 | $33,270 | $26,672 |
| 2024 | $687,743 | $60,234 | $115,589 | $53,315 | $42,924 |
| 2025 | $770,786 | $82,266 | $144,580 | $75,857 | $62,867 |
| 2026 | $864,061 | $127,737 | $181,960 | $99,503 | $87,852 |
| 2027 | $968,314 | $162,439 | $217,776 | $130,649 | $115,802 |
| Annualized Growth | 14.04% | 26.69% | 21.02% | 28.25% | 27.34% |
| Annualized Growth (Post Pandemic) | 12.81% | NA | 20.26% | 31.84% | 23.05% |
| Cumulative (2022 Through 2027) | $4,412,866 | $310,412 | $606,554 | $279,272 | $228,878 |
(Source: FactSet Research Terminal)
AMZN is converting 136% of net income into free cash flow, one of any company’s highest cash conversion rates.
It’s expected to generate $4.4 trillion in sales through 2027 and turn $310 billion of that into free cash flow. In 2027 it’s expected to generate $162 billion in free cash flow.
- after spending $74.5 billion on SG&A growth spending in 2027
- after spending $92.8 billion in R&D in 2027
- after spending $62.9 billion on capex
- $162 billion in free cash flow in 2027 (greater than the GDP of all but 54 countries on earth)
- after spending $230.2 billion on growth in 2027 (greater than the GDP of all but 45 countries on earth)
In 2027 analysts expect AMZN to grow its free cash flow by 27% off a base of $128 billion in 2026.
For context, the US government, the richest government in history, is planning on spending an average of $125 billion over the next decade on infrastructure.
- Amazon is on track to spend 2X as much on growth as the US government by the end of the decade.
And even after spending that much on growth, it’s expected to have $162 billion left over, adding to its cash pile of almost $500 billion, $240 billion net of debt and contractual obligations.
Amazon’s retained free cash flow of $310 billion is enough to potentially buy back 25% of its shares at current valuations. How much do analysts actually expect Amazon to spend on buybacks?
Amazon Buy Back Consensus Forecast
| Year | Consensus Buybacks ($ Millions) | % Of Shares (At Current Valuations) | Market Cap |
| 2022 | $3,041 | 0.1% | $1,241,786 |
| 2023 | $667 | 0.1% | $1,241,786 |
| 2024 | $755 | 0.1% | $1,241,786 |
| Total 2022-2024 | $4,463 | 0.4% | $1,241,786 |
| Annualized Rate | 0.03% | Average Annual Buybacks | $1,488 |
(Source: FactSet Research Terminal)
Analysts expect Amazon to tap just 45% of its $10 billion buyback authorization through 2024 and average $1.5 billion per year on repurchases.
Do you see why I’m so bullish on Amazon one day buying back a lot more stock and paying a rapidly growing dividend? Eventually, even with an exciting new world to conquer (healthcare) AMZN’s growth spending simply won’t be able to justify not paying a dividend and repurchasing more shares than any company in history.
Reason Four: Amazon And Alphabet Are Coiled Springs
Ycharts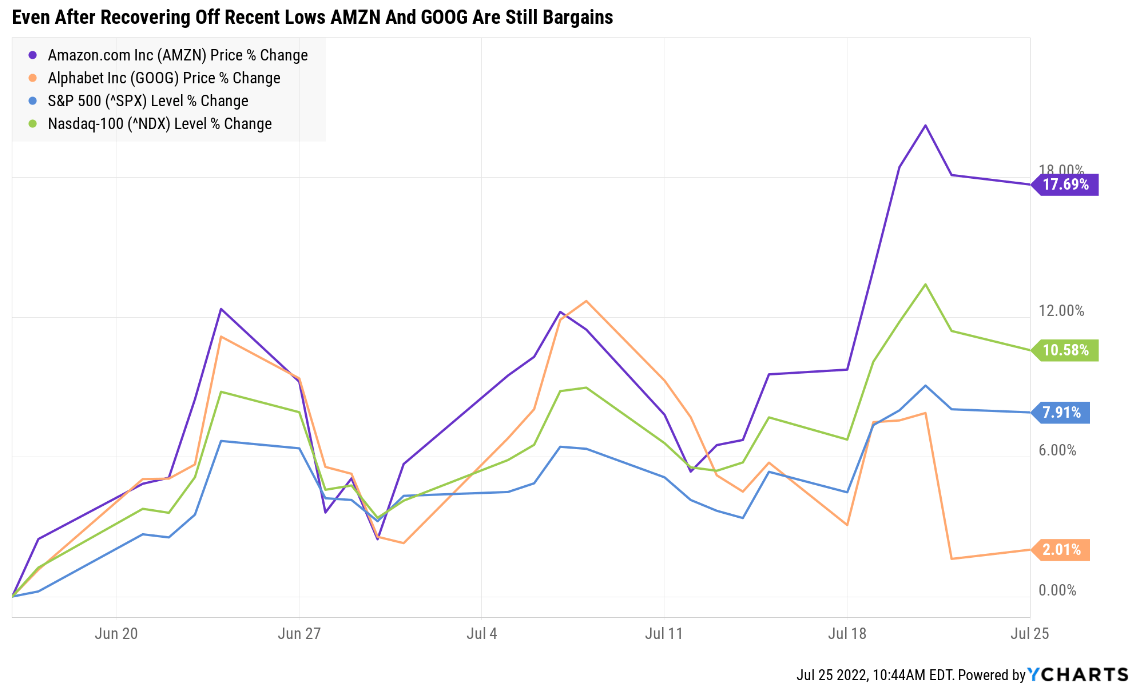
AMZN is up 18% off the June 16th market low, and GOOG is trading near its low after SNAP sent all communication stocks crashing last week.
What does that mean for potential investors in both companies?
Alphabet Is 30% Historically Undervalued
| Metric | Historical Fair Value Multiples (all years) | 2021 | 2022 | 2023 | 2024 | 2025 | 12-Month Forward Fair Value |
| Earnings | 25.62 | $143.73 | $139.89 | $164.99 | $188.56 | $224.18 | |
| Average | $143.73 | $139.89 | $164.99 | $188.56 | $224.18 | $153.89 | |
| Current Price | $107.96 | ||||||
|
Discount To Fair Value |
24.89% | 22.82% | 34.57% | 42.75% | 51.84% | 29.84% | |
| Upside To Fair Value | 33.13% | 29.57% | 52.83% | 74.66% | 107.65% | 42.54% | |
| 2022 EPS | 2023 EPS | 2022 Weighted EPS | 2023 Weighted EPS | 12-Month Forward PE | 12-Month Average Fair Value Forward PE |
Current Forward PE |
|
| $5.46 | $6.44 | $2.42 | $3.59 | $6.01 | 25.6 | 18.0 |
I estimate GOOG is historically fairly valued at 25.6X earnings, and today it trades at 18.0X earnings.
- 10.9X cash-adjusted earnings
- a cash-adjusted PEG ratio of 0.75
|
Analyst Median 12-Month Price Target |
Morningstar Fair Value Estimate |
| $152.08 (23.6 PE) | $180 (30 PE) |
|
Discount To Price Target (Not A Fair Value Estimate) |
Discount To Fair Value |
| 29.01% | 40.02% |
|
Upside To Price Target (Not Including Dividend) |
Upside To Fair Value (Not Including Dividend) |
| 40.87% | 66.73% |
Morningstar’s discounted cash flow model estimates GOOG is fairly valued at 30X earnings and that it is 40% undervalued today, with 67% upside to fair value.
Analysts expect GOOG to trade at 23.6X earnings in 12 months, delivering a 41% total return.
- 43% 12-month return would be justified by fundamentals
Alphabet 2024 Consensus Total Return Potential
(Source: FAST Graphs, FactSet Research)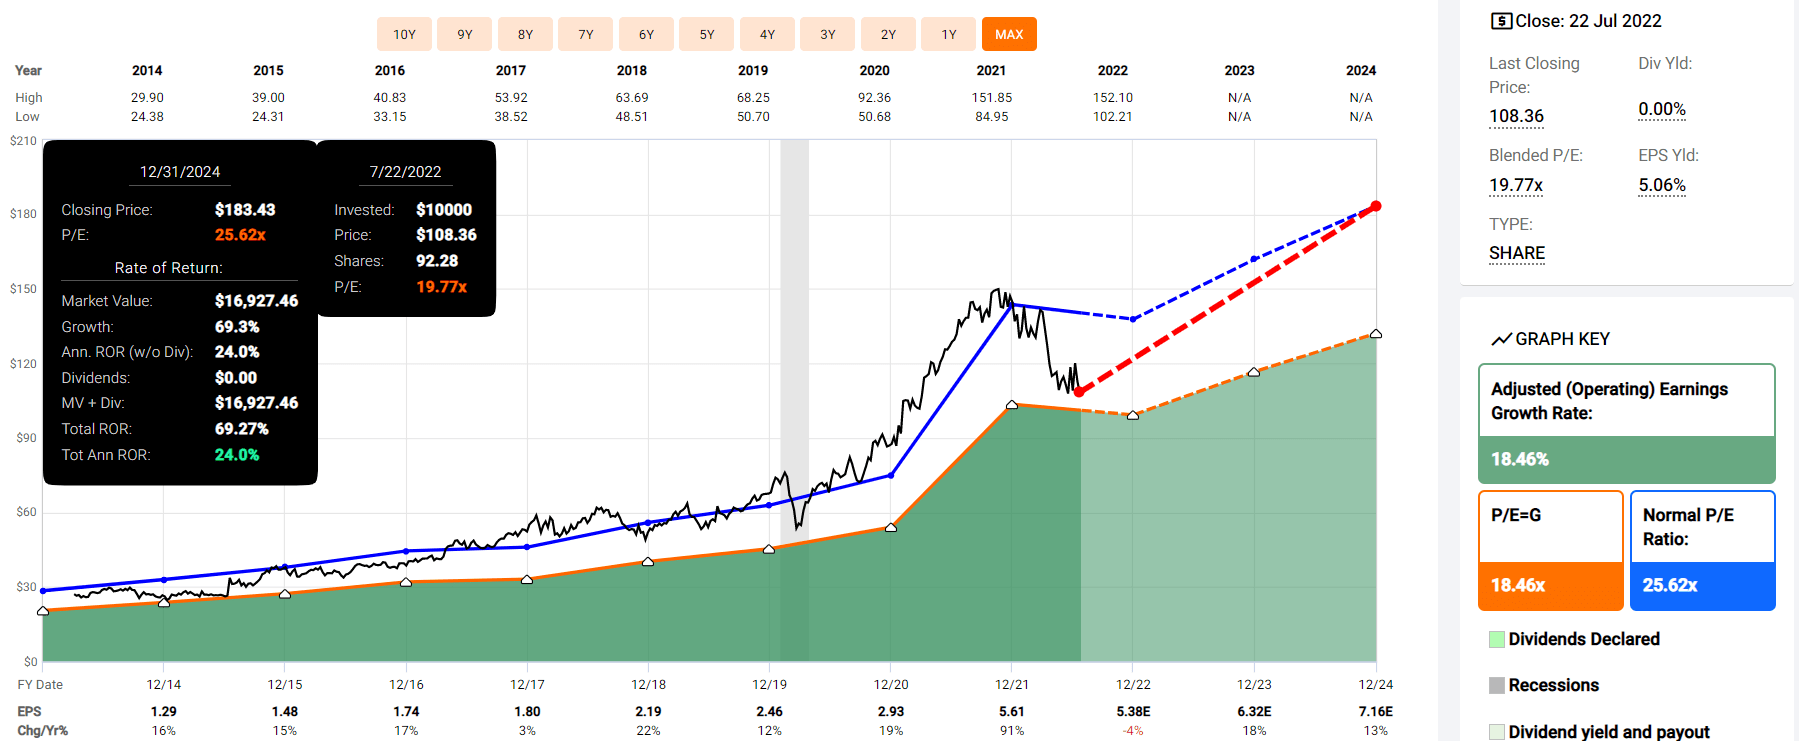
If GOOG grows as expected through 2024 and returns to its market-determined historical 25.6X earnings, then investors will make 24% annual returns.
- over 2X the S&P 500 consensus
- Buffett-like returns from a blue-chip bargain hiding in plain sight
Alphabet 2027 Consensus Total Return Potential
(Source: FAST Graphs, FactSet Research)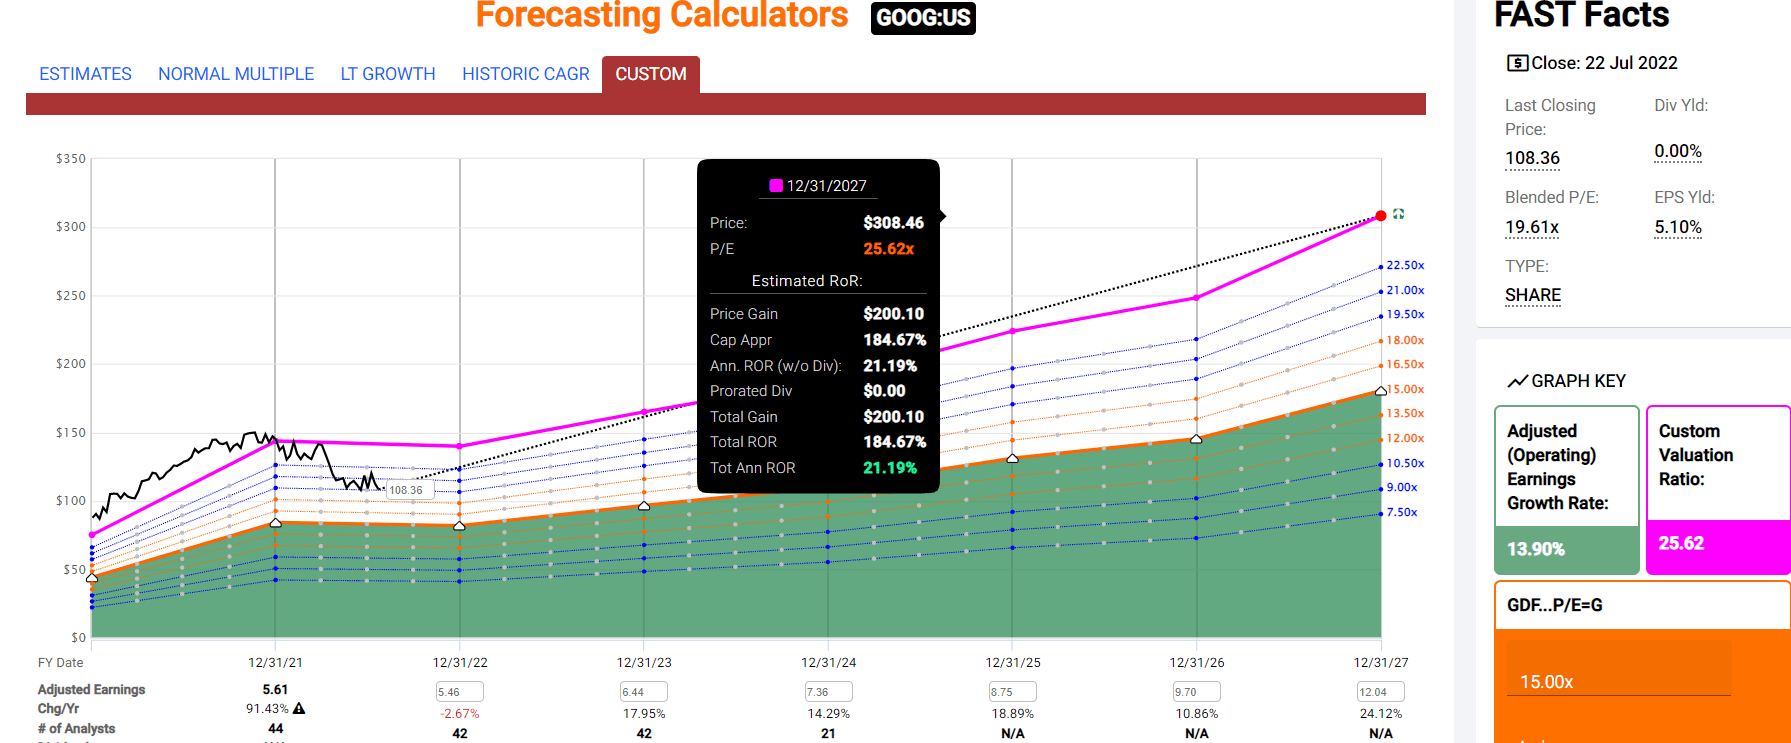
Through 2027 if GOOG grows as expected and returns to historical fair value, investors will earn 185% total returns, nearly tripling their money and earning Buffett-like 21% annual returns.
Now compare that to the S&P 500 consensus.
S&P 2024 Consensus Total Return Potential
(Source: FAST Graphs, FactSet) (Source: FAST Graphs, FactSet)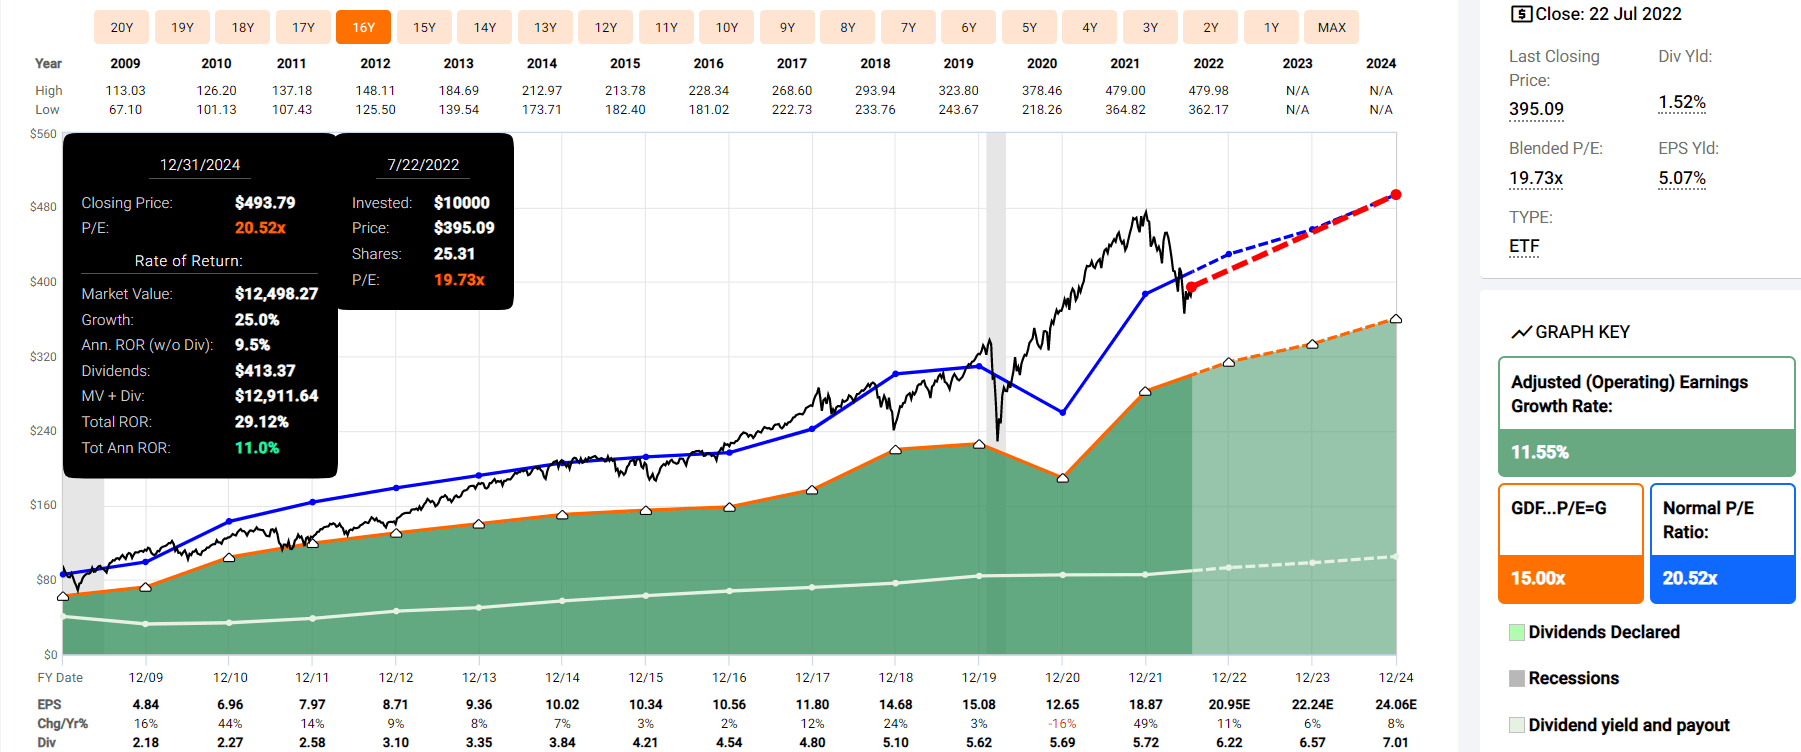
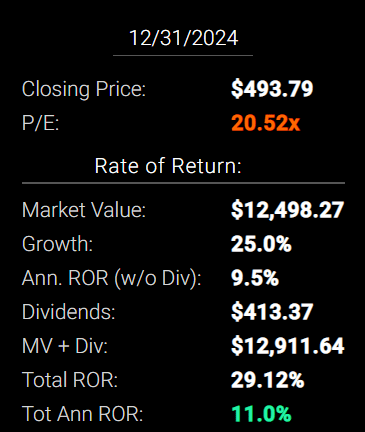
Analysts expect about 29% total returns or 11% annual returns from the S&P 500 over the next 2.5 years.
S&P 500 2027 Consensus Total Return Potential
| Year | Upside Potential By End of That Year | Consensus CAGR Return Potential By End of That Year | Probability-Weighted Return (Annualized) | Inflation And Risk-Adjusted Expected Returns | Expected Market Return Vs. Historical Inflation-Adjusted Return |
Years To Double |
| 2027 | 53.77% | 8.99% | 6.74% | 4.63% | 68.09% | 15.55 |
(Source: Dividend Kings Market Valuation And Total Return Tool)
Analysts expect 54% total returns or 9.0% CAGR from the market over the next five years.
And what about Amazon?
Amazon Is 43% Historically Undervalued
| Metric | Historical Fair Value Multiples (14-Years) | 2021 | 2022 | 2023 | 2024 | 2025 |
12-Month Forward Fair Value |
| Operating Cash Flow | 25.98 | $116.91 | $173.29 | $247.07 | $308.38 | $340.08 | |
| Average | $116.91 | $173.29 | $247.07 | $308.38 | $340.08 | $214.43 | |
| Current Price | $121.76 | ||||||
|
Discount To Fair Value |
-4.15% | 29.73% | 50.72% | 60.52% | 64.20% | 43.22% | |
| Upside To Fair Value | -3.98% | 42.32% | 102.92% | 153.27% | 179.30% | 76.11% | |
| 2022 OCF | 2023 OCF | 2022 Weighted OCF | 2023 Weighted OCF | 12-Month Forward OCF | 12-Month Average Fair Value Forward P/OCF |
Current Forward P/OCF |
|
| $6.67 | $9.51 | $2.95 | $5.30 | $8.25 | 26.0 | 14.8 |
AMZN is historically worth about 26X operating cash flow and today trades at a 43% historical discount at just 14.8X.
- 16.2X cash-adjusted earnings
- a cash-adjusted PEG ratio of 0.73
AMZN isn’t just growth at a reasonable price, it’s hyper-growth at a wonderful price.
|
Analyst Median 12-Month Price Target |
Morningstar Fair Value Estimate |
| $168.74 (20.4X cash flow) | $192.00 (23.3X cash flow) |
|
Discount To Price Target (Not A Fair Value Estimate) |
Discount To Fair Value |
| 27.84% | 36.58% |
|
Upside To Price Target |
Upside To Fair Value |
| 38.58% | 57.69% |
Morningstar’s discounted cash flow model estimates AMZN is worth 23.3X cash flow and that it has a 58% upside to fair value.
Analysts expect 39% total returns in the next year and up to 76% total returns within 12 months would be justified by fundamentals.
Amazon 2024 Consensus Total Return Potential
(Source: FAST Graphs, FactSet)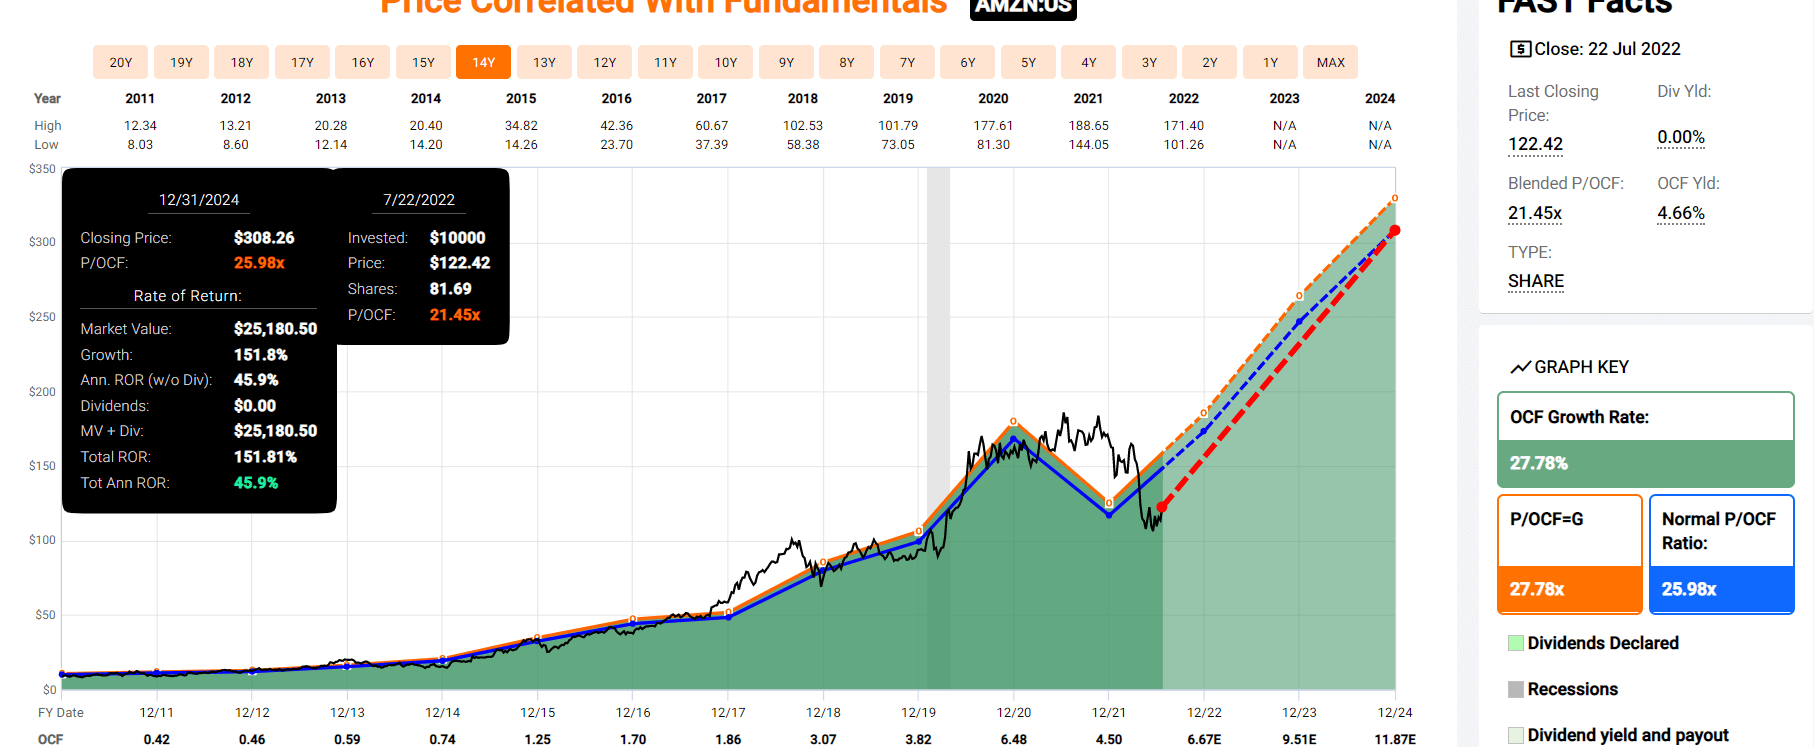
If AMZN grows as expected through 2024 and returns to its market-determined historical 26X cash flow, then investors will make 46% annual returns.
- about 5X the S&P 500 consensus
- Buffett-like returns from a blue-chip bargain hiding in plain sight
Amazon 2027 Consensus Total Return Potential
(Source: FAST Graphs, FactSet Research)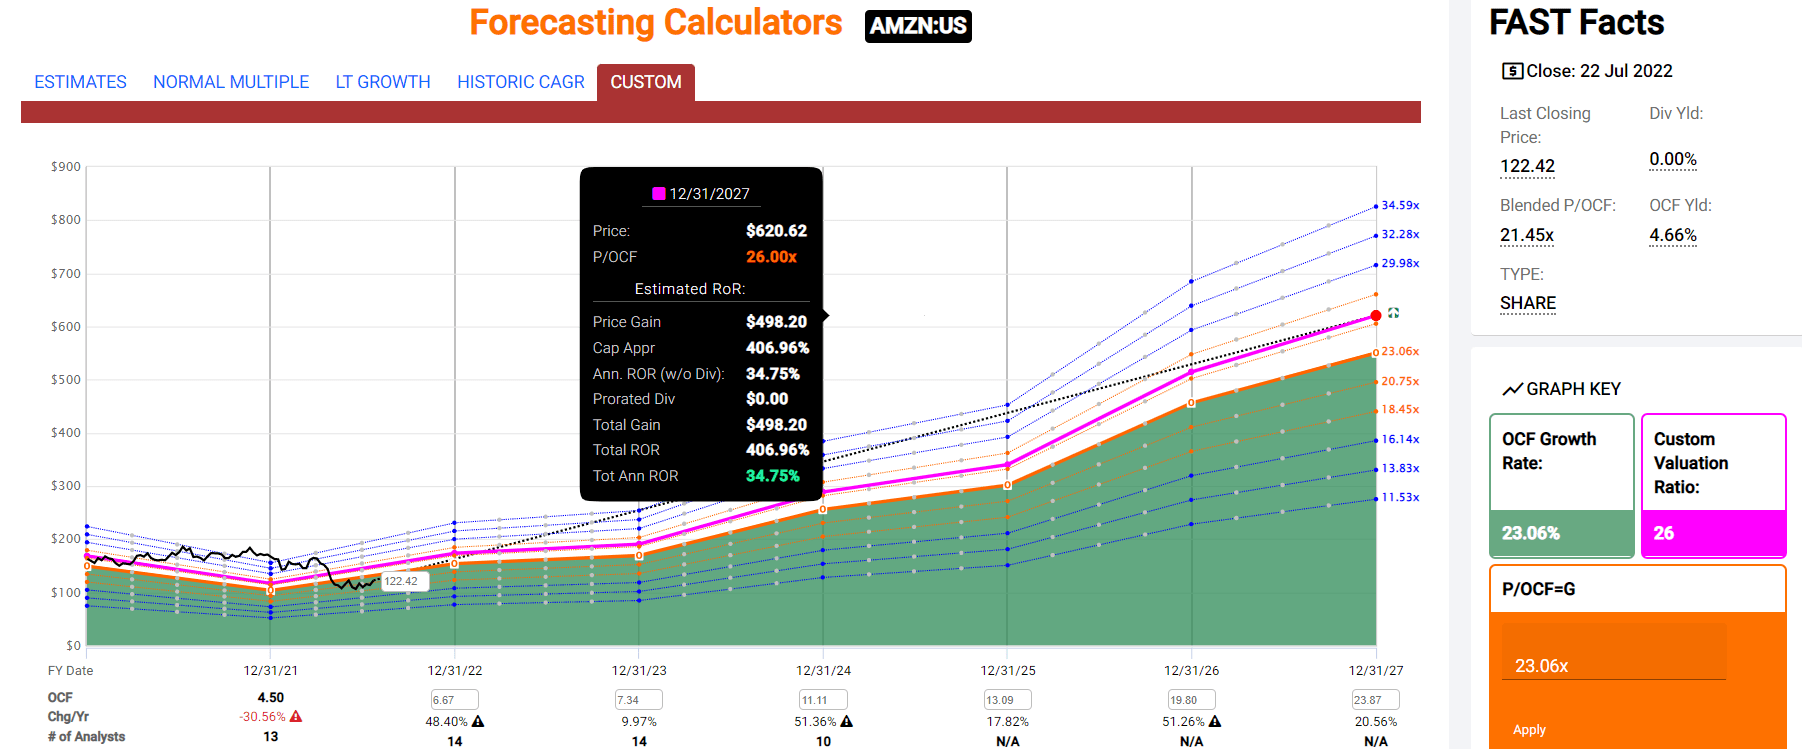
Through 2027 if AMZN grows as expected and returns to historical fair value, investors will earn 407% total returns, a 5X bagger that delivers 35% annual returns.
- more than 7X the S&P 500 consensus
- Buffett-like returns for the next five years
- from the most obvious blue-chip hyper-growth bargain on Wall Street
Just how amazing are GOOG and AMZN as potential investments today?
DK Dividend Kings Automated Investment Decision Tool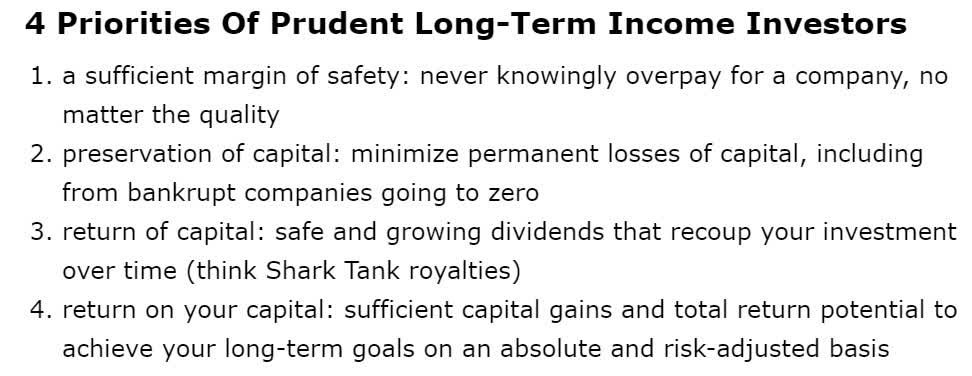
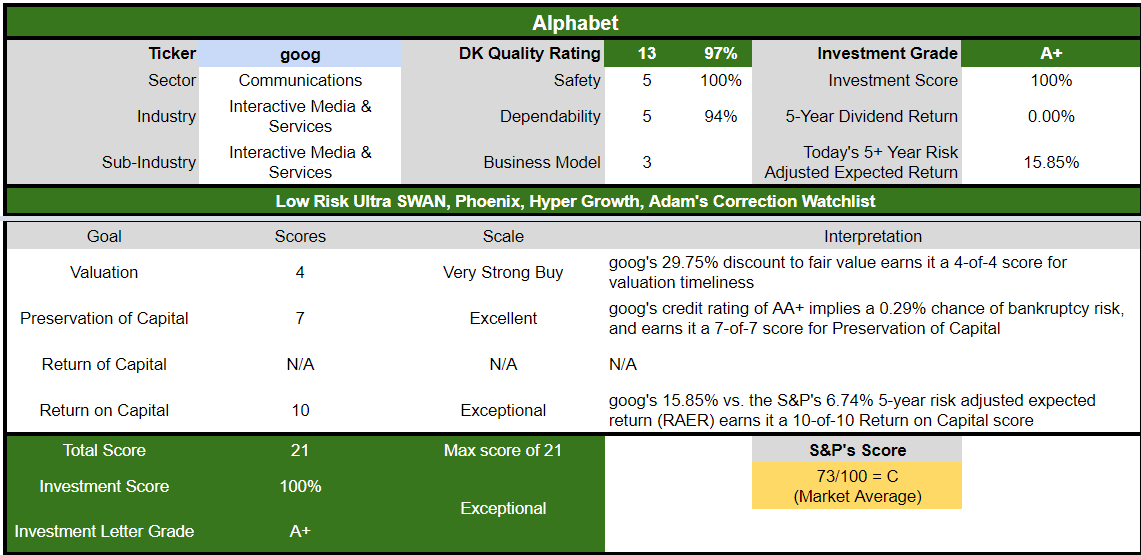
For anyone comfortable with its risk profile, GOOG is as close to a perfect Ultra SWAN growth stock as exists on Wall Street with 2.5X higher risk-adjusted expected returns than the S&P 500 over the next five years.
Dividend Kings Automated Investment Decision Tool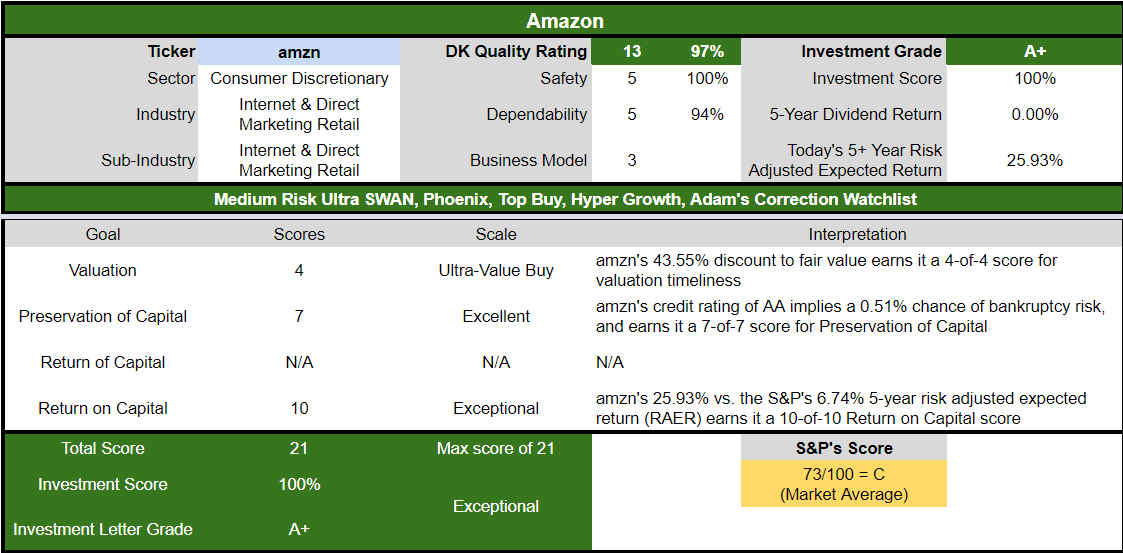
For anyone comfortable with its risk profile, AMZN is as close to a perfect hyper-growth Ultra SWAN bargain as exists, with 4X the risk-adjusted expected returns of the S&P 500 over the next five years.
Bottom Line: Amazon And Alphabet Should Be In Every Dividend Investor’s Portfolio
There is nothing wrong with retirees choosing to own only high-yield blue-chips…as long as they represent safe and sustainable yield that grows over time.
However, almost all income growth investors can benefit from a bar-bell approach that combines high-yield blue-chips with growth blue-chips such as Amazon and Alphabet.
- maximizes long-term income growth
- increases returns
- helps ride out high-yield bear markets (which are inevitable)
For example, according to analyst forecasts, combining GOOG and AMZN with high-yield Ultra SWANs like MO and MMP delivers a very safe 4.2% yield today and 18% long-term annual income growth in the future.
- vs 24% annual income growth since 2005
- 3X faster income growth than the S&P 500
- 50% faster income growth than MO + MMP on their own
In fact, in the last 17 years alone, these four Ultra SWANs have delivered 6X your initial investment in inflation-adjusted dividends, which continue to grow at rates far above what the S&P 500 or dividend aristocrats.
AMZN and GOOG represent two of the most free cash-flow rich wide moat tech blue-chips, with mountains of cash that are expected to soar to $500 billion by the end of the decade.
If both companies grow as expected, a dividend from AMZN and GOOG is a mathematical certainty, even with massive buybacks that amount to almost $400 billion by 2027 alone.
Combined with both companies’ incredible valuations, a 30% discount for GOOG and a 43% discount for AMZN, and you have two of the fattest pitch coiled spring growth blue-chips on Wall Street.
Ones that analysts think could deliver 40% returns in just the next year alone.
My goal isn’t to help you score a quick 40% gain, though both AMZN and GOOG could fundamentally do just that. My goal is to help you achieve life-changing income and wealth from some of the best blue-chip bargains hiding in plain sight.
Charlie Bilello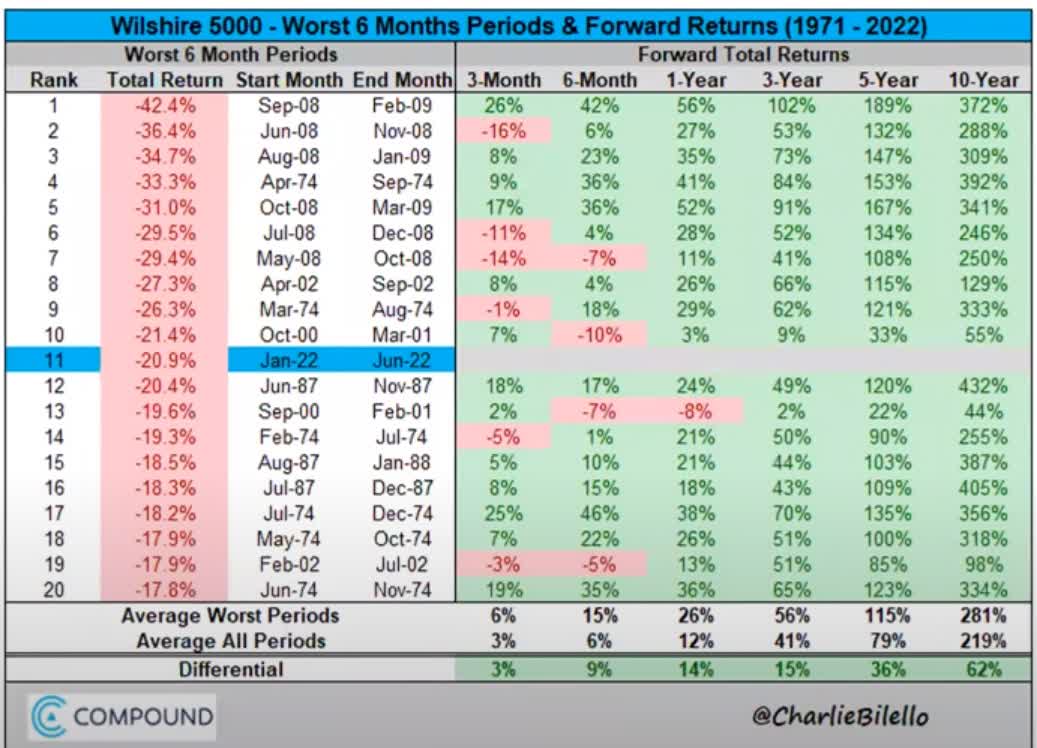
- buying stocks after a terrible 6 months historically results in 4% to 6% higher annual returns for the next decade
- an average 281% 10-year total return = 14.3% CAGR = returns on par with the greatest investors in history
- almost quadruple your money over the next decade
- if you can stay calm and look beyond the short-term fear, uncertainty, and doubt or FUD
The S&P 500 is likely set for an epic decade of high returns once this bear market is over. And individual blue-chips like AMZN, GOOG are likely to perform even better.
- Amazon’s consensus return potential is 7X that of the S&P 500 over just the next five years alone.
If you’re willing to wait out the hell of this bear market, then heaven likely awaits.
Whether you’re focus is on maximizing safe yield today or safe income over time, the world’s best blue-chips are ready to work hard for you so that one day you don’t have to.
Be the first to comment