

alf255
Introduction
We entered this year from a bull market in 2021. Everyone’s stock price was climbing, including my high yield stocks. It was understandable, coming out of the 2020 pandemic with all the pent-up consumer demand celebrating the reopening of the economy.
We all seemed like winners – until we entered 2022, when the Fed began increasing the overnight lending rates to fight inflation. The market responded with multiple S&P 500 bear markets in June and September.
This year, I experimented with a unique system to purchase investments using two parameters plotted on one chart (see Chart-3). I call this method the TEA/POT (Trade Email Alert / Portfolio Online Tracker) strategy that sends email messages of possible oversold or overbought stocks directly to my cellphone during market hours.
In both bear markets in June and September 2022, I was able to purchase income shares at very low prices, as my two previous articles described. The experiment has been a success and I’ll continue using this technique in the following year.
This year has been the best year ever in creating income for both my retirement distribution and portfolio income growth. Listed in Table-1 to 3 and Chart-1, I display the individual stocks in creating the 20.6% dividend growth.
As I mentioned in previous articles, price fear is a powerful force to overcome, especially when it comes to investing. This is the main reason I removed my focus from price to the tangible cash flow income method. When I see the price of my holdings drop in value, I rejoice in the prospect of purchasing more shares and growing my cash flow. Investing has become very simple to implement when you know how the market works.
High-Yield Portfolio
Companies listed in the table below are RIC (Regulated Investment Company) investments. They are pass-through companies that require to distribute 90% of their earnings to the shareholder that prevents double taxation. The income tax is passed to shareholders as ordinary income most suitable in a tax shelter. This is one reason for the higher yield from these investments.
In Table-1 to 3, the “%CapAlloc” and “%IncAlloc” headings in the table calculate the total allocation of investment capital and dividends.
The “DivChg” is the dividend change from December 31, 2021 to current date.
The “Special” heading is simply the Special Dividends distributed during the 2022 year.
|
Portfolio Yield at 11% Table-1: Nov 30, 2022 |
||||||
|
Type |
Symbol |
Yield |
%CapAlloc |
%IncAlloc |
DivChg |
Special |
|
BDC |
(ARCC) |
9.8% |
10.2% |
9.1% |
17.1% |
4.9% |
|
BDC |
(TSLX) |
9.6% |
8.9% |
7.7% |
9.8% |
26.7% |
|
BDC |
(CSWC) |
11.5% |
7.8% |
8.2% |
10.6% |
9.2% |
|
BDC |
(HTGC) |
10.2% |
8.3% |
7.7% |
9.1% |
30.5% |
|
BDC |
(GBDC) |
9.4% |
6.6% |
5.7% |
10.0% |
|
|
BDC(2) |
(TPVG) |
11.4% |
6.2% |
6.4% |
2.8% |
|
|
BDC |
(GSBD) |
11.6% |
5.1% |
5.4% |
||
|
BDC |
(OCSL) |
10.3% |
2.2% |
2.1% |
15.6% |
21.4% |
|
55.1% |
52.3% |
|||||
|
Table-2: Nov 30, 2022 |
||||||
|
Type |
Symbol |
Yield |
%CapAlloc |
%IncAlloc |
DivChg |
Special |
|
mREIT |
(STWD) |
9.0% |
8.6% |
7.0% |
||
|
mREIT |
(BXMT) |
9.8% |
5.9% |
5.3% |
||
|
mREIT(1) |
(PMT) |
12.3% |
2.8% |
3.2% |
-14.9% |
|
|
mREIT |
(ABR) |
10.8% |
2.0% |
2.0% |
17.6% |
|
|
mREIT |
(ACRE) |
10.6% |
1.5% |
1.4% |
5.7% |
|
|
mREIT |
(LADR) |
8.3% |
0.0% |
0.0% |
15.0% |
|
|
20.8% |
18.9% |
|||||
|
Table-3: Nov 30, 2022 |
||||||
|
Type |
Symbol |
Yield |
%CapAlloc |
%IncAlloc |
DivChg |
Special |
|
CEF |
(GOF) |
13.4% |
6.0% |
7.4% |
||
|
CEF |
(PDI) |
13.4% |
5.4% |
6.6% |
21.0% |
|
|
CEF |
(ECC) |
15.3% |
5.4% |
7.6% |
20.5% |
|
|
CEF |
(WDI) |
11.3% |
3.1% |
3.2% |
9.7% |
|
|
CEF |
(PTY) |
10.8% |
2.6% |
2.5% |
11.2% |
|
|
CEF |
(ARDC) |
10.0% |
1.4% |
1.3% |
5.1% |
|
|
24.0% |
28.7% |
|||||
(1) PennyMac Mortgage Investment Trust (PMT) is the only mREIT I currently own that invests in residential Mortgage Backed Securities and Mortgage Servicing Rights. They just reported a 14.9% dividend cut that will begin January 2023. The other 5 mREITs in the table above are commercial investments.
(2a) TriplePoint Venture Growth BDC Corp. (TPVG) had some good and bad news in December. For the good news, they announced a special dividend of 10 cents not included in Table-1. For the bad news, one of their holdings will go into bankruptcy affecting their net asset value. They will write-down the fair value of their investment and recovery is unknown. Perhaps this is a harbinger of things to come next year.
(2b) TPVG sold off in heavy trading December 13th. I currently have a full position but can’t pass up a bargain based on my TEA signal. For some of you who are following this portfolio received this trade-alert December 14th, RSI = 28, Price Z-score = -1.6, price $11.14.
As a side note I have noticed, the best times to invest in a company is when they just increased their dividend or when they just cut their dividend. The reason is that both times management is confident they can support their changed dividend. With this reasoning, I can be assured PMT has just become the least risky investment for next year, and if it drops in price, I’ll accumulate shares.
I currently own 20 high-yield investments, and 11 have increased their dividends along with 9 special dividends. The special dividends have been a major driver for income during 2022. Chart-1 below indicates how much the special dividends contributed to the overall actual portfolio income.
Chart-1: 2022 Actual Total Dividends
Author’s TEA/POT Excel software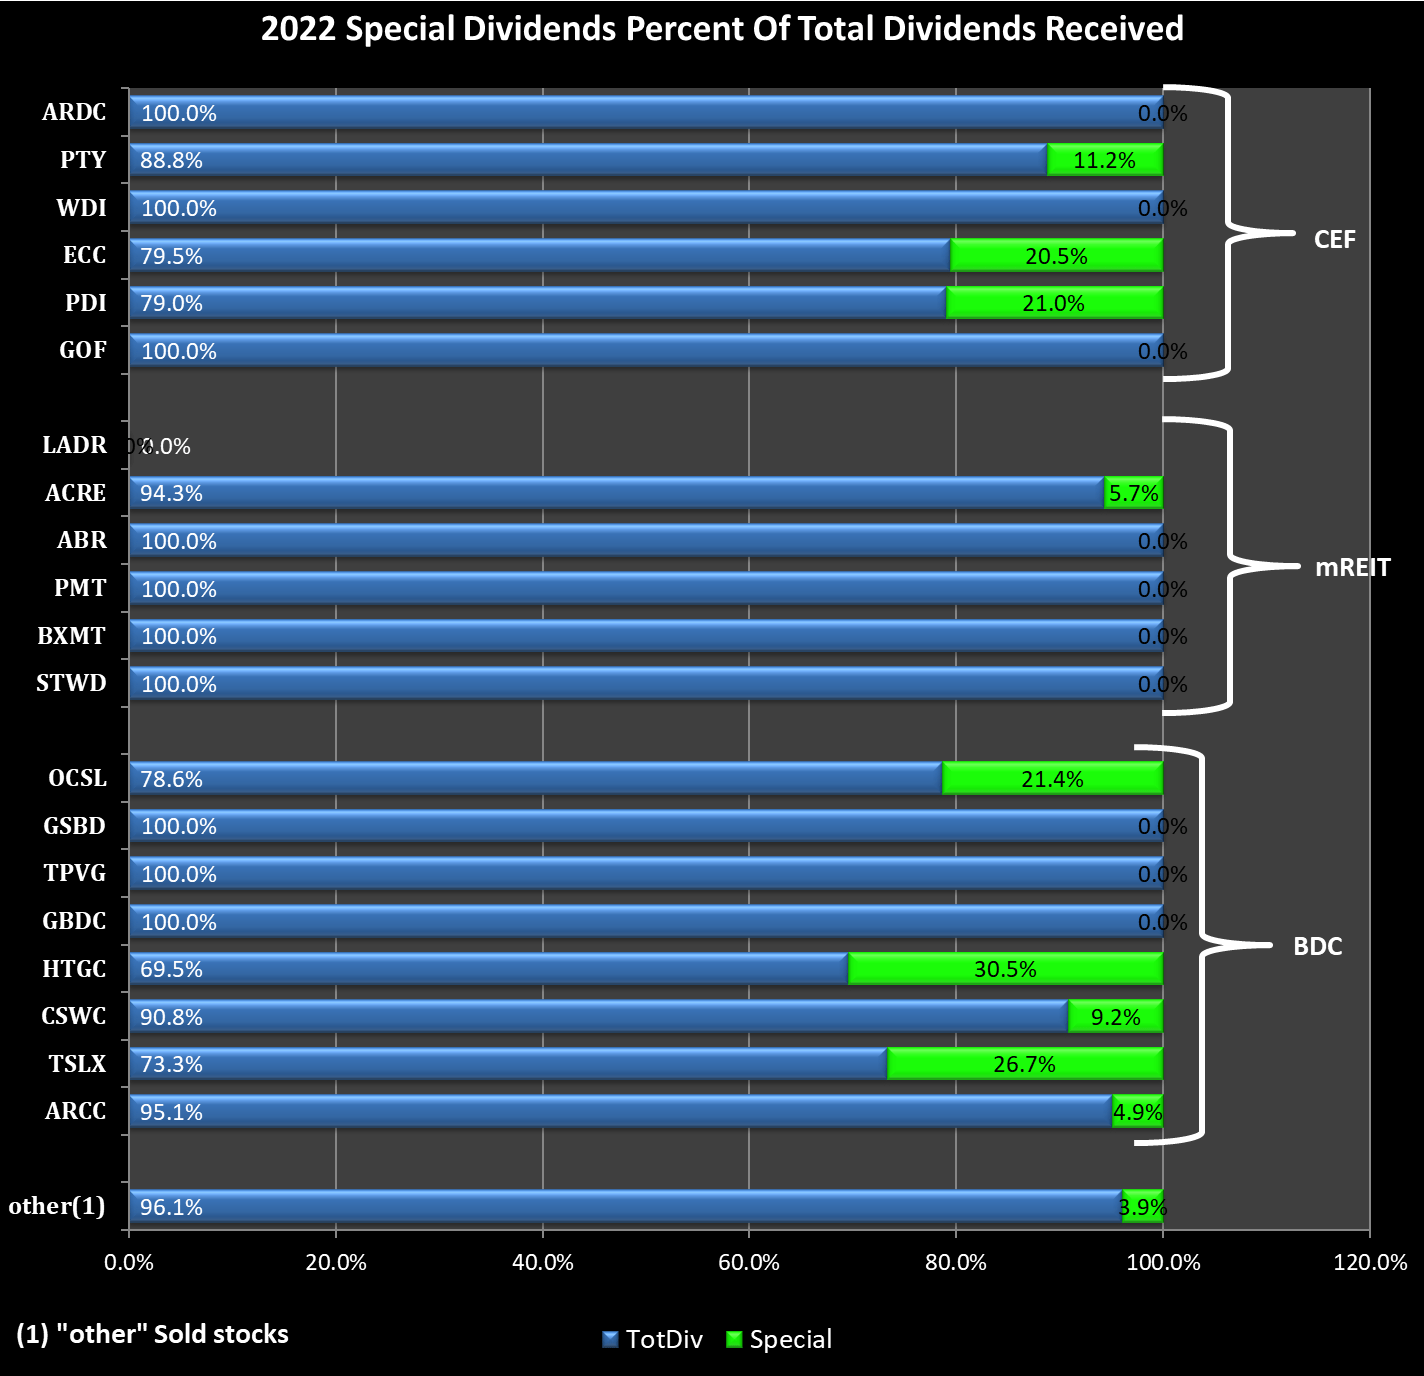
The blue bars are the base reported dividends for each company and the green bars are the special dividends. As an example, from HTGC’s total dividends, 69.5% were from their base dividends and 30.5% were special dividends.
This has been an exceptional year for dividend shareholders. I have no expectations this will continue during the 2023 year with such magnitude. Companies that contain floating rate lending might continue raising their dividends and/or payout special dividends if the FED keeps increasing short term rates.
Projected Dividends
At the end of each year, I calculate a projected yearly income based on the last known dividend value for each stock. This value is my projected dividends I expect for the following year. I’ll use this forward predictive income to determine how well my portfolio performed each year.
Based on the difference between my projected dividend income at the end of 2021, and the actual total dividends received during the 2022 year, my cash flow increased 20.6%. This value includes shares added, dividend increases and special dividends with no external funds added.
To break this down further, the reinvested dividends added 8.4% income growth (My Base Pay Jumped) and the special dividends added the remainder 12.2% (My Bonus For The Year!). For my projected dividend calculation, I do not count special dividends since they are dependent on company earnings exceeding their base dividends.
Chart-2 below indicates the base dividend increases for each stock that I will use for the 2023 year.
Chart-2
Author’s TEA/POT Excel software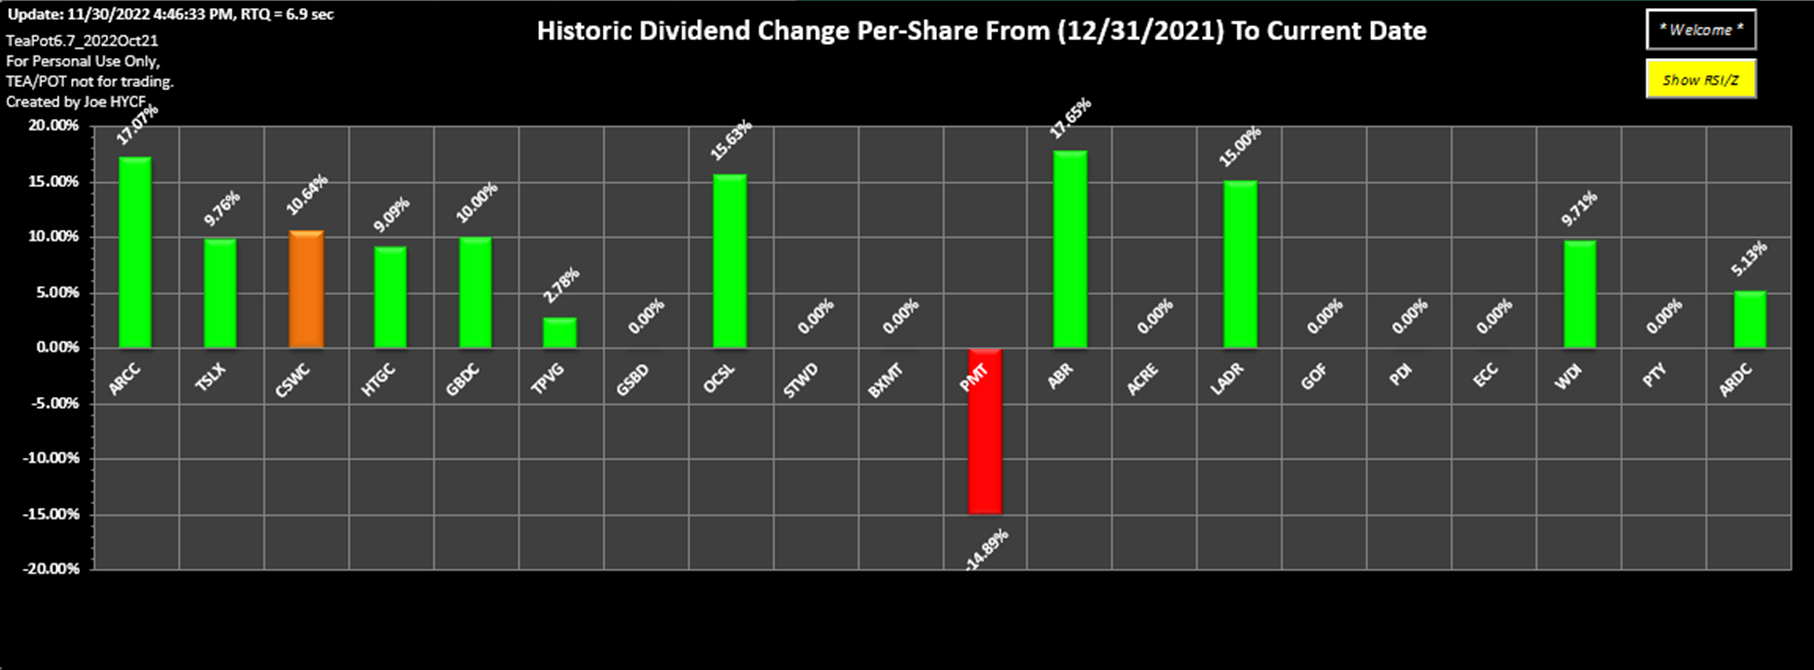
Most dividend changes in the above chart came during the year and will be fully applied January 2023.
Trade Email Alert system
I’ve been talking about this trading system in my last few articles. The below chart is part of my POT (Portfolio Online Tracker) software where I can pullup a Real-Time-Chart with a push of a button. This chart will also be Emailed to my cell phone anytime a buy or sell signal occurs.
Chart-3: Oversold and Overbought trading zones
Author’s TEA/POT Excel software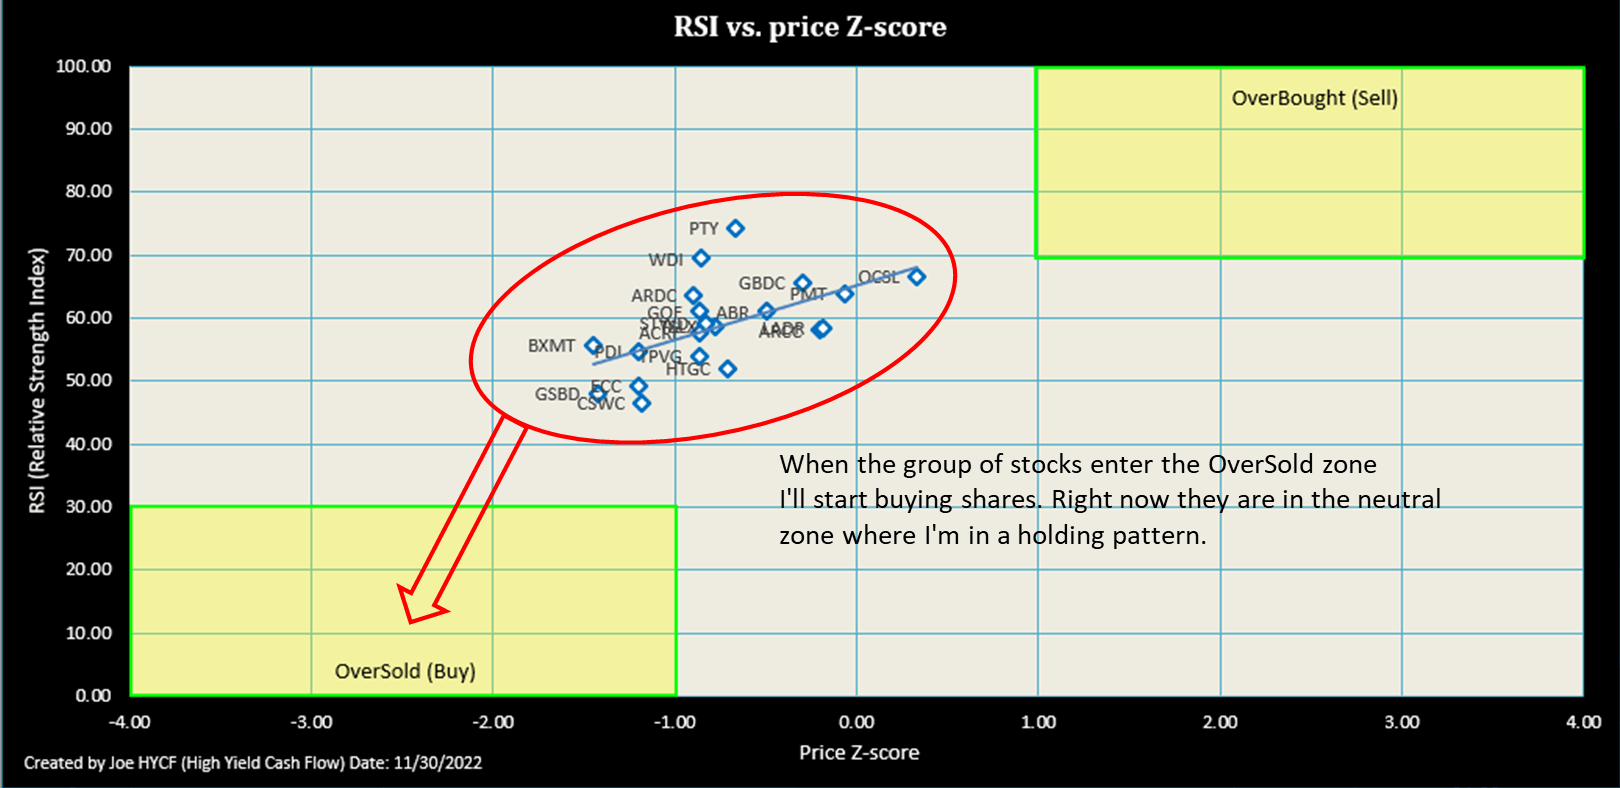
To help in my pursuit of taking advantage of price dislocations, I developed an application that sends Email-Alerts to my cellphone for oversold stocks in real-time during market hours. This will occur when my group of stocks or any stock enters the “OverSold (Buy)” zone.
I’ve been testing this application during the 2022 year for the feasibility of increasing my cash flow income. The following quote describes the rare events.
“Opportunities come infrequently. When it rains gold, put out the bucket, not the thimble.” Warren Buffett
What I determined was the quote above is correct, there are only a few times a year where the market becomes fearful enough where most stocks become oversold. This is the time to use the bucket to increase shares. The rest of the time the stocks stay in the neutral zone between oversold and overbought as indicated in Chart-3 above.
I have written two articles describing the last two events where I increased my dividend income at reduced cost compared to just purchasing at any price. On both occasions most of my holdings entered the “OverSold (Buy)” zone.
- Chasing 15% High Yield Is Great In A Bear Market, Portfolio Stock Price Change From June 16
- Chasing Yield In A Bear Market Is Easy When It Accelerates Income Growth from September 29.
Conclusion
Since I’ve been investing in high yield, this has been the best year ever exceeding my 2022 projected income by over 20%. The main reason is because companies with floating rate loans exceeding their base earnings due to high short-term rates.
The actual dividends for the year are broken down as follows. Reinvested dividends added 8.4% and if I was still working would be considered my base pay raise. Special dividends added the remainder 12.2% and would be considered my bonus for the year.
Plans for next year will include using the TEA/POT system to purchase income shares, reinvest in companies listed in Table-1 to 3 and sweep surplus-dividends into the SPDR Bloomberg Barclays 1-3 Month T-Bill ETF (BIL) “BIL tracks a market-weighted index of all publicly issued zero-coupon US Treasury bills with a maturity of at least 1 month, but less than 3 months.” I perform the sweeping process the first trading day each month where price is the lowest value.
Be the first to comment