

ekinyalgin
This article was published on Dividend Kings on Tuesday, December 27th.
—————————————————————————————
$366,000, an amount of money that most people would envy. That’s how much I’ve personally lost in a lifetime due to speculation and day trading.
That was before I learned the simple truth about how to actually retire rich and stay rich in retirement.
Many people think of Wall Street as a casino, and they are right. In the short term, anything can happen. But in the long term, it’s all about stacking the probabilities in your favor.
Billion-dollar casinos aren’t built on the backs of winners, but from long-term probabilities, specifically that the house always wins.
Charlie Bilello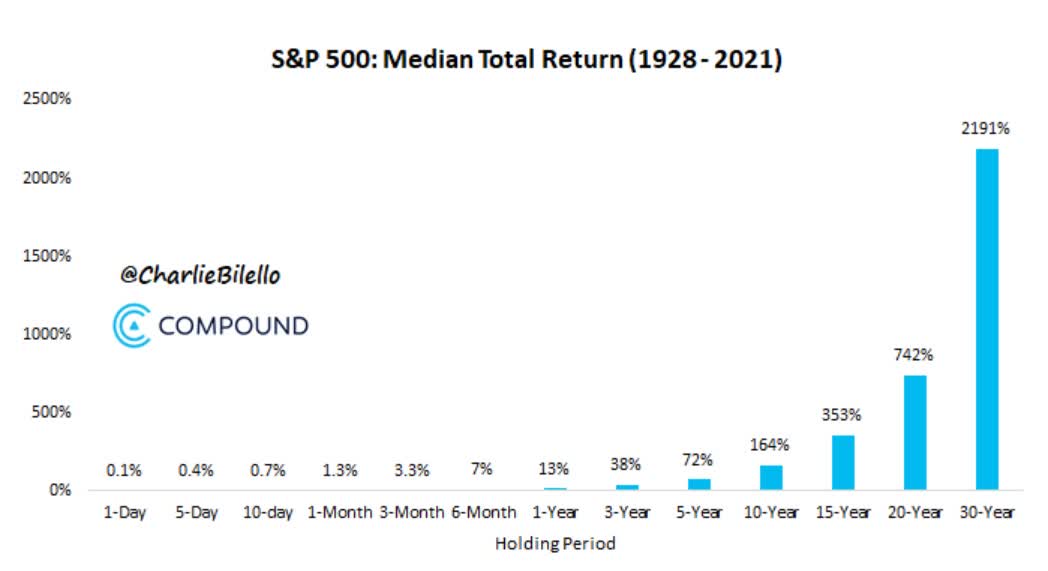
In the short-term, stocks can do anything, especially in a bear market. In the long-term, barring an apocalypse, they only go up.
And do you know the only thing better than stocks for the long-term if you want to retire in safety and splendor?
Legacy Research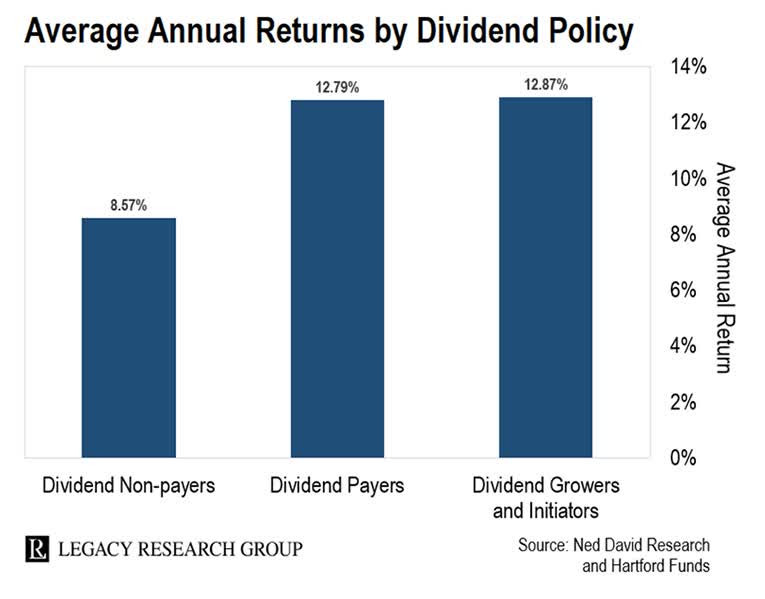
Dividend growth blue-chips. Why? Because a diversified dividend growth portfolio harnesses the power of everyone on earth to fund your financial dreams.
How’s that? Consider the Dividend Kings ZEUS Income Growth portfolio, which owns stakes ranging from 0.01% to 6% in the 578 greatest companies on earth.
There isn’t a person on earth that isn’t a customer of this portfolio. Every one of the 8 billion people in the world is sending dividends to this portfolio every quarter.
Throughout history, every emperor and dictator has dreamed of conquering the world and bending all of humanity to their will. Guess what? If you own a blue-chip income portfolio you have done just that.
Every person on earth is voluntarily sending you money, from every corner of the globe, so that you can become financially independent.
You don’t have to kill or conquer anyone because, through the magic of blue-chip dividends, all of humanity is united behind one simple goal. Letting you retire in comfort or splendor and grow steadily richer over time.
Today I want to highlight two super star high-yield dividend blue-chips that are firing on all cylinders right now, Amgen Inc. (AMGN) and Broadcom Inc. (AVGO). These aren’t the most undervalued high-yield blue-chips you can buy, but they are two of the highest quality and safest.
Not just for 2023, a recession year, but for potentially decades of superior income, income growth, and life-changing returns.
So let me show you why Amgen and Broadcom are two of the best high-yield dividend blue-chips you can buy today to help build your income growth empire and achieve your financial dreams.
Amgen: A World-Beater Biotech Blue-Chip
Amgen isn’t a dividend aristocrat…yet. It began paying a dividend 11 years ago. But if this world-beater, high-yield blue-chip doesn’t become an aristocrat in 2037, I’ll eat my hat.
Why is Amgen such a wonderful dividend growth blue-chip?
Let’s start with the Horizon Therapeutics (HZPN) mega-deal for $28 billion, its largest acquisition ever.
S&P 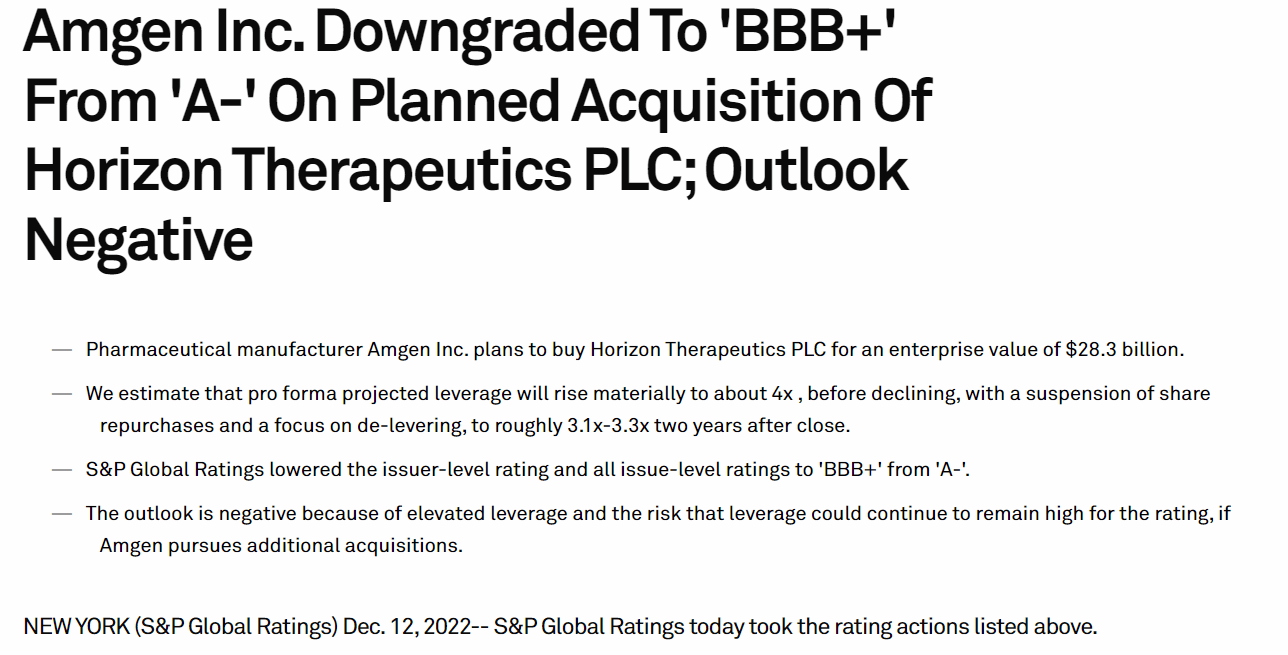
Amgen will take on a lot of debt to fund this deal, which will mean elevated leverage for the next few years.
We expect the company to suspend share repurchases and focus on debt repayment over the next several years. We project that leverage will decline to 3.1x-3.3x two years post the close of the acquisition, still slightly high for the ‘BBB+’; rating. We would consider lowering the rating further if leverage remains over 3.3x beyond the two years.” – S&P
However, this deal makes a lot of sense from the perspective of future growth.
The acquisition improves Amgen’s portfolio, adding several fast-growing commercialized drugs. Horizon’s key assets overlap with Amgen’s strength in auto-immune diseases and leverage its presence in nephrology. We expect Tepezza and Krystexxa to grow at a double-digit rate over the next few years. This will likely augment Amgen’s growth rate, which we expect to accelerate in 2023 with the growth of Lumakras and Tezspire and the launch of Amjevita in the U.S.” – S&P
What about the negative outlook?
The outlook is negative because of elevated leverage and the risk that if Amgen continues to pursue additional acquisitions, leverage will remain high.
We could lower the rating if the company makes other acquisitions or makes a sizable tax settlement that will keep leverage elevated and above 3.3x for more than two years.
We could revise the outlook to stable if we become more certain that leverage will remain below 3.3x. This could occur if the company steadily reduces leverage and builds capacity for future acquisitions.” – S&P
Horizon has several drugs already on the market that are a good fit for Amgen’s drugs on the market. Combining drugs into a single treatment for a patient is becoming more common, and this is why analysts are so excited about what this mega-deal means for Amgen’s growth potential.
FactSet Research Terminal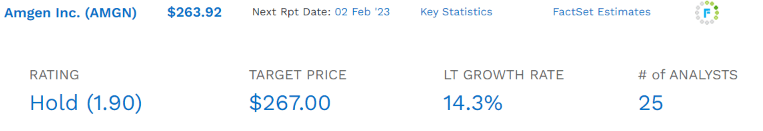
For context, Moody’s estimates that the pharma industry’s long-term earnings growth rate is 4%. Amgen is growing almost 4X as fast thanks to its Horizon acquisition.
However, the biggest potential growth driver for the Horizon portfolio could be improved uptake among patients with chronic thyroid eye disease; key data should be available in the second quarter of 2023 that could expand the penetration of this market. We also see significant potential from Horizon’s newest key drug, Uplizna, for neuromyelitis optica. Additional potential indications in testing (like myasthenia gravis) would fit well with Amgen’s upcoming launch of a biosimilar version of Soliris.” – Morningstar
In other words, Horizon is potentially turbocharging AMGN’s strong pipeline of current and future drugs and will help it maintain truly exceptional profitability.
FactSet Research Terminal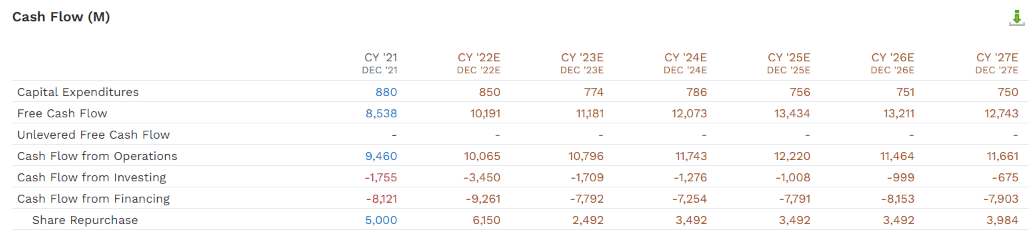
Within a few years, Amgen’s free cash flow (“FCF”) is expected to grow about 30% to around $13 billion. How impressive is that?
- 2022 FCF margin consensus: 39%
- 2023 FCF margin consensus: 49%
- 2027 FCF margin consensus: 44%.
For context, Amgen’s current free cash flow margin is in the top 5% of all companies on earth. And it’s expected to get even stronger with Horizon’s high margin drugs added to its arsenal.
Amgen is currently spending $4.5 billion on its dividend, or approximately 33% of what analysts expect it to be generating within a few years.
That leaves around $8 to $8.5 billion per year it can spend on de-leveraging or less aggressive buybacks.
Or, to put it another way, if AMGN were to spend 100% of its post-dividend retained free cash flow on paying down debt, it could pay for this entire deal in about 3.5 years.
But here’s even better news. Not only does Amgen has a plan to safely deleverage and achieve some of the best growth rates in its industry, but it’s likely to remain a double-dividend growth super-star.
- 5-year dividend growth consensus 10.2% annually.
Amgen just raised its dividend by 12% for 2023, and analysts expect it to grow another 47% by 2027.
That means the currently generous and very safe 3.2% yield could reach 4.7% on today’s cost by 2027.
Gurufocus Premium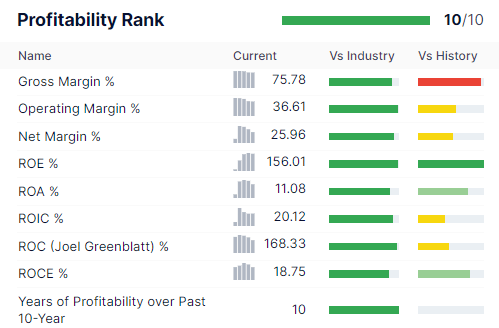
That’s a might attractive very safe yield for a future dividend aristocrat whose moat is as wide as they come.
That includes gross margins of 76% and returns on capital of 170%, 12X that of the S&P 500 and 65% better than the dividend aristocrats.
Long-Term Consensus Return Potential
| Investment Strategy | Yield | LT Consensus Growth | LT Consensus Total Return Potential | Long-Term Risk-Adjusted Expected Return |
| Amgen | 3.2% | 14.3% | 17.5% | 12.3% |
| Vanguard Dividend Appreciation ETF | 1.9% | 10.2% | 12.1% | 8.5% |
| Nasdaq | 0.8% | 10.9% | 11.7% | 8.2% |
| Schwab US Dividend Equity ETF | 3.4% | 7.6% | 11.0% | 7.7% |
| Dividend Aristocrats | 1.9% | 8.5% | 10.4% | 7.3% |
| S&P 500 | 1.8% | 8.5% | 10.3% | 7.2% |
(Source: DK Research Terminal, FactSet, Morningstar, Ycharts)
Do I believe that AMGN can really deliver 17% to 18% long-term returns? It’s actually not as crazy as it sounds.
Amgen Rolling Return Since 2011 (The Dividend Era)
Portfolio Visualizer Premium 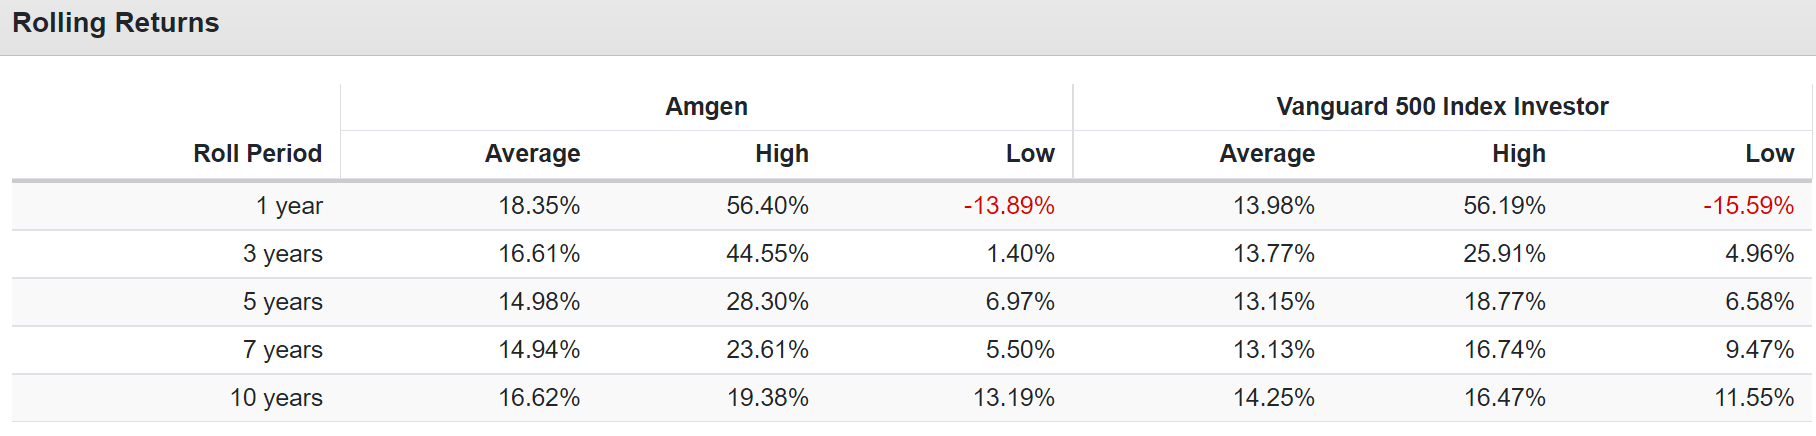
Since Amgen started paying a very safe and double-digit growth dividend 11 years ago, it’s consistently delivered 15% to 18% annual returns, running circles around the S&P.
31% Annual Income Growth Over The Last 11 Years
Portfolio Visualizer Premium 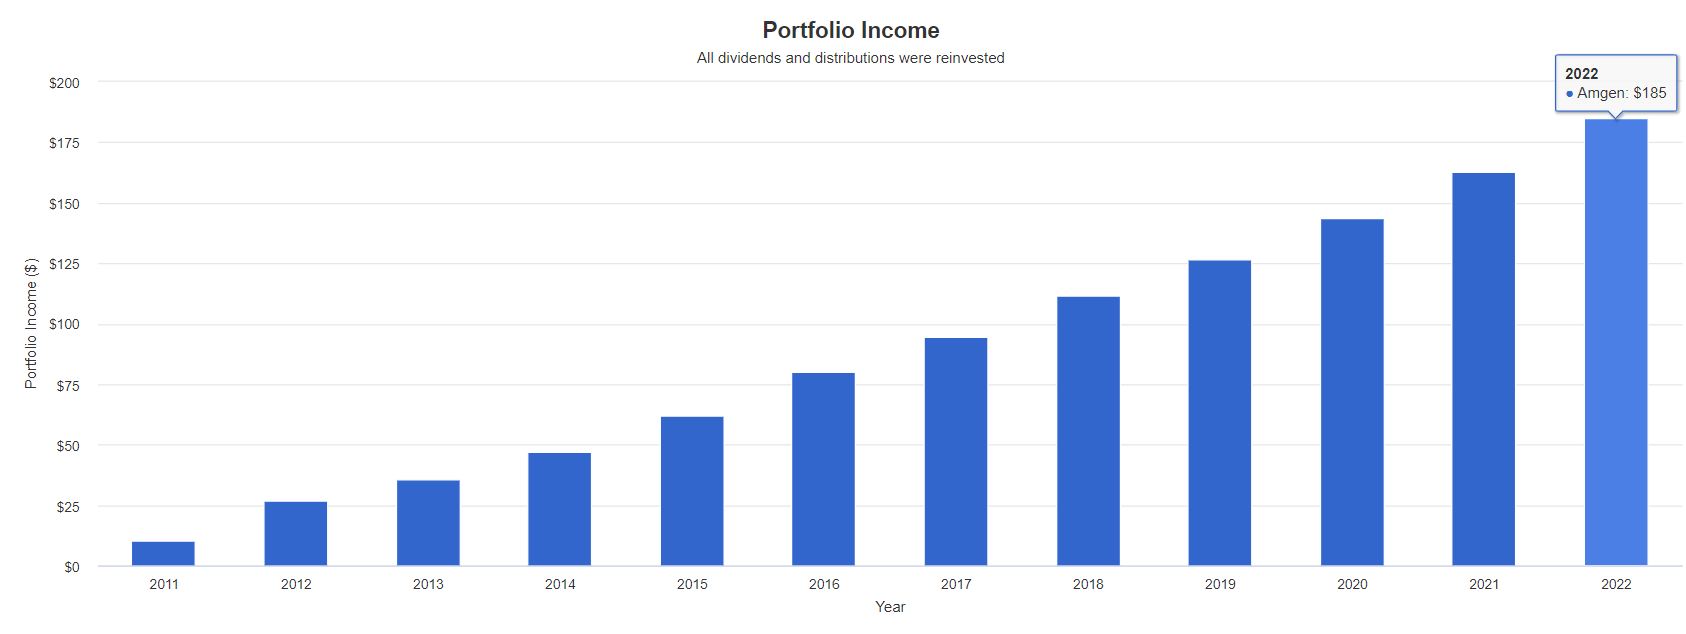
Amgen’s dividend growth over the last 11 years has been about 4X faster than the S&P’s, an exceptional 31% per year. That’s obviously going to slow over time, especially as it focuses on deleveraging.
But the point is that Amgen is truly a high-yield dividend growth super star, with many other admirable qualities.
Reasons To Potentially Buy Amgen Today
| Metric | Amgen |
| Quality | 83% 13/13 Ultra SWAN (Sleep-Well-At Night) Quality Drug Maker |
| Risk Rating | Very Low Risk |
| DK Master List Quality Ranking (Out Of 500 Companies) | 264 |
| DK Master List Quality Percentile | 48% |
| Dividend Growth Streak (Years) | 11 |
| Dividend Yield | 3.2% |
| Dividend Safety Score | 82% |
| Average Recession Dividend Cut Risk | 0.5% |
| Severe Recession Dividend Cut Risk | 1.95% |
| S&P Credit Rating |
BBB+ Negative Outlook |
| 30-Year Bankruptcy Risk | 5.00% |
| LT S&P Risk-Management Global Percentile |
97% Exceptional, Very Low Risk |
| Fair Value | $273.53 |
| Current Price | $263.92 |
| Discount To Fair Value | 4% |
| DK Rating |
Potential Reasonable Buy |
| P/E | 14.9 |
| Cash-Adjusted P/E | 10.5 |
| Growth Priced In | 4.0% |
| Historical PE | 13.5 to 15 |
| LT Growth Consensus/Management Guidance | 14.3% |
| PEG Ratio | 0.73 |
| 5-year consensus total return potential |
8% to 10% CAGR |
| Base Case 5-year consensus return potential |
9% CAGR (About Equal to The S&P 500) |
| Consensus 12-month total return forecast | 4% |
| Fundamentally Justified 12-Month Return Potential | 7% |
| LT Consensus Total Return Potential | 17.5% |
| Inflation-Adjusted Consensus LT Return Potential | 15.2% |
(Source: Dividend Kings Zen Research Terminal)
Amgen isn’t a bargain, but it does represent a classic Buffett-style “wonderful company at a reasonable price.” Its cash-adjusted P/E of 10.5X is lower than the average private equity deal in 2022 of 11.3X.
For one of the widest moat pharma giants on earth, and one of the safest double-digit growing 3.2% yields on the planet.
Amgen 2024 Consensus Total Return Potential
FAST Graphs, FactSet Research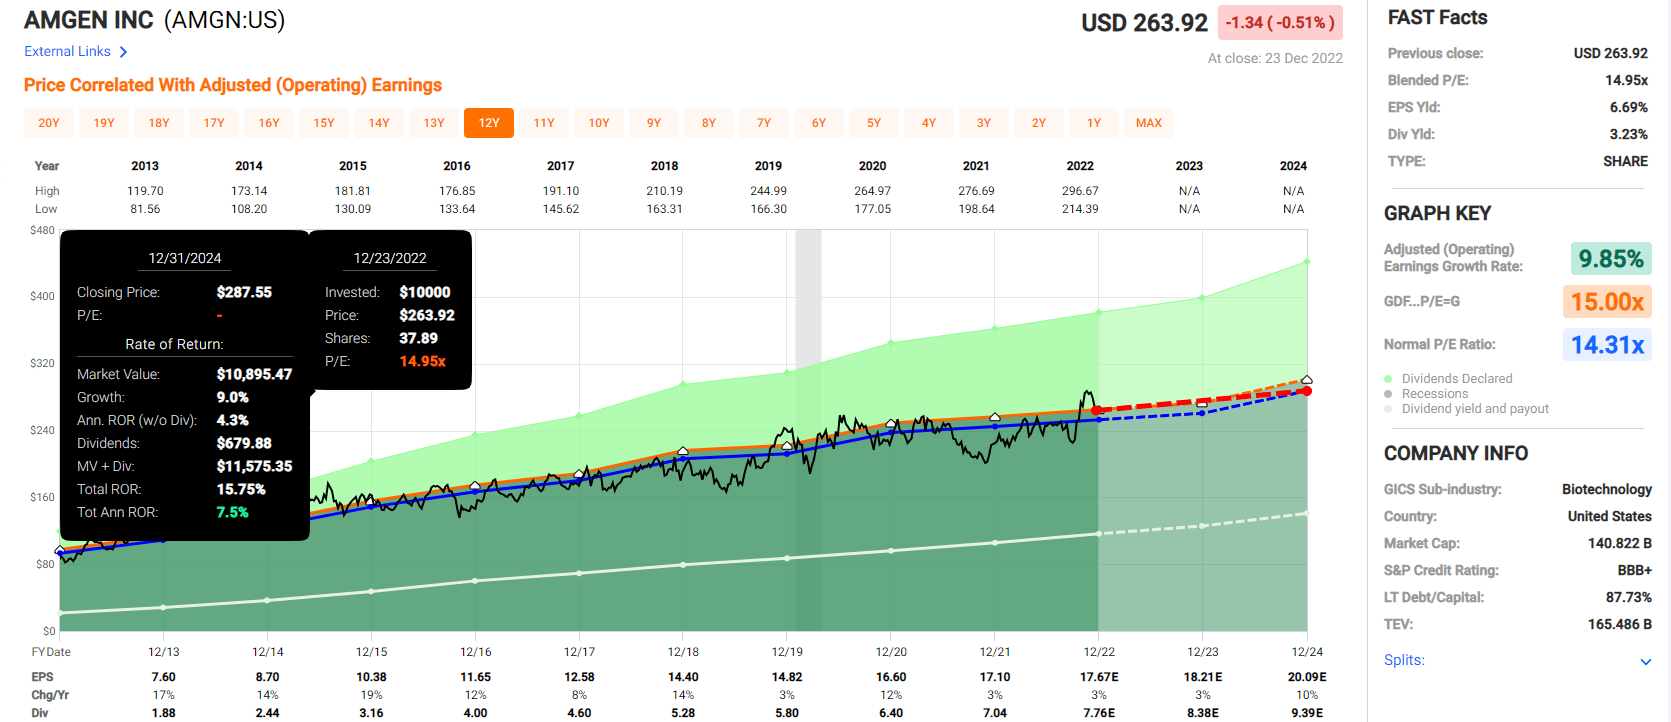
AMGN’s slow growth in 2023 means that its short-term return potential is modest.
Amgen 2028 Consensus Total Return Potential
FAST Graphs, FactSet Research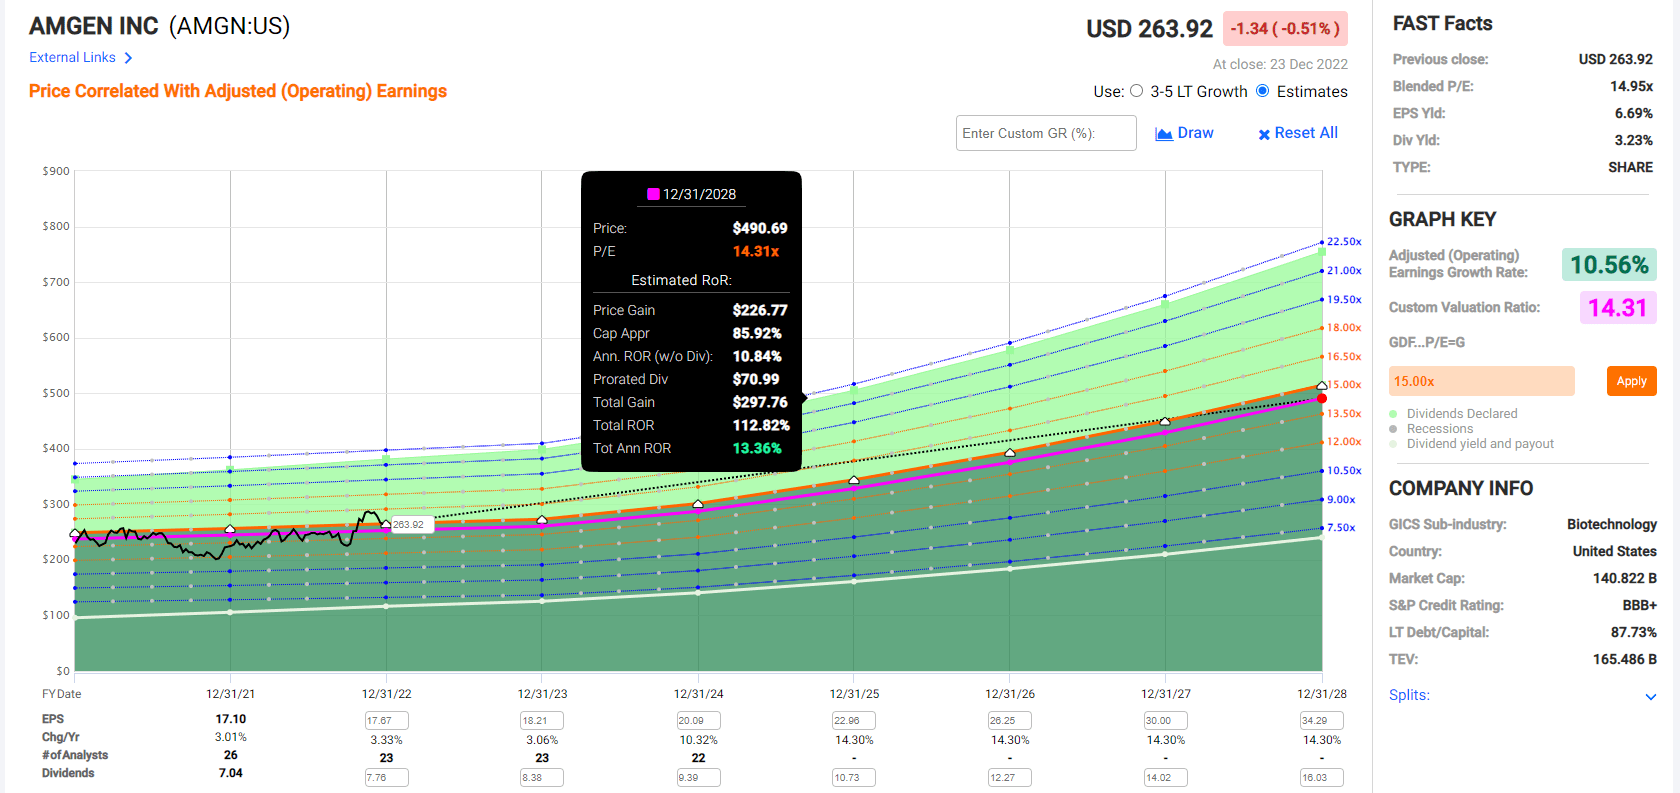
But over the next five years, AMGN offers the potential to more than double the market’s returns, a very attractive 13% annually.
Amgen Investment Decision Score
Dividend Kings Automated Investment Decision Score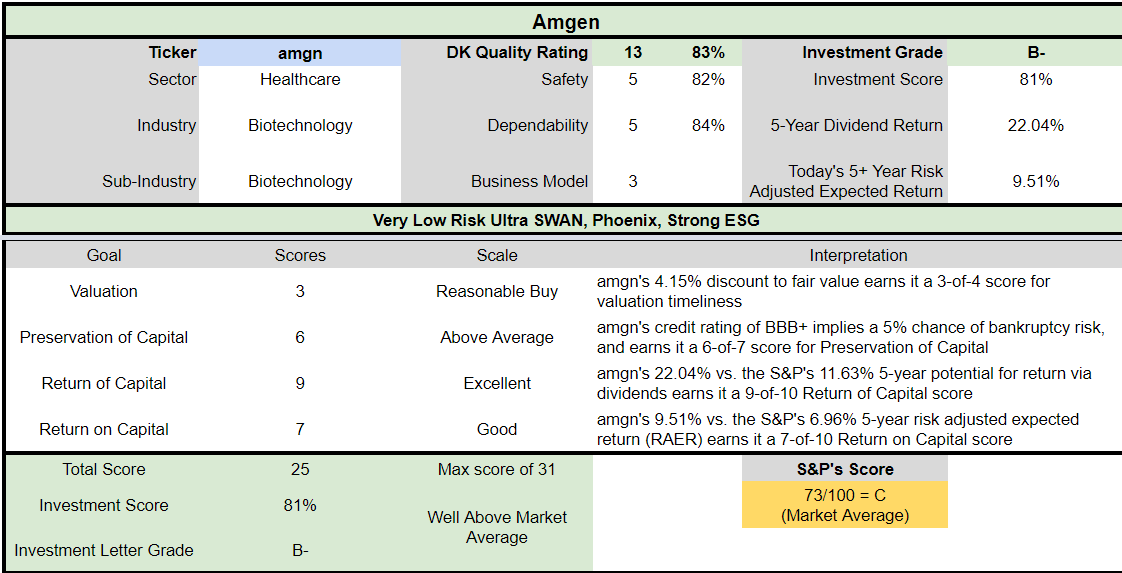
AMGN is an above-average high-yield opportunity for anyone comfortable with its risk profile. Look at how it compares to the S&P 500.
- 4% discount to fair value vs. 1% discount S&P = 3% better valuation
- 3.2% safe yield vs. 1.8% (2X higher and much safer)
- approximately 17.5% long-term annual return potential vs. 10.2% CAGR S&P
- about 50% higher risk-adjusted expected returns
- 2X higher income potential over five years.
Broadcom: A Free Cash Flow Minting World-Beater Super Star Dividend Grower
Broadcom is one of my favorite chip stocks for several reasons.
First, no one does M&A in this industry better than CEO Hock Tan.
Investor Presentation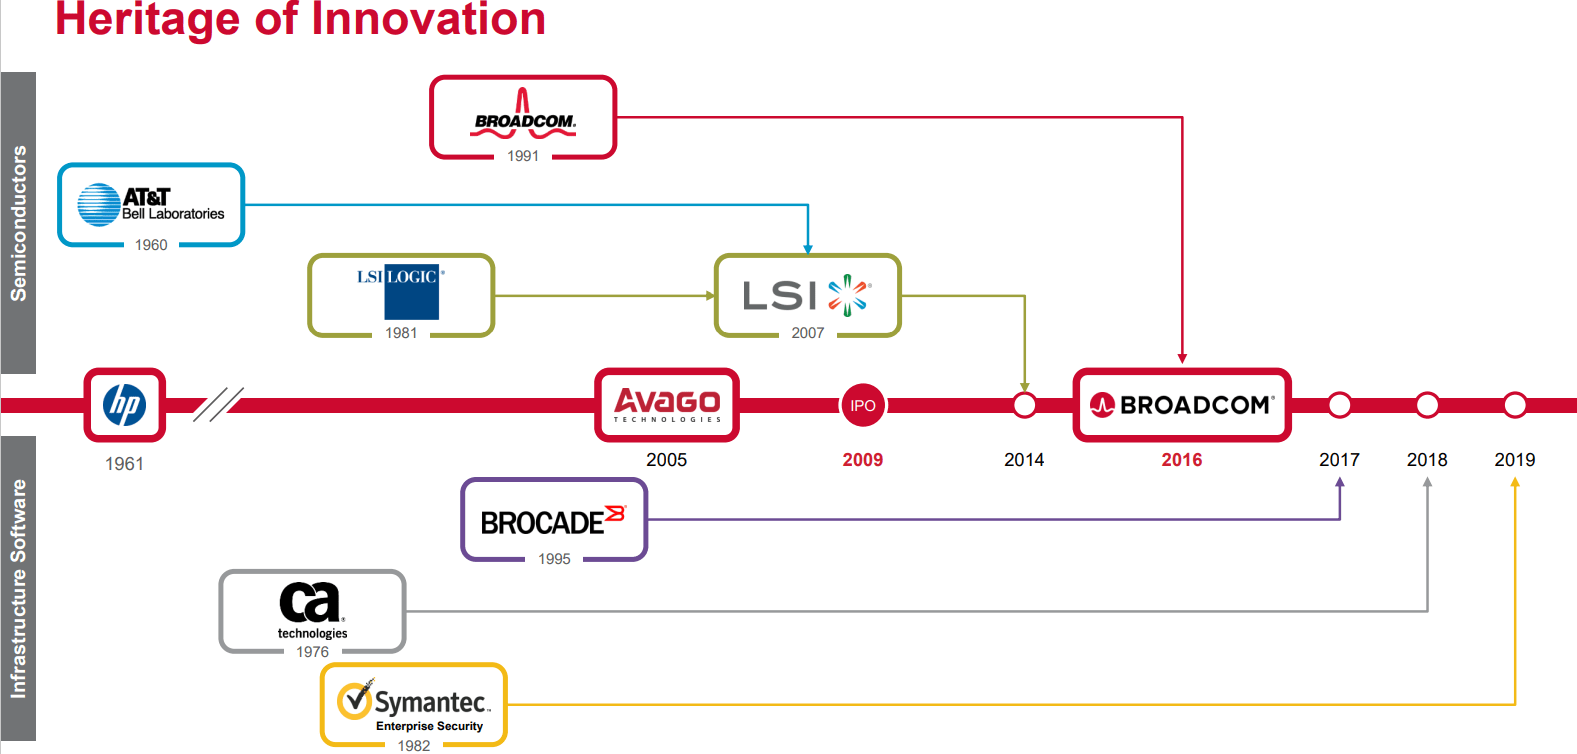
Broadcom is like the Berkshire of chip makers, making numerous smart deals that have helped to improve the company’s profitability and turbocharge growth.
Broadcom uses the cash flow generated from its existing businesses to maintain its competitive edge in core end markets by bolstering research and development as well as future acquisitions. As a serial acquirer, Broadcom has seemingly perfected the process of purchasing technology companies with best-of-breed products at attractive valuations, trimming noncore product lines to streamline the business, and ultimately driving cost synergies.” – Morningstar
What’s more important for income investors is that it’s focused on buying software companies with recurring contracted cash flows. AVGO spends $5 billion annually on R&D, growing its portfolio of 19,000 patents that help it deliver some of the most impressive profitability in the industry.
The $61 billion acquisition of VMWare (VMW) will mean that 50% of all sales are from software, creating the most stable cash flow in the industry.
That means its PE should continue to rise steadily over time as it becomes more of a tech utility.
Is Broadcom without risk? Of course not, and one of the biggest right now is regulatory approval for the VMWare deal.
Both the U.S. and EU are closely scrutinizing this deal, worried that it might result in a tech conglomerate with too much market power.
Gurufocus Premium 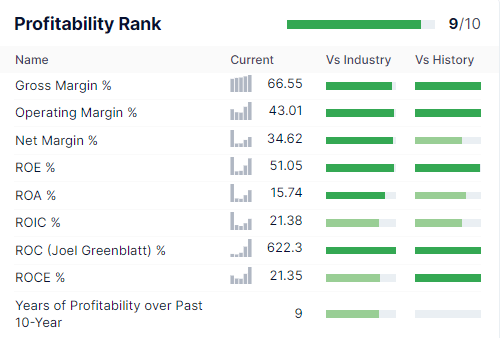
AVGO’s masterful use of M&A has helped it become one of the most profitable companies on earth, in any industry. That includes insane returns on capital of 622%, 43X better than the S&P 500 and 6X more than the dividend aristocrats.
FactSet Research Terminal 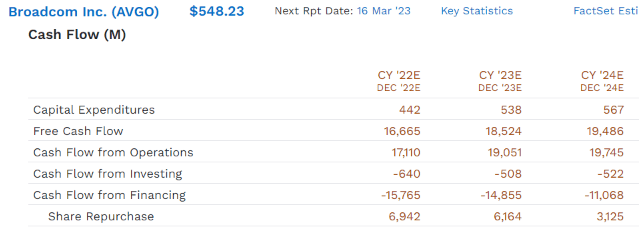
Broadcom’s free cash flow margins are exceptional thanks to its low capital-intensive business model.
Broadcom’s dividend is running $7.9 billion per year, meaning that it’s expected to retain $10 billion next year after dividends. Management’s policy is to pay a safe 50% FCF payout ratio and use the rest for buybacks and de-leveraging.
- 49% free cash flow margins in 2022
- top 1% of all companies on earth
- 2024 consensus FCF margin 52%.
Normally you expect 50% free cash flow margins from companies like Visa (V) and Mastercard (MA), not a chip maker. Not even biotechs like Amgen and AbbVie (ABBV) are able to sustain such margins over time, much less keep improving upon them.
Investor presentation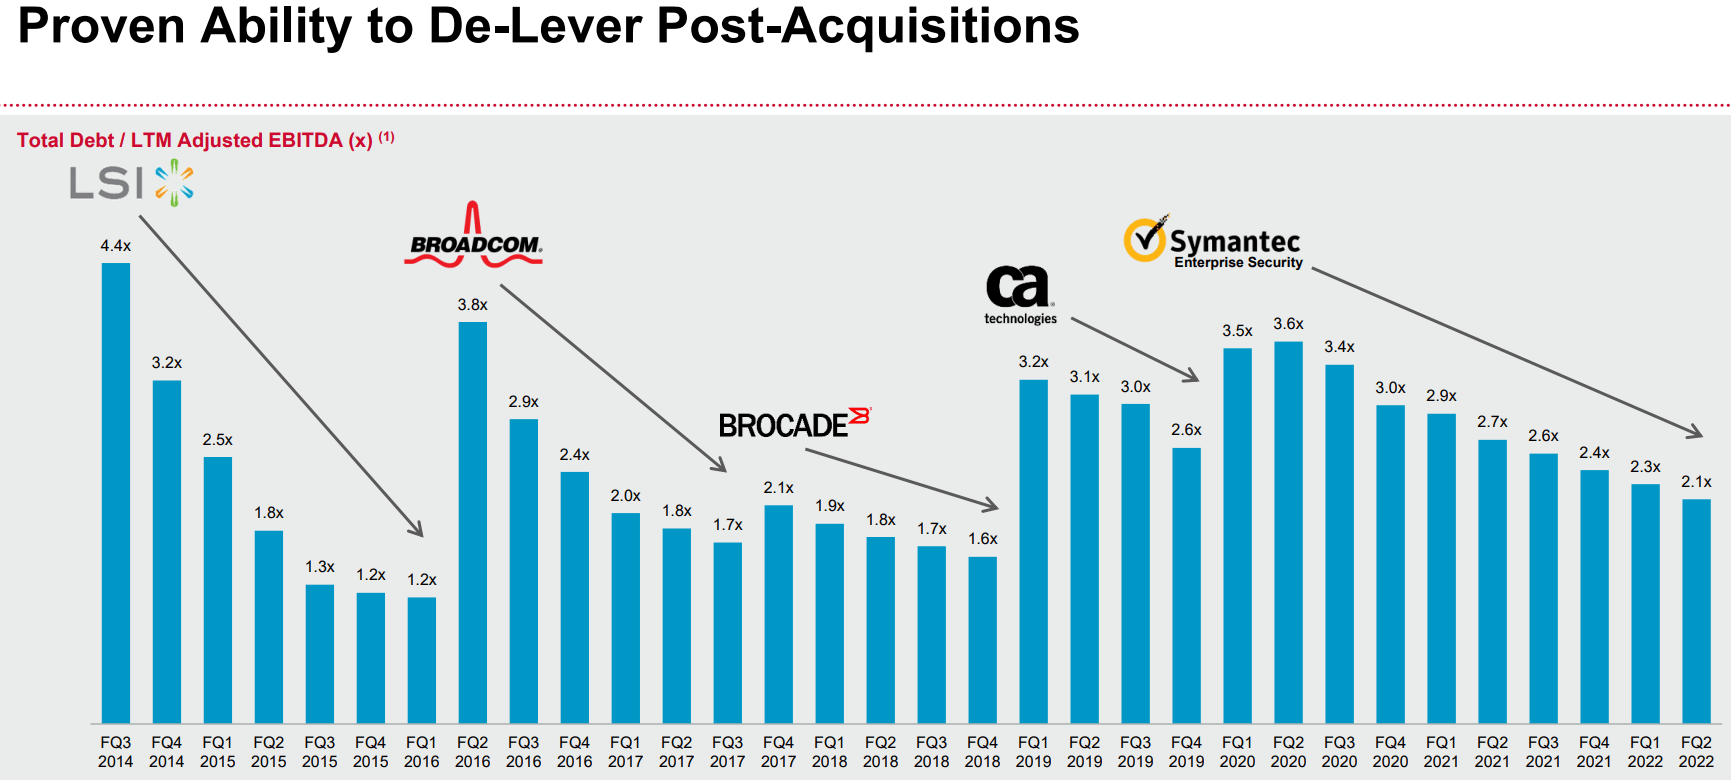
There is naturally risk involved with debt-funded M&A, and in the hands of a lesser company, this strategy could spell disaster.
44% Annual Income Growth For 11 Years
Portfolio Visualizer Premium 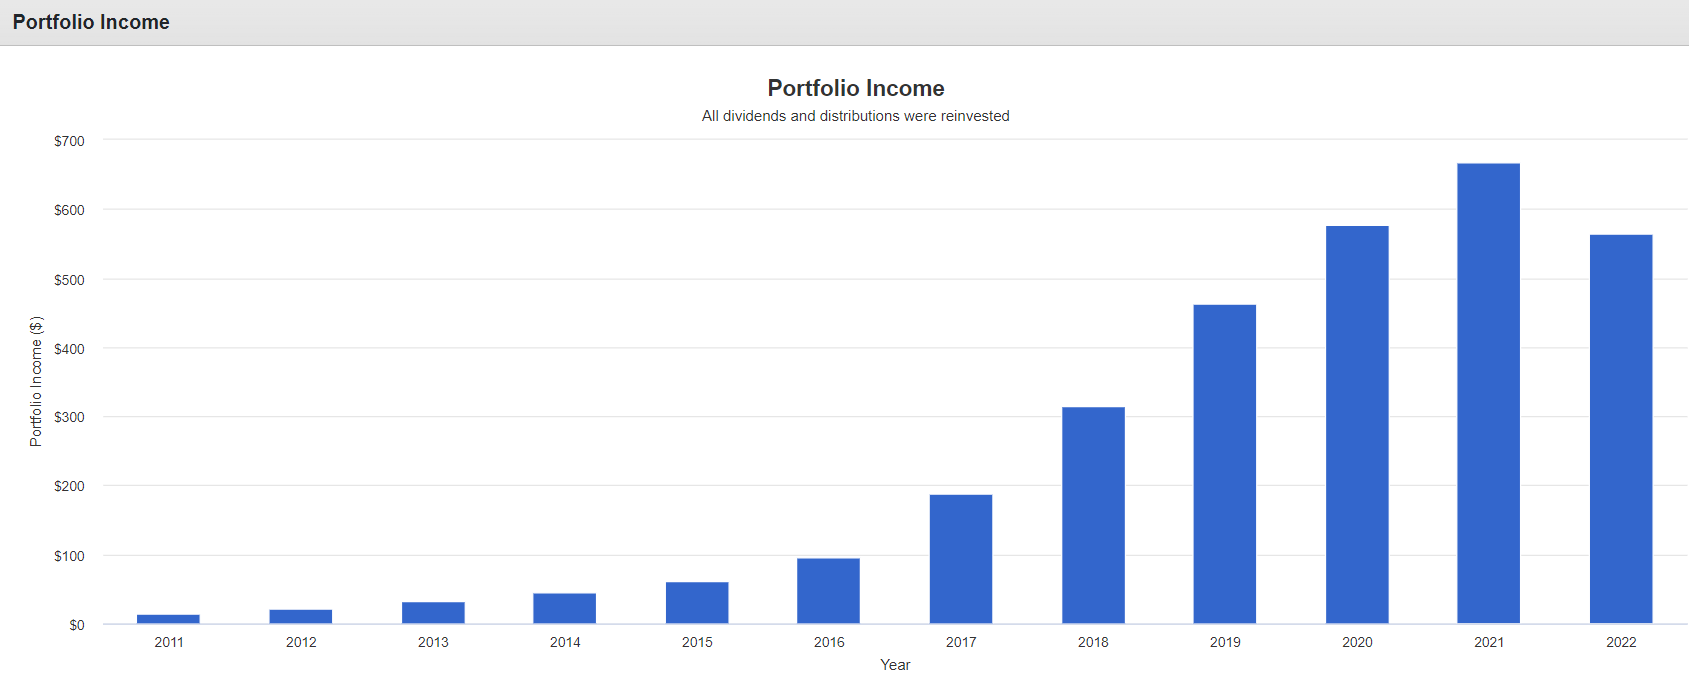
In the hands of Hock Tan, Broadcom’s M&A-focused growth strategy has resulted in spectacular income growth. Investors who bought Broadcom in 2011 when it became a dividend stock now enjoy a 75% yield on cost.
OK, but obviously, growth is going to slow in the future. And that’s especially true if regulators block the VMware deal or ones similar to it. We’ve already seen an attempted $117 billion acquisition of Qualcomm (QCOM) nixed by the Trump administration, and the VMW deal has a potential $2.25 billion in termination fees associated with it.
What does Broadcom’s growth outlook look like on a risk-adjusted basis if it’s not allowed to buy VMW?
FactSet Research Terminal 
Broadcom’s growth outlook was 15.5% before the EU and FTC increased the risk of another failed mega-deal. But 12.5% growth is still 50% more than the S&P 500 and about 25% better than dividend growth stocks, as represented by VIG.
Long-Term Consensus Total Return Potential
| Investment Strategy | Yield | LT Consensus Growth | LT Consensus Total Return Potential | Long-Term Risk-Adjusted Expected Return |
| Broadcom | 3.4% | 12.5% | 15.9% | 11.1% |
| Vanguard Dividend Appreciation ETF | 1.9% | 10.2% | 12.1% | 8.5% |
| Nasdaq | 0.8% | 10.9% | 11.7% | 8.2% |
| Schwab US Dividend Equity ETF | 3.4% | 7.6% | 11.0% | 7.7% |
| Dividend Aristocrats | 1.9% | 8.5% | 10.4% | 7.3% |
| S&P 500 | 1.8% | 8.5% | 10.3% | 7.2% |
(Source: DK Research Terminal, FactSet, Morningstar, YCharts.)
Broadcom still offers an attractive yield growing at double-digit and the potential for 16% long-term returns. If you’re looking to turbocharge a core ETF position to boost yield, growth, and return potential, it’s one of the best long-term choices you can make.
Reasons To Potentially Buy Broadcom Today
| Metric | Broadcom |
| Quality | 83% 12/13 Super SWAN (Sleep-Well-At Night) Quality Chip Maker |
| Risk Rating | Medium Risk |
| DK Master List Quality Ranking (Out Of 500 Companies) | 259 |
| DK Master List Quality Percentile | 49% |
| Dividend Growth Streak (Years) | 12 |
| Dividend Yield | 3.4% |
| Dividend Safety Score | 85% |
| Average Recession Dividend Cut Risk | 0.5% |
| Severe Recession Dividend Cut Risk | 1.80% |
| S&P Credit Rating |
BBB- Positive Outlook |
| 30-Year Bankruptcy Risk | 11.00% |
| LT S&P Risk-Management Global Percentile |
41% Average, Medium Risk |
| Fair Value | $609.20 |
| Current Price | $551.91 |
| Discount To Fair Value | 9% |
| DK Rating |
Potential Reasonable Buy |
| P/E | 14.5 |
| Cash-Adjusted P/E | 11.4 |
| Growth Priced In | 5.8% |
| Historical P/E | 14.5 to 15.5 |
| LT Growth Consensus/Management Guidance | 12.5% |
| PEG Ratio | 0.91 |
| 5-year consensus total return potential |
14% to 25% CAGR |
| Base Case 5-year consensus return potential |
17% CAGR (About 2.5X The S&P 500) |
| Consensus 12-month total return forecast | 23% |
| Fundamentally Justified 12-Month Return Potential | 14% |
| LT Consensus Total Return Potential | 15.9% |
| Inflation-Adjusted Consensus LT Return Potential | 13.5% |
(Source: Dividend Kings Zen Research Terminal)
Broadcom isn’t a great bargain right now, just another Buffett-style “wonderful company at a reasonable price.” Its 11.4X cash-adjusted P/E is what private equity is paying for companies now.
Broadcom 2025 Consensus Return Potential
(Source: FAST Graphs, FactSet)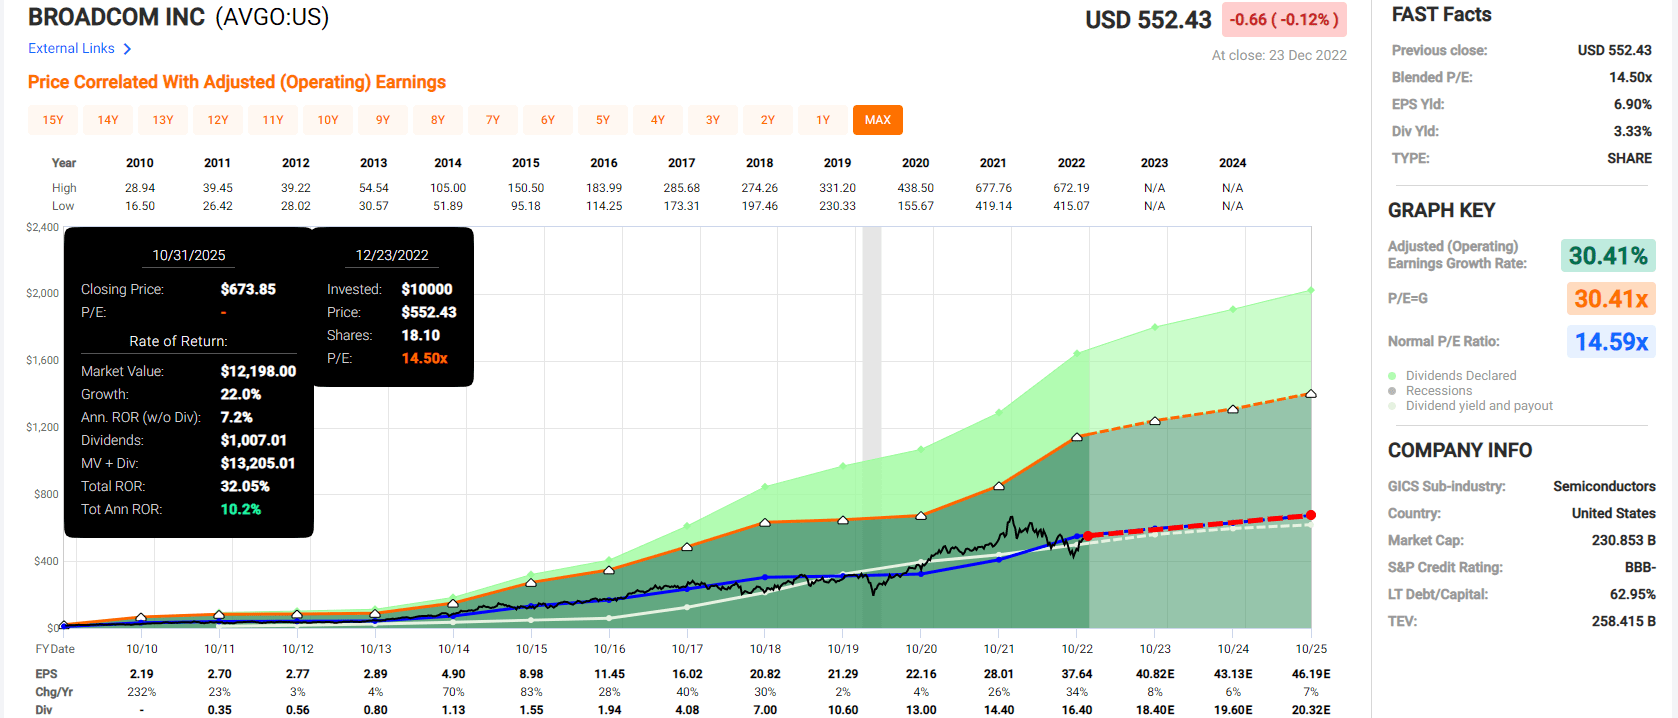
Due to slower growth in the next few years, partially due to the smartphone upgrade cycle, AVGO’s return potential through 2025 is roughly equal to the market’s.
Broadcom 2029 Consensus Return Potential
(Source: FAST Graphs, FactSet)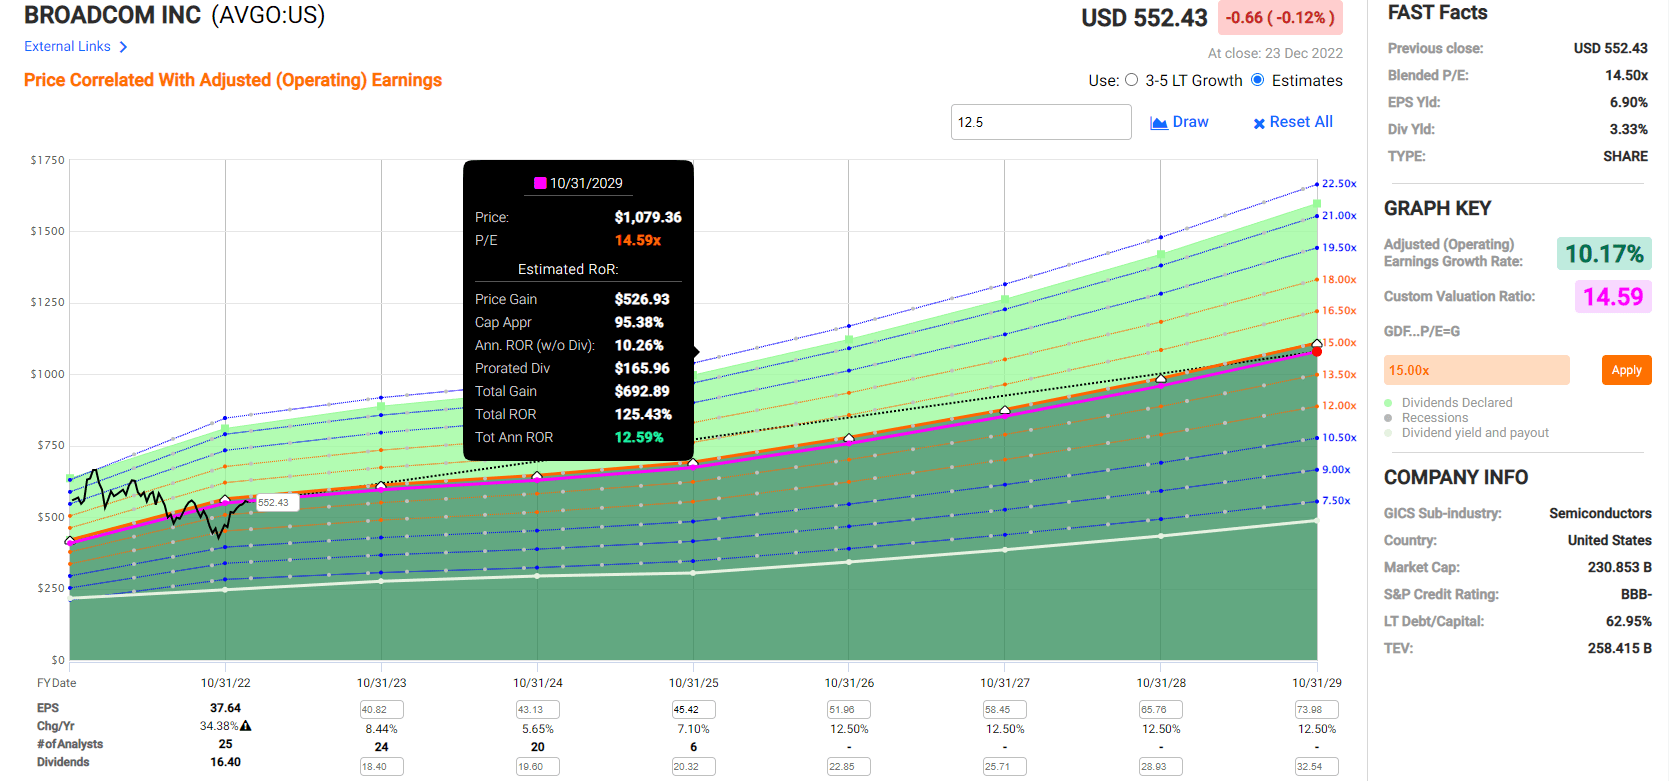
Even at a modest discount to fair value, AVGO’s strong yield and steady growth are expected to deliver about 2.5X the returns of the S&P over the coming five years.
Broadcom Investment Decision Score
Dividend Kings Automated Investment Decision Score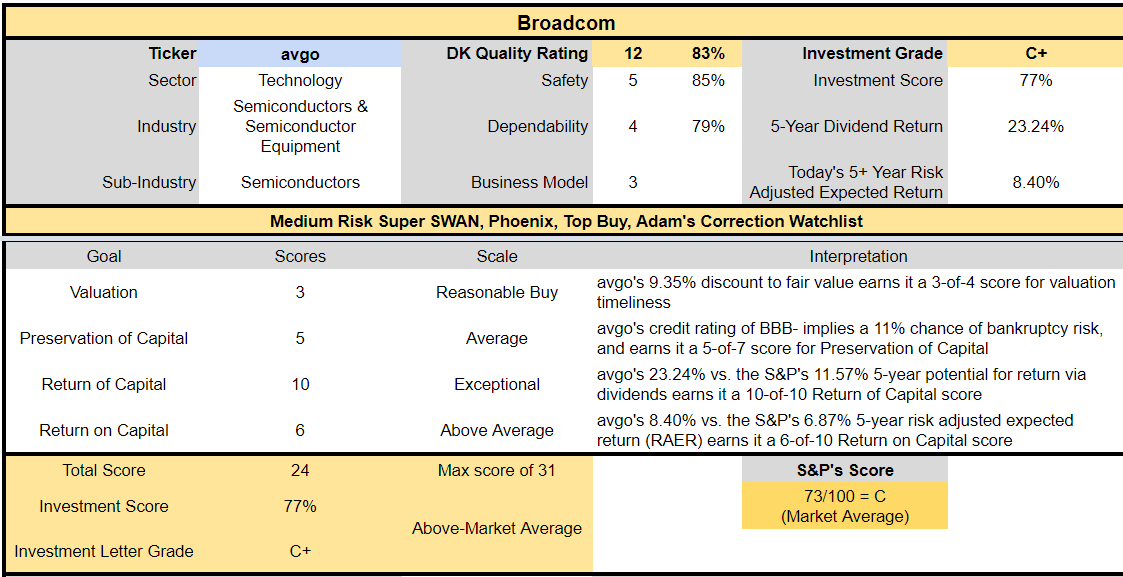
AMGN is an above-average high-yield opportunity for anyone comfortable with its risk profile. Look at how it compares to the S&P 500.
- 9% discount to fair value vs. 1% discount S&P = 8% better valuation
- 3.4% safe yield vs. 1.8% (2X higher and safer)
- approximately 15.9% long-term annual return potential vs. 10.2% CAGR S&P
- about 33% higher risk-adjusted expected returns
- 2.5X higher income potential over five years.
Bottom Line: Amgen And Broadcom Are Two Of The Best High-Yield Blue-Chips You Can Buy For 2023 And Beyond
Let me be clear: I’m NOT calling the bottom in AMGN or AVGO (I’m not a market-timer).
Not even Ultra SWAN quality does NOT mean “can’t fall hard and fast in a bear market.”
Fundamentals are all that determine safety and quality, and my recommendations.
- over 30+ years, 97% of stock returns are a function of pure fundamentals, not luck
- in the short term; luck is 25X as powerful as fundamentals
- in the long term, fundamentals are 33X as powerful as luck.
While I can’t predict the market in the short term, here’s what I can tell you about AMGN and AVGO.
Both are high-yield dividend superstars that are likely to become dividend aristocrats.
Both offer far superior growth prospects than almost any popular ETF or investment strategy.
Both are Buffett-style “wonderful companies at reasonable prices.”
Both have delivered strong double-digit dividend growth for 11 to 12 years and are expected to continue to do so in the future.
And both are wonderful examples of why world-beater dividend growth blue-chips are the best-performing asset class in history.
If you’re tired of losing money in bear markets, then maybe it’s time to stop speculating and start investing for your long-term future.
Be the first to comment