


JHVEPhoto
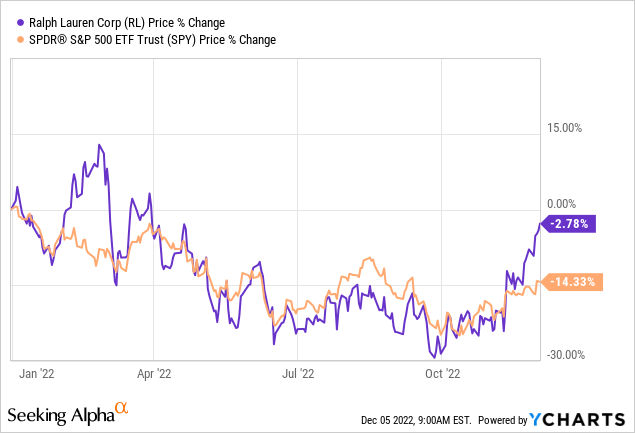
Ralph Lauren Corporation (NYSE:RL) designs, markets, and distributes lifestyle products in North America, Europe, Asia, and internationally. The firm’s stock has outperformed the broader market year-to-date, but we believe that this outperformance is not likely to last long.
In today’s articles we will take a look at the firm’s latest earnings report, together with its valuation, and explain why we believe that the stock is currently not attractive.
Q3 results
Following the third quarter earnings results announcement, the stock price has increased quite substantially. In our opinion, the results have been interpreted too optimistically and therefore we expect that the outperformance will not last long.
Let us take a look at some of the line items from the income statement and the balance sheet to support our argument.
Revenue
Revenue has increased by 5% (or 13% in constant currency) year-over-year, reaching $1.5799 billion in Q3, and exceeding Wall Street expectations.

Income statement
The following table breaks down the revenue by sales channel:

Revenue by sales channel
We can see that revenue has grown across all channels compared to the prior year period. Even a slight revenue growth can appear attractive in the current macroeconomic environment, therefore at first glance the results are indeed promising. However, when we look at the balance sheet, the picture slightly changes.

Assets
While revenue growth has been about 5% year-over-year, accounts receivable have increased by about 20%. When accounts receivables grow at a substantially faster rate than the revenue, it may indicate that the firm started to sell more on credit, or started to recognise revenue differently. If so, one has to understand what impacts it may have on the accounting for doubtful accounts and other reserves balances.
Also important to mention that a substantial percentage of RL’s revenue is generated outside of the United States. The relative strength of the USD compared to other currencies is likely to further negatively impact RL’s financial performance in the coming quarters.

Revenue by region
For these reasons, we are not entirely impressed with the revenue growth in Q3.
Costs
Both cost of goods sold and selling, general and administrative (SG&A) expenses have increased compared to the year ago quarter. As a result, both the gross margin and the operating margin have contracted significantly.
Gross margin has contracted by 270 basis points, driven by the increased product costs and freight costs. The operating margin has contracted even more, by 370 basis points, driven by the higher compensation and selling expenses.
We believe that many of the headwinds are temporary in nature, but are likely to keep negatively impacting RL’s financial performance in the coming quarters. As long as we do not see a meaningful positive change in consumer sentiment and energy prices, we do not recommend starting a position in RL.
Valuation
We are going to look at the valuation of RL’s stock from two different perspective: price multiples and dividends.
Price multiples
When comparing RL’s valuation metric to the consumer discretionary sector median, we can see that the stock is selling at a substantial premium according to most of the metrics.
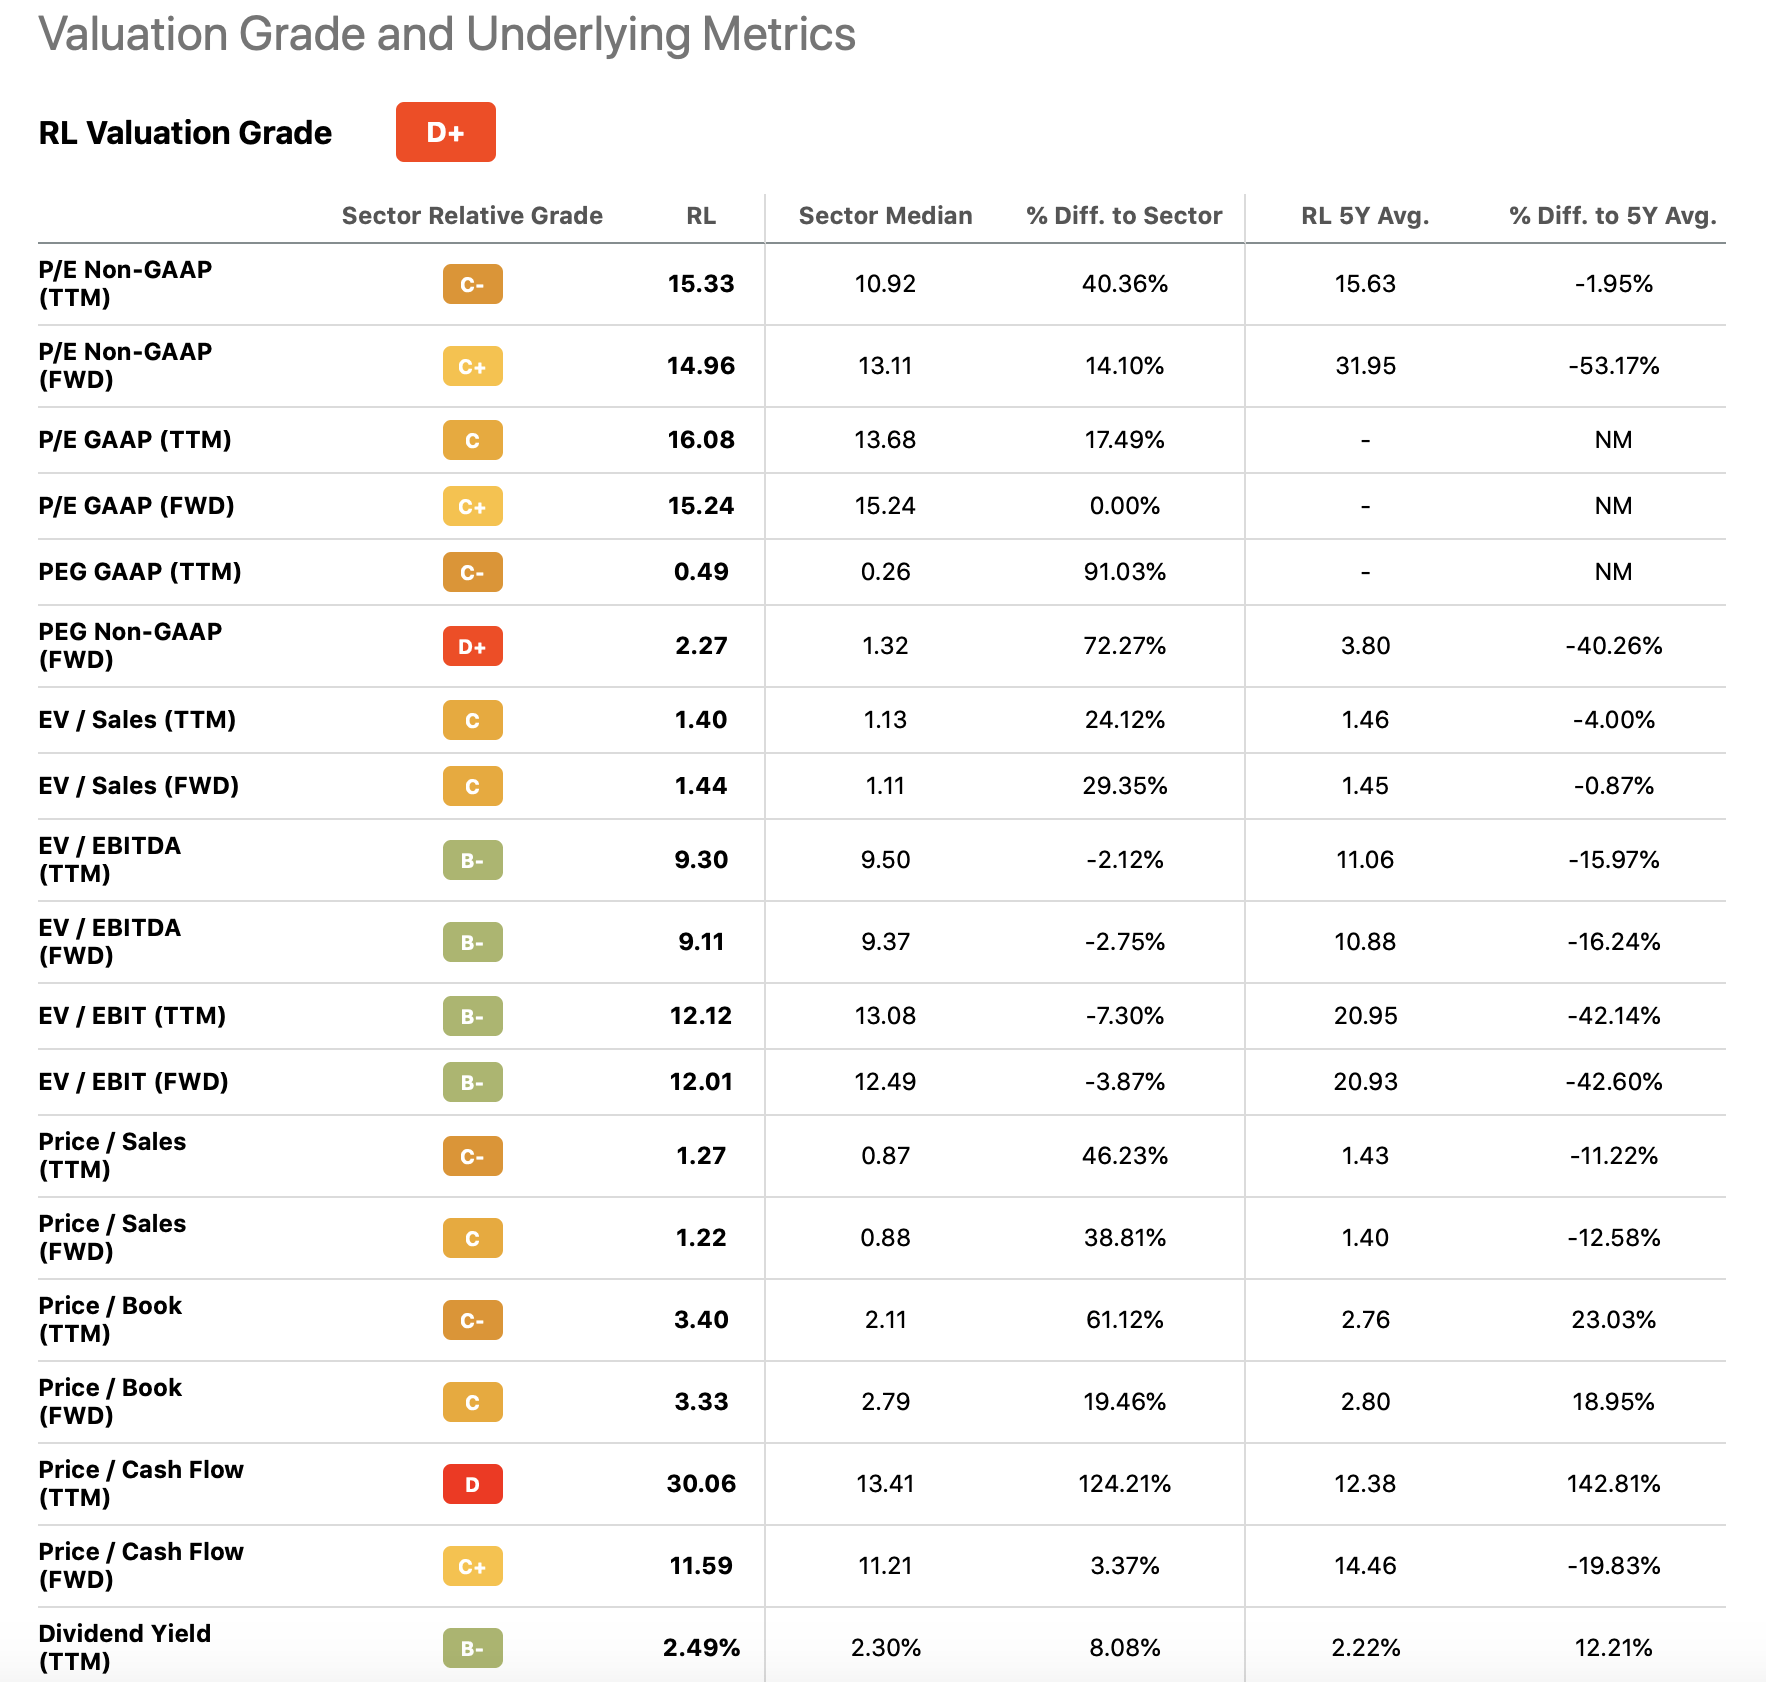
Valuation metrics (Seeking Alpha)
We believe that in the current market environment such multiples are not necessarily justified and we would like the stock price to get closer to the sector median before we would consider starting a position. In October 2022, the stock price was actually close to these levels.
Dividends
To value the firm based on its dividends, we will be using the Gordon Growth Model.
The Gordon growth model (‘GGM’) is a simple and well-recognized dividend discount model, used to value the equity of dividend paying firms. The main assumption of this model is that the dividend grows indefinitely at a constant rate. Due to this criterion, the growth model is particularly appropriate for firms that are:
1.) Paying dividends
2.) In the mature growth phase
3.) Relatively insensitive to the business cycle
A strong track record of steadily increasing dividend payments at a stable growth rate could also serve as a practical criterion if the trend is expected to continue in the future.
The model is described by the following formula:
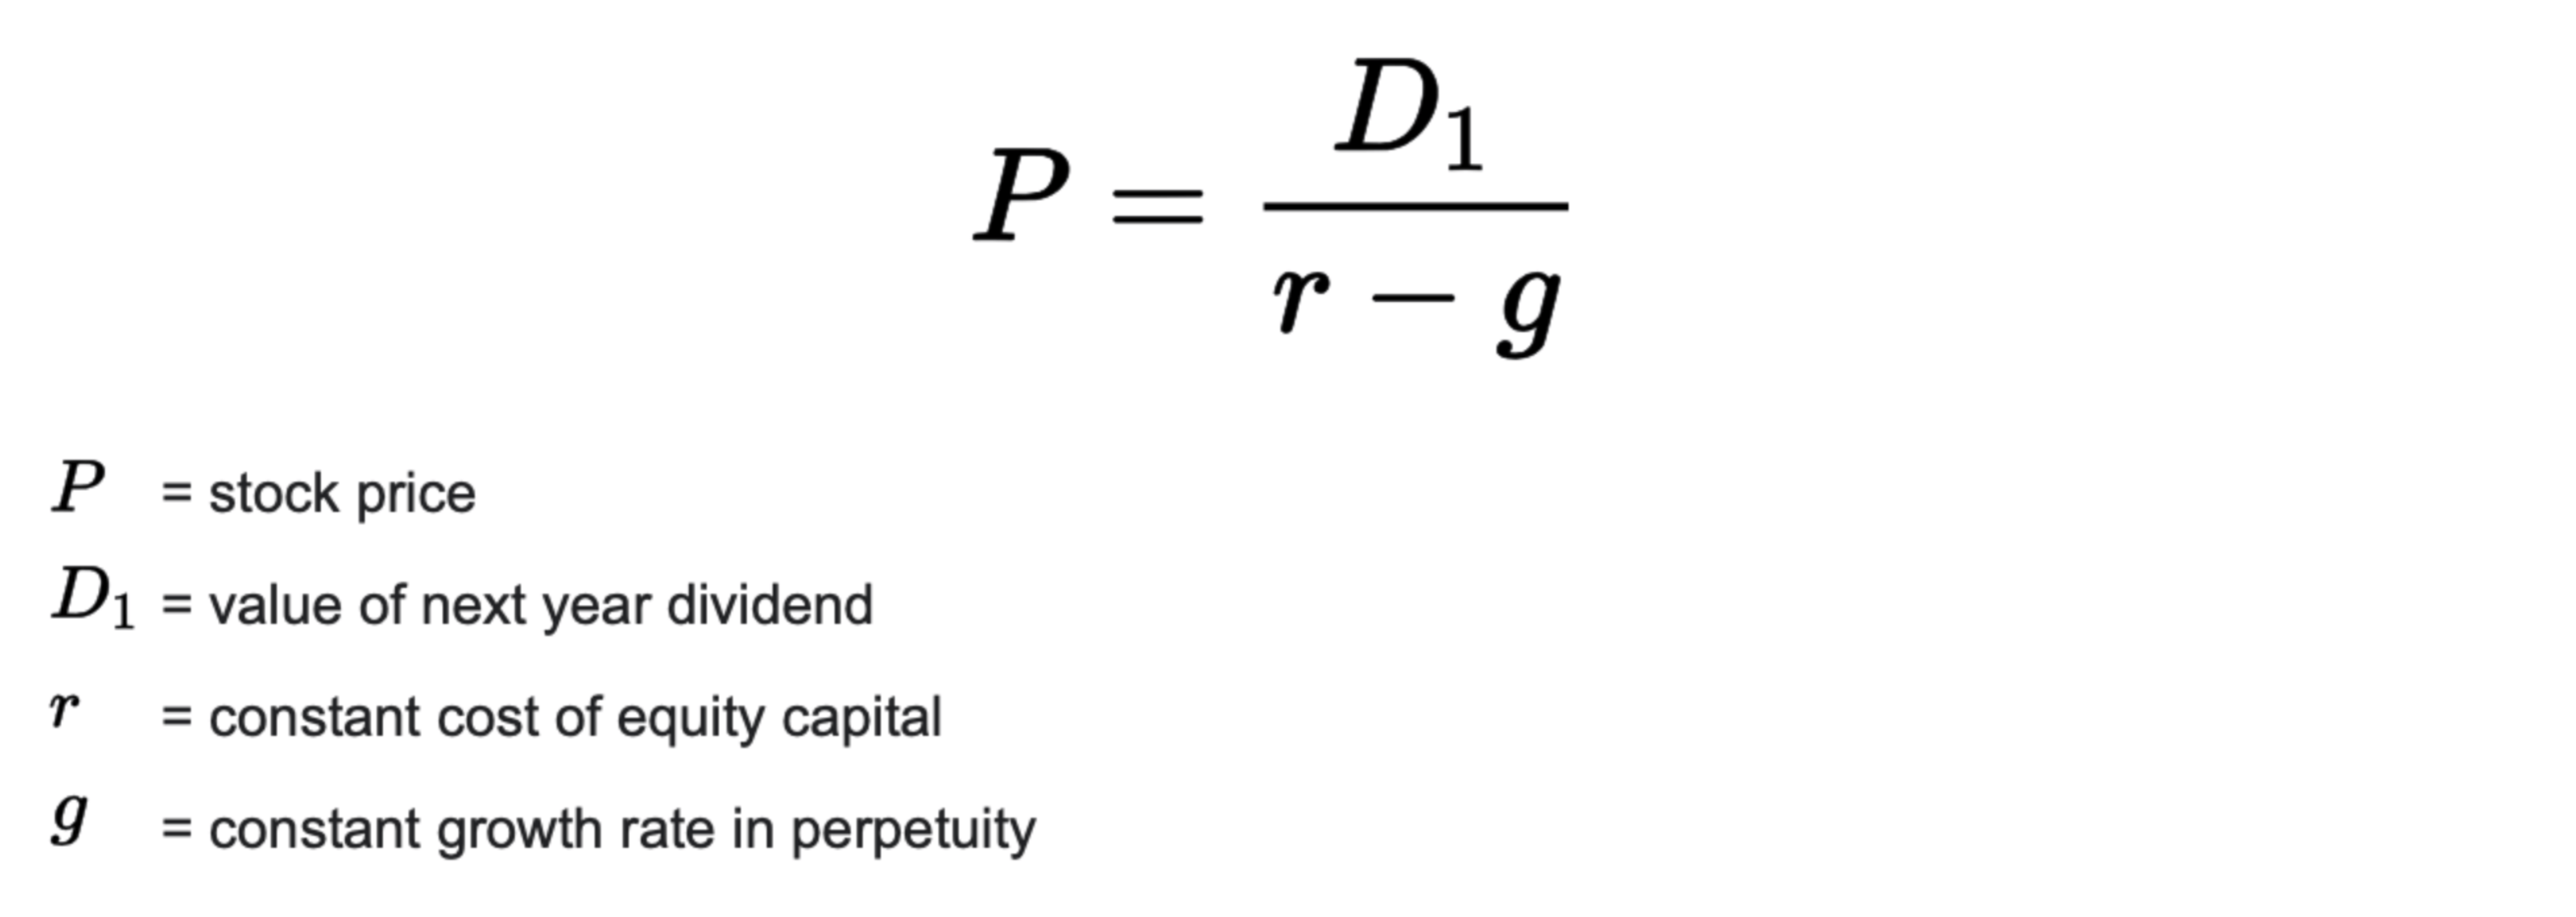
GGM (wallstreetprep.com)
When using the firm’s weighted average cost of capital of 9% and its long-term dividend growth rate of 3% to 6%, we get a fair value range of $57 to $106.

Fair value USD per share (Author)
We believe that a constant growth rate of 6% in perpetuity is a quite aggressive assumption already, and currently the stock price is even above this range.
The valuation method also indicates that the stock may be substantially overvalued at the current price levels.
Be the first to comment