


Pgiam/iStock via Getty Images
Get ready for charts, images, and tables because they are better than words. The ratings and outlooks we highlight here come after Scott Kennedy’s weekly updates in the REIT Forum. Your continued feedback is greatly appreciated, so please leave a comment with suggestions.
Today is a great day for doing quick picks. I want to highlight a bunch of shares rapidly where we are either bullish or where we changed our view materially from prior comments.
NEWT
Let’s start with NEWTEK Business Services (NEWT). We were previously bearish on NEWT. Not just a little bearish either. We slammed NEWT hard a little over a year ago:
Seeking Alpha
The relevant article was: Drop These 7% Yielders
We argued that the price-to-book for NEWT was insane, even using the following chart:
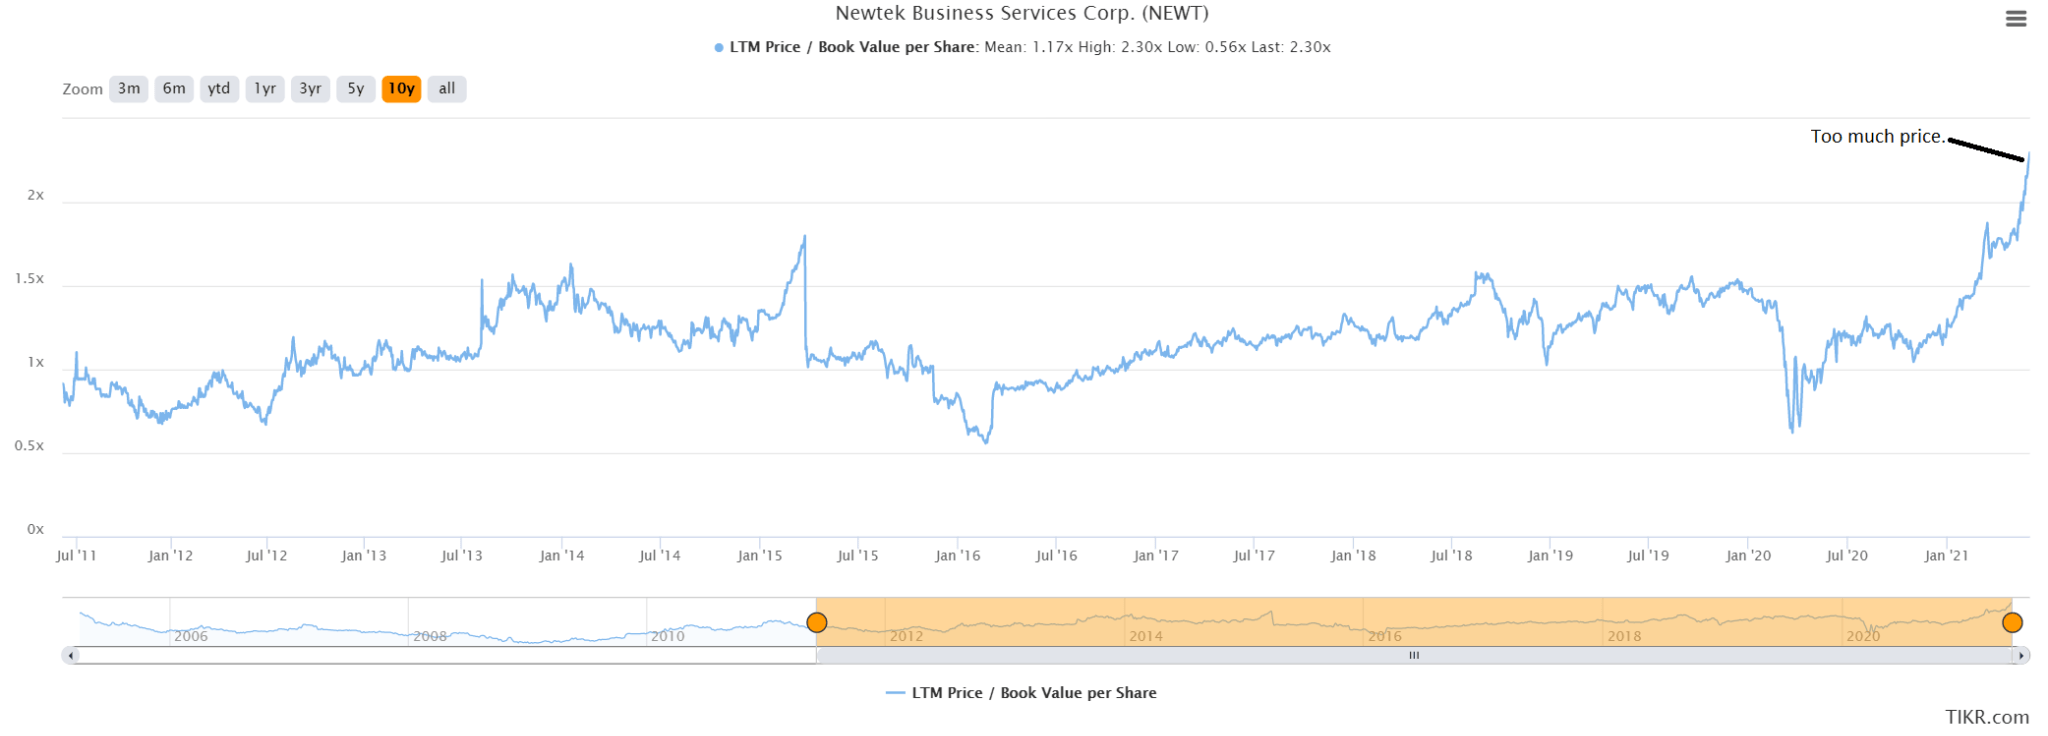
The article was published on the morning of June 5th, 2021 (a Saturday). On Friday, NEWT had closed at $38.70. We felt that was simply “too much price”. However, today shares trade at $18.99. NEWT paid out some dividends over the last year, but the share price is down more than 50%. The article stirred up some controversy as well, so the comment section is a blast.
With shares at $18.99, they are cheap enough we could easily justify a bullish rating. They are below our “buy under” target price, which is always a good sign. However, I’m going neutral because we’re planning to drop coverage of NEWT and I don’t want to leave an open rating while we end coverage. Bit of a complex view, but I think most readers can handle it. Shares are attractively valued, but we don’t want to leave an open rating when we won’t be covering the shares.
Note: NEWT is not one of the shares with a big discount to NAV. Shares still trade above NAV. The other shares we are highlighting do have big discounts.
FSK
Next share to highlight is Franklin Square KKR Capital (FSK). We’re taking a bullish view here. Shares are carrying a dividend yield of nearly 14% and trade at a price-to-NAV ratio (using our estimates for NAV) of 0.74. Our NAV estimate suggests a lower NAV today than at the end of Q1 2022, but the valuation leaves plenty of upside in the share price. However, shares carry a risk rating of 4, which is on the higher end for the BDCs we cover.
While FSK isn’t in my portfolio currently, we have traded in it before. Scott Kennedy owns shares in FSK, so shareholders are in great company.
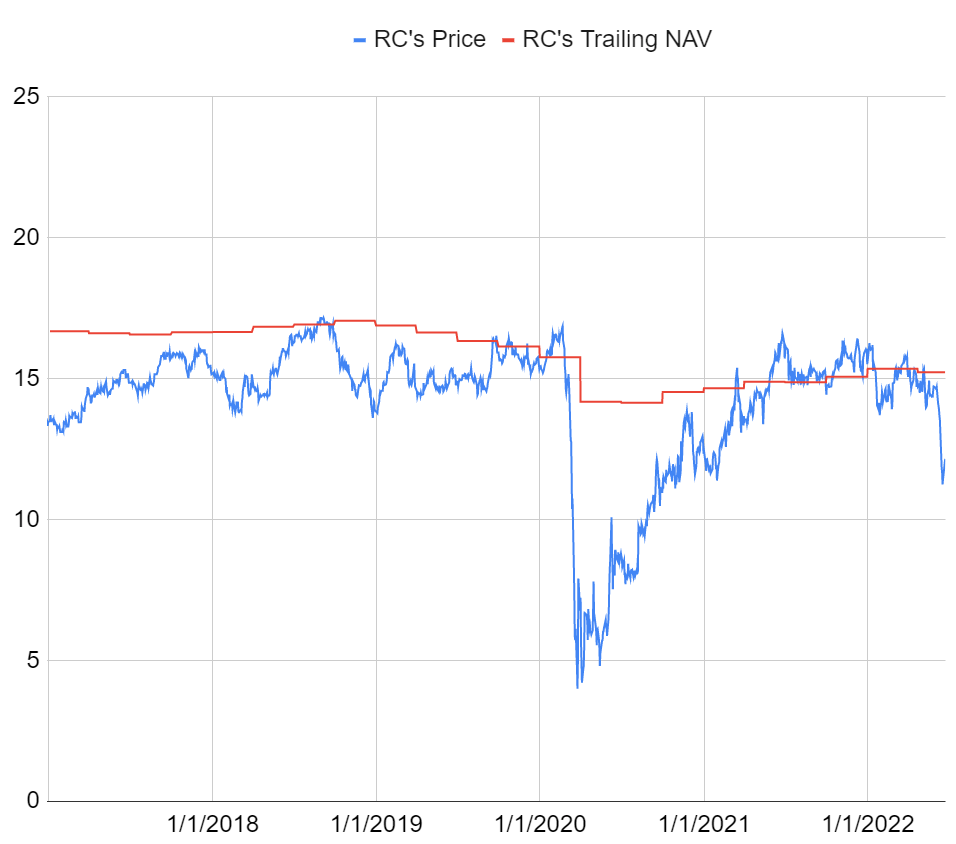
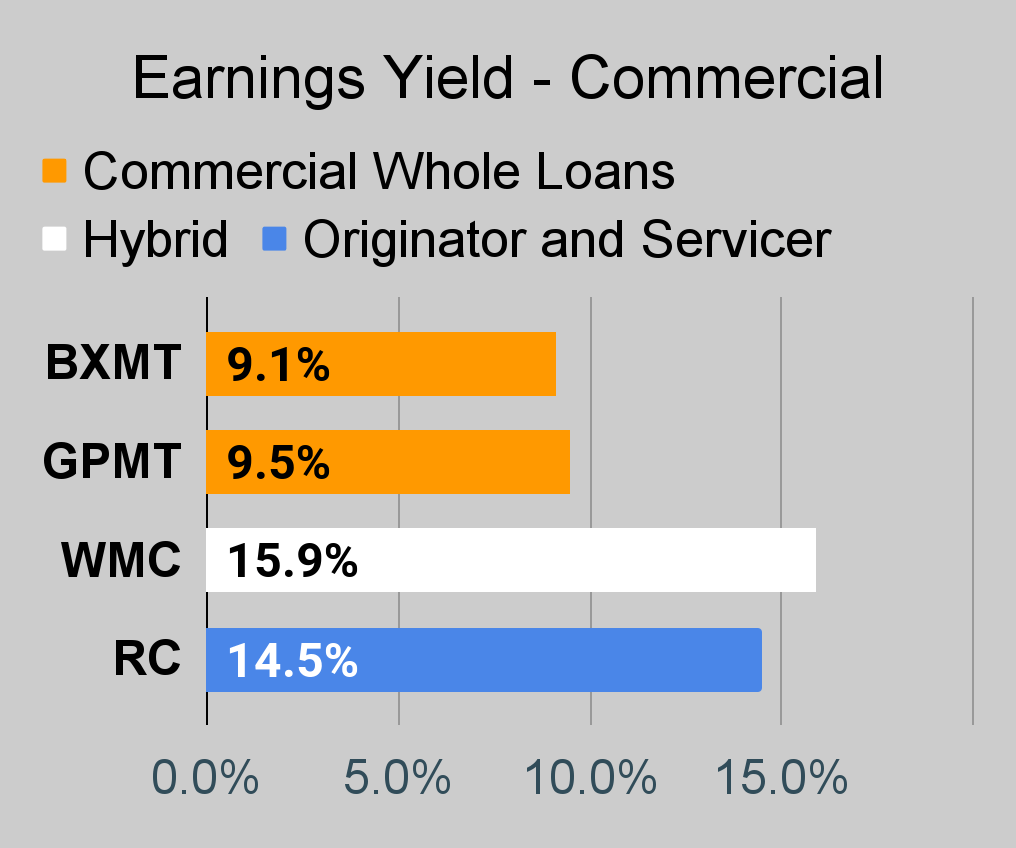
Ready Capital
Ready Capital (RC) looks like a good deal. Shares traded at an unusually large discount to book value. RC has generally done a pretty good job of managing their book value for shareholders. They did take a hit during the pandemic, but they recovered a significant chunk of that.
The REIT Forum
Is book value getting destroyed this quarter? We don’t think so. We’ve estimated a slight negative change in book value per share. Perhaps somewhere around a 3% decline. While book value has been fairly steady, the share price certainly saw a big drop. RC is trading around 0.86x our estimates. That’s a good deal.
Let’s run through a few recent metrics from RC:
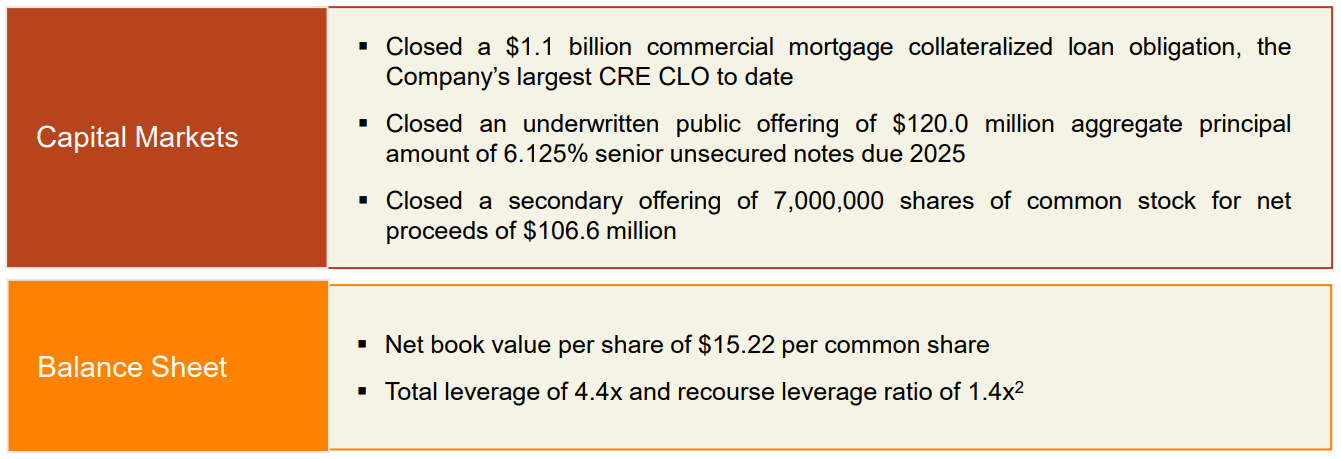
The company’s CRE CLO is a fancy way of saying they locked in some non-recourse funding. That’s vastly better than relying on short-term financing where the lender can demand additional capital. They also closed an offering 6.125% senior unsecured notes. In this market, having that financing in place for the next few years at 6.125% is pretty nice. They also sold some common stock. Quick math suggests that the average proceeds per share would be about $15.22. For reference, that’s a bit above our projection for current book value and materially above today’s share price of $12.70. It’s also equal to the company’s Q1 2022 net book value per share of $15.22.
The final point is that recourse leverage of 1.4x being dramatically lower than the 4.4x. If we dip into a recession (which I think we’ve already hit), having most of their leverage in the non-recourse format is better.
At a 0.86 price-to-estimated-book-value ratio and a 13.2% dividend yield, shares of RC are trading at an attractive price.
CIM-A
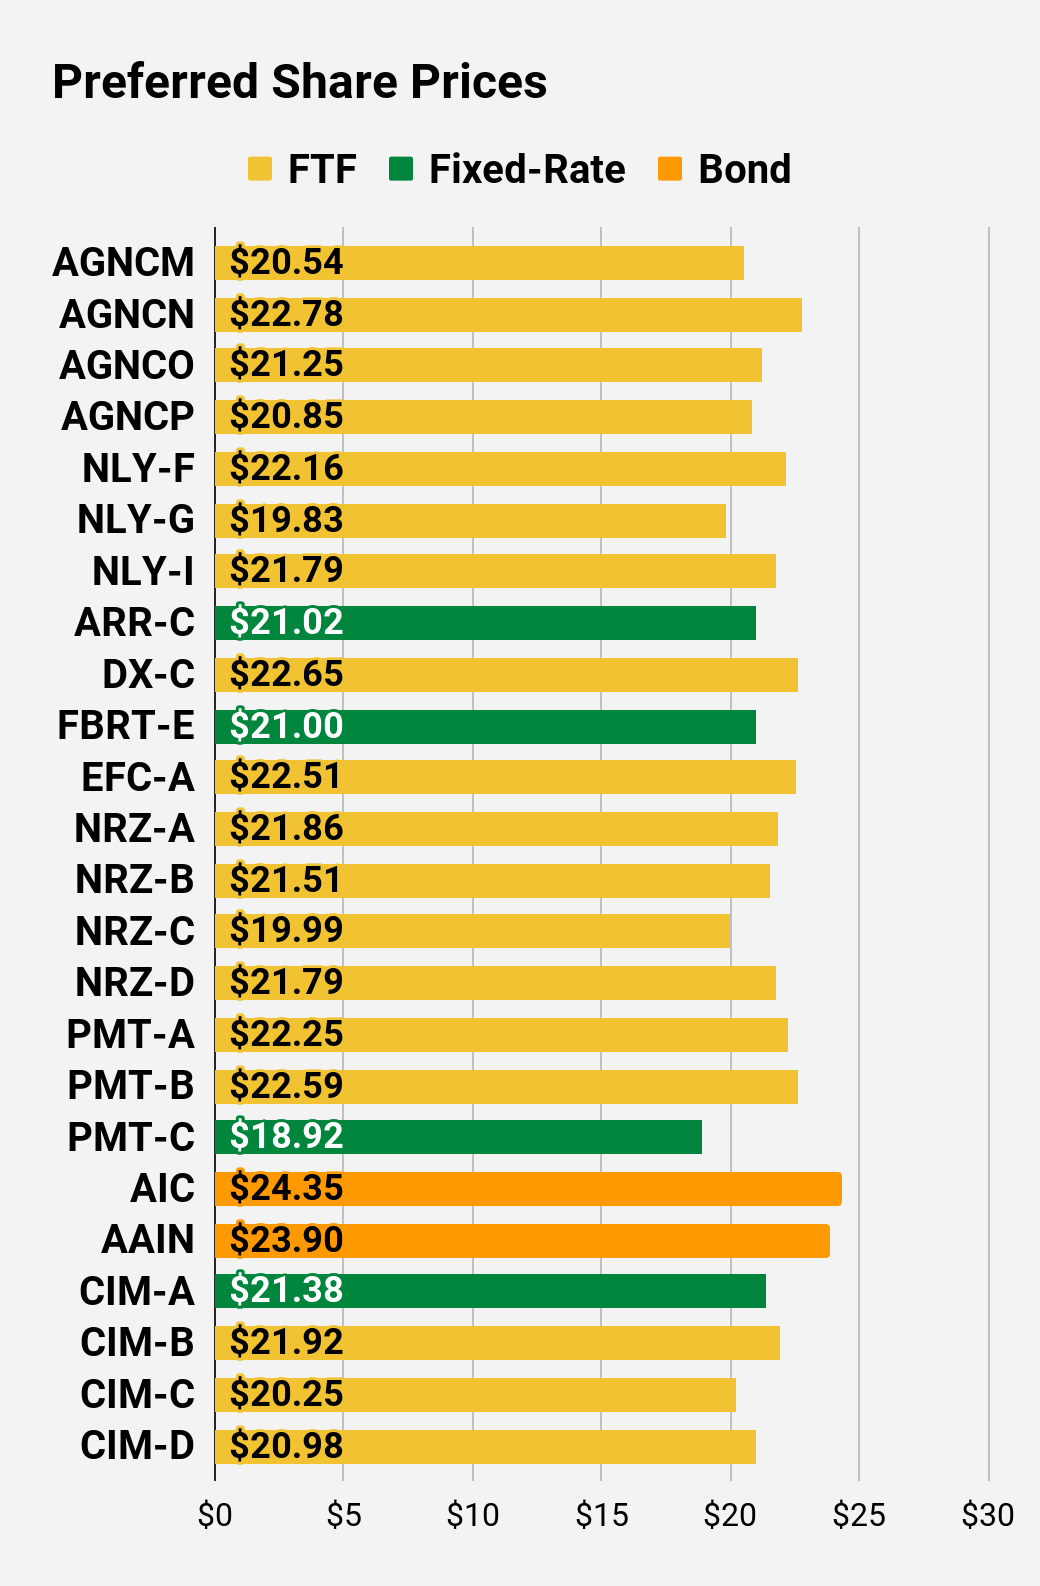
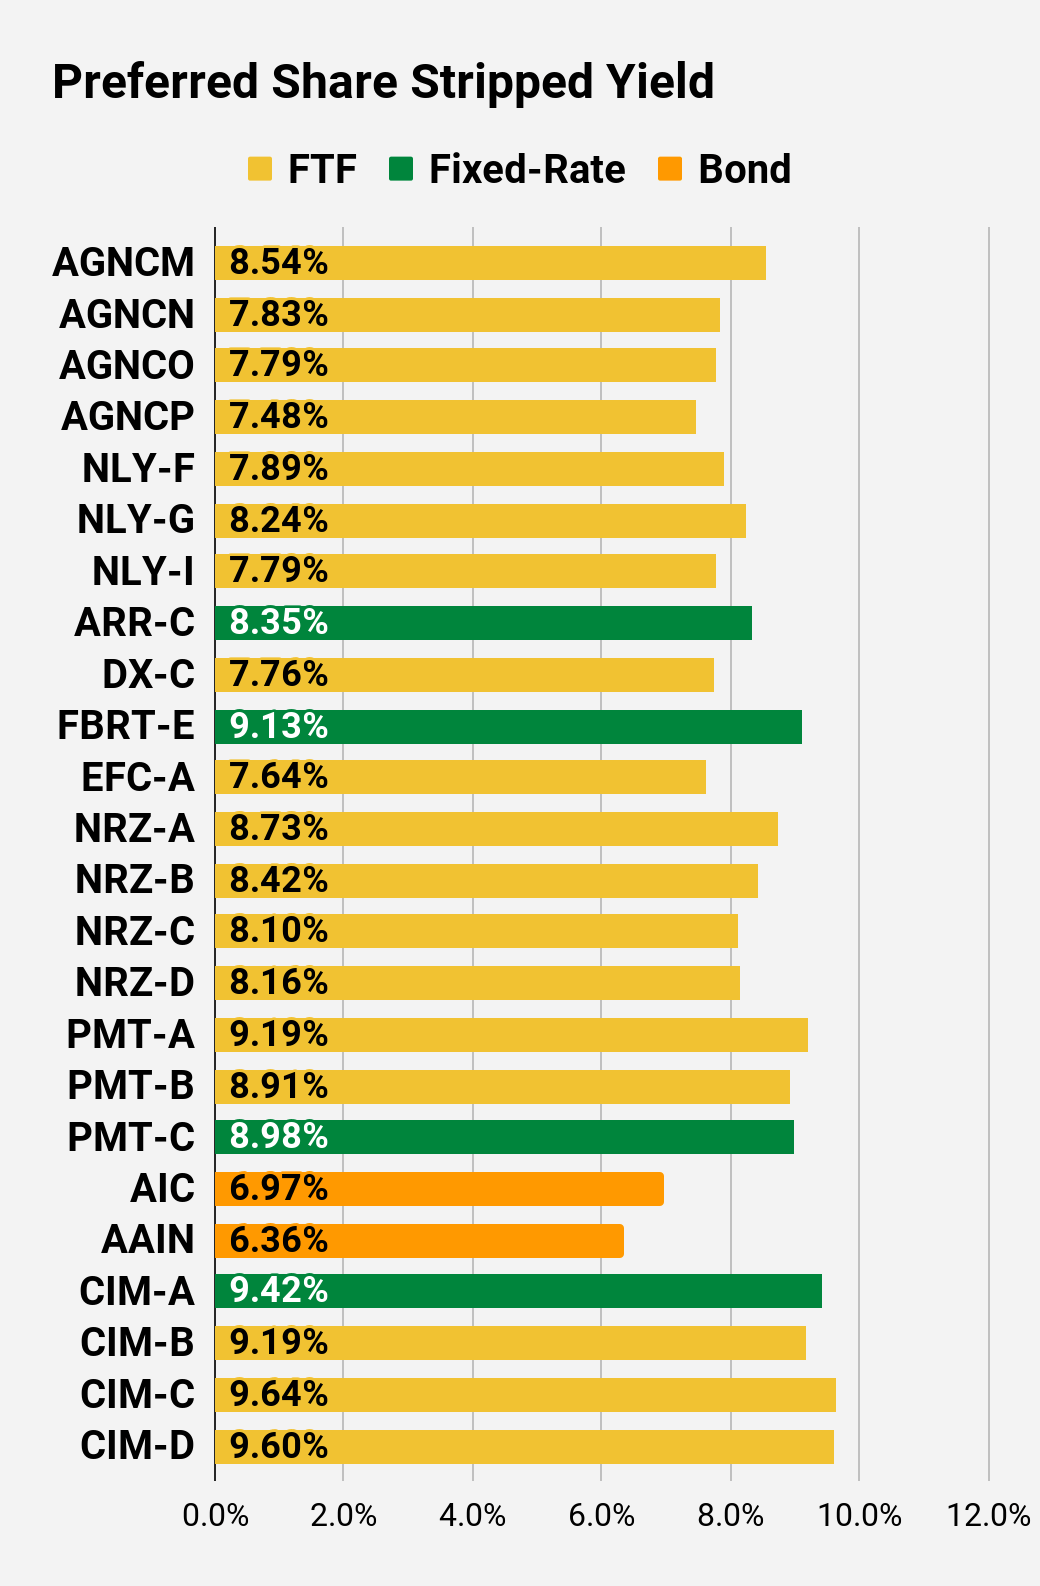
CIM-A (CIM.PA) needs to get mentioned here. This is a combination of a significant dividend yield and a hedge against rates declining. CIM-A is a fixed-rate share and clearly fixed-rate shares are so “uncool” today. However, the shares have a stripped yield of 9.42%, which is excellent. The coupon rate is 8%, but the shares trade at $21.38 and carry about $0.15 of dividend accrual. $2.00 in dividends divided by a stripped price of $21.23 = 9.42%.
I’ll admit that we reduced our position in CIM-A recently. I really didn’t want to shrink the position, but at the time shares of New Residential (NRZ) were trading in the $8.20 to $8.30 range and I was out of cash.
What was I to do but place a trade?
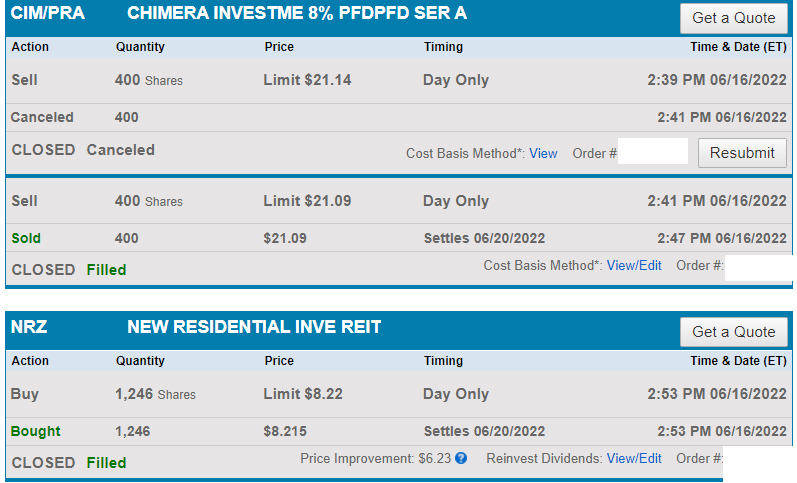
Schwab
That’s all one image because the trade was in the same account since I needed to do it to free up the cash. I still want more shares of CIM-A, but I needed cash for the trade.
Cash from CIM-A was used to buy shares of NRZ. While CIM-A rallied a bit over 1%, NRZ did 20% as of 6/27/2022:
The REIT Forum
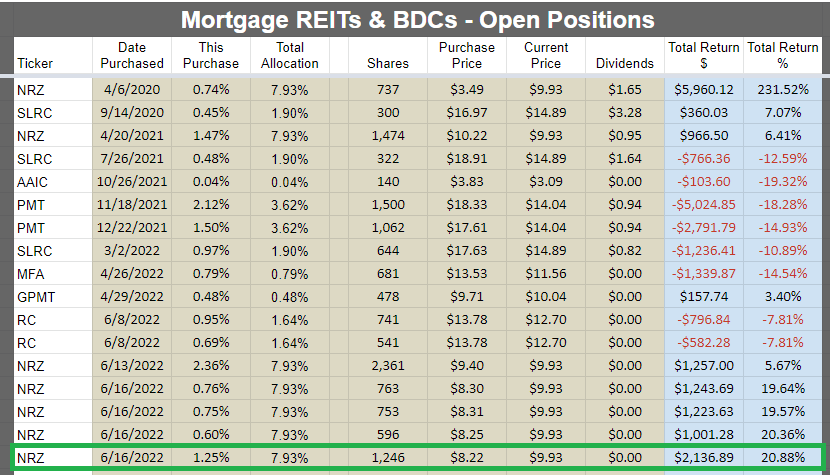
Note: Yes, we bought 4 positions in NRZ on 6/16/2022. I don’t think you really want every trade confirmation, but if you do, then just ask in the comments and I’ll link them. We had to unload a few positions to free up that cash.
We are in an unrealized loss on some positions, but the VanEck Vectors Mortgage REIT Income ETF (MORT) is down 29.5% from its high. In that context, those returns look pretty good.
We have a gift for the one guy who wants to yell: “You closed a bunch of losing positions!”
Here are all the positions I closed in the sector (for common shares) since the start of 2021:
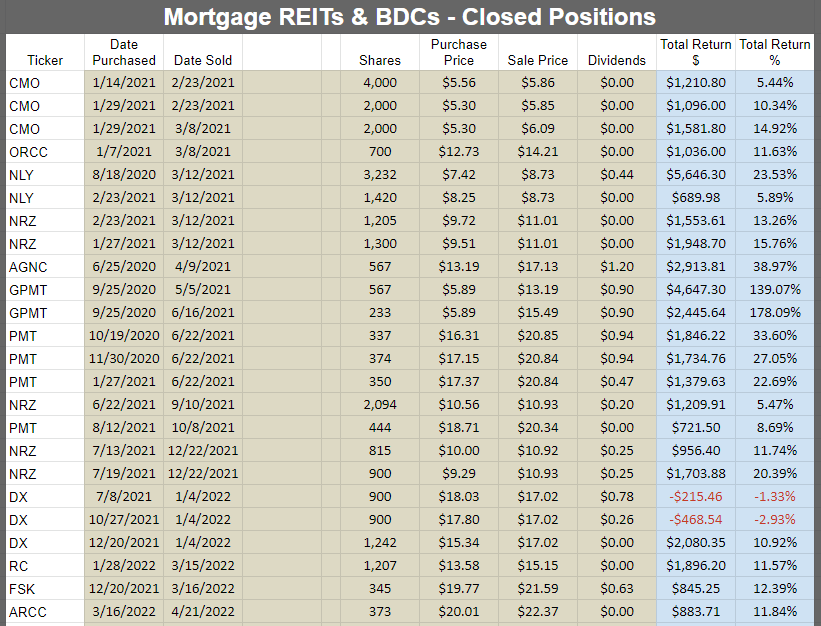
The REIT Forum
Update
This article was prepared on 6/27/2022.
On 6/28/2022, we reduced our exposure to NRZ from nearly 8% to about 5.4%.
We made that adjustment by selling the 2,361 shares we had purchased on 6/13/2022. We bought those shares for $9.40 and closed them at $9.84 with the proceeds used to invest in more preferred shares.
That’s a modest gain, but we’re still sitting on the huge unrealized gain from the 3,358 shares purchased on 6/16/2022 and the 737 shares and 2,211 shares purchased on 4/6/2022 and 4/20/2021. That leaves us with a total of 5,569 shares.
On 6/28/2022, RC dipped another 2%+ as well, which increases the discount and raises the dividend yield. FSK is down about 1.2%, with an hour left to go during market hours.
End of update
That should make it pretty clear we don’t just close losing positions to hide them. You may also notice that we locked in a nice chunk of profits in the last year, while MORT was falling 29.5%. That 52-week high was almost exactly 52 weeks ago. The only loss we locked in was on a few shares of Dynex Capital (DX), which was more than offset by the profit on other shares of DX.
Putting all that aside, I’d be happy to increase my position in CIM-A again. It’s a nice place to park some capital with a high yield and a respectable amount of upside. If you assume the 10-year Treasury yield is going to 6%, you probably won’t like this pick. However, if you assume that you might as well dump your entire portfolio to buy puts on Treasury ETFs. I simply don’t believe rates will climb that high and would rather include some fixed-rate shares as part of the portfolio as long as I get an attractive yield and some upside before hitting the call value ceiling.
Note: Please don’t dump your portfolio to buy those far out-of-the-money puts on a Treasury ETF. If you feel inclined to do that, lose your password so you can’t login to gamble your retirement.
The rest of the charts in this article may be self-explanatory to some investors. However, if you’d like to know more about them, you’re encouraged to see our notes for the series.
Stock Table
We will close out the rest of the article with the tables and charts we provide for readers to help them track the sector for both common shares and preferred shares.
We’re including a quick table for the common shares that will be shown in our tables:
Let the images begin!
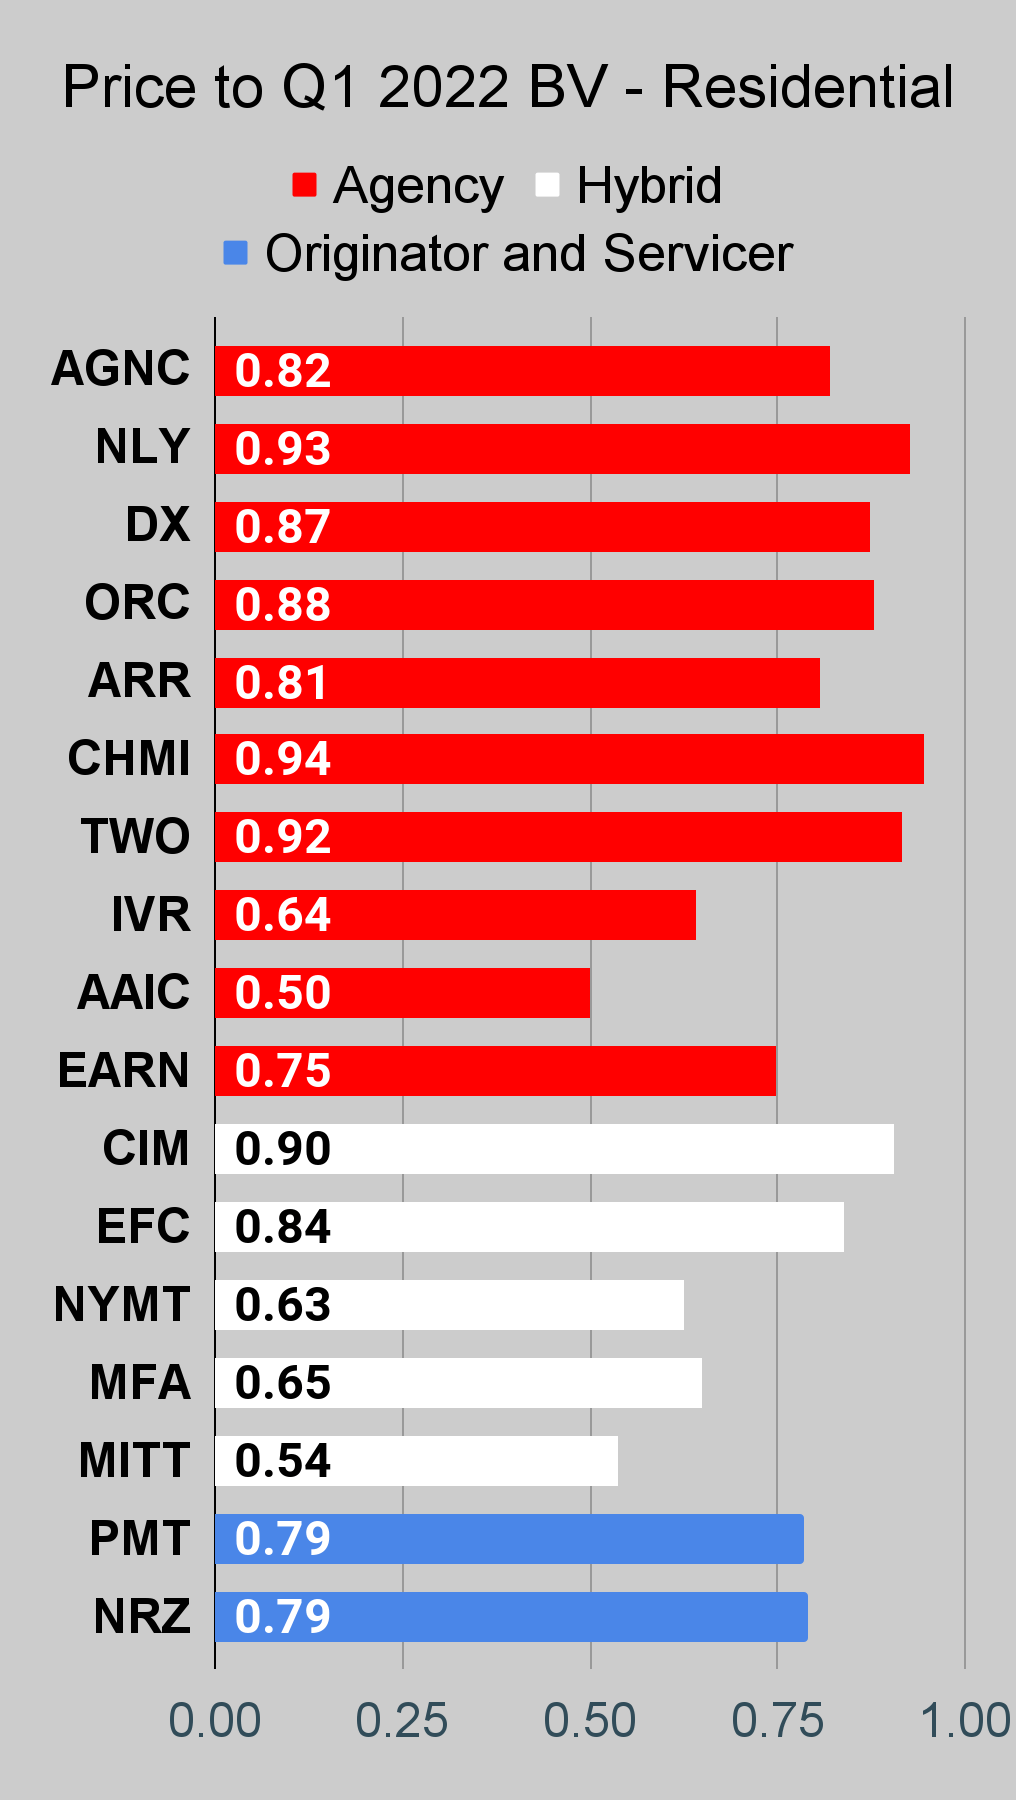
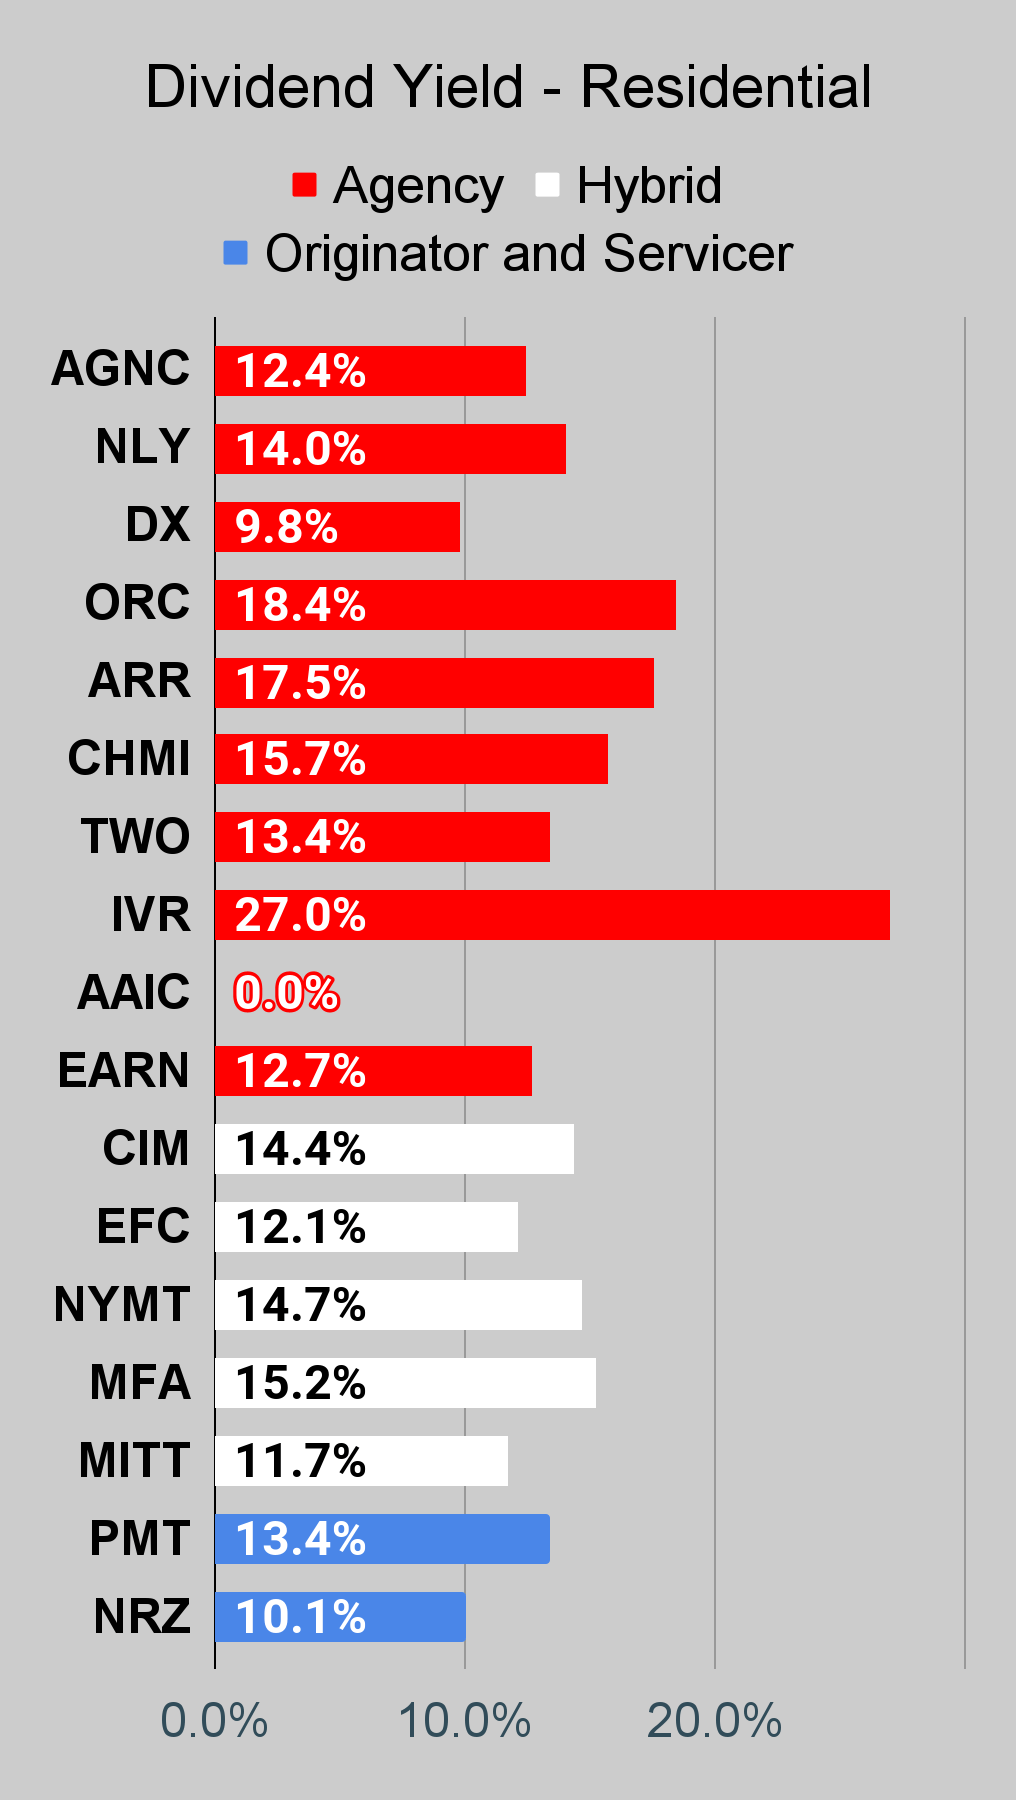
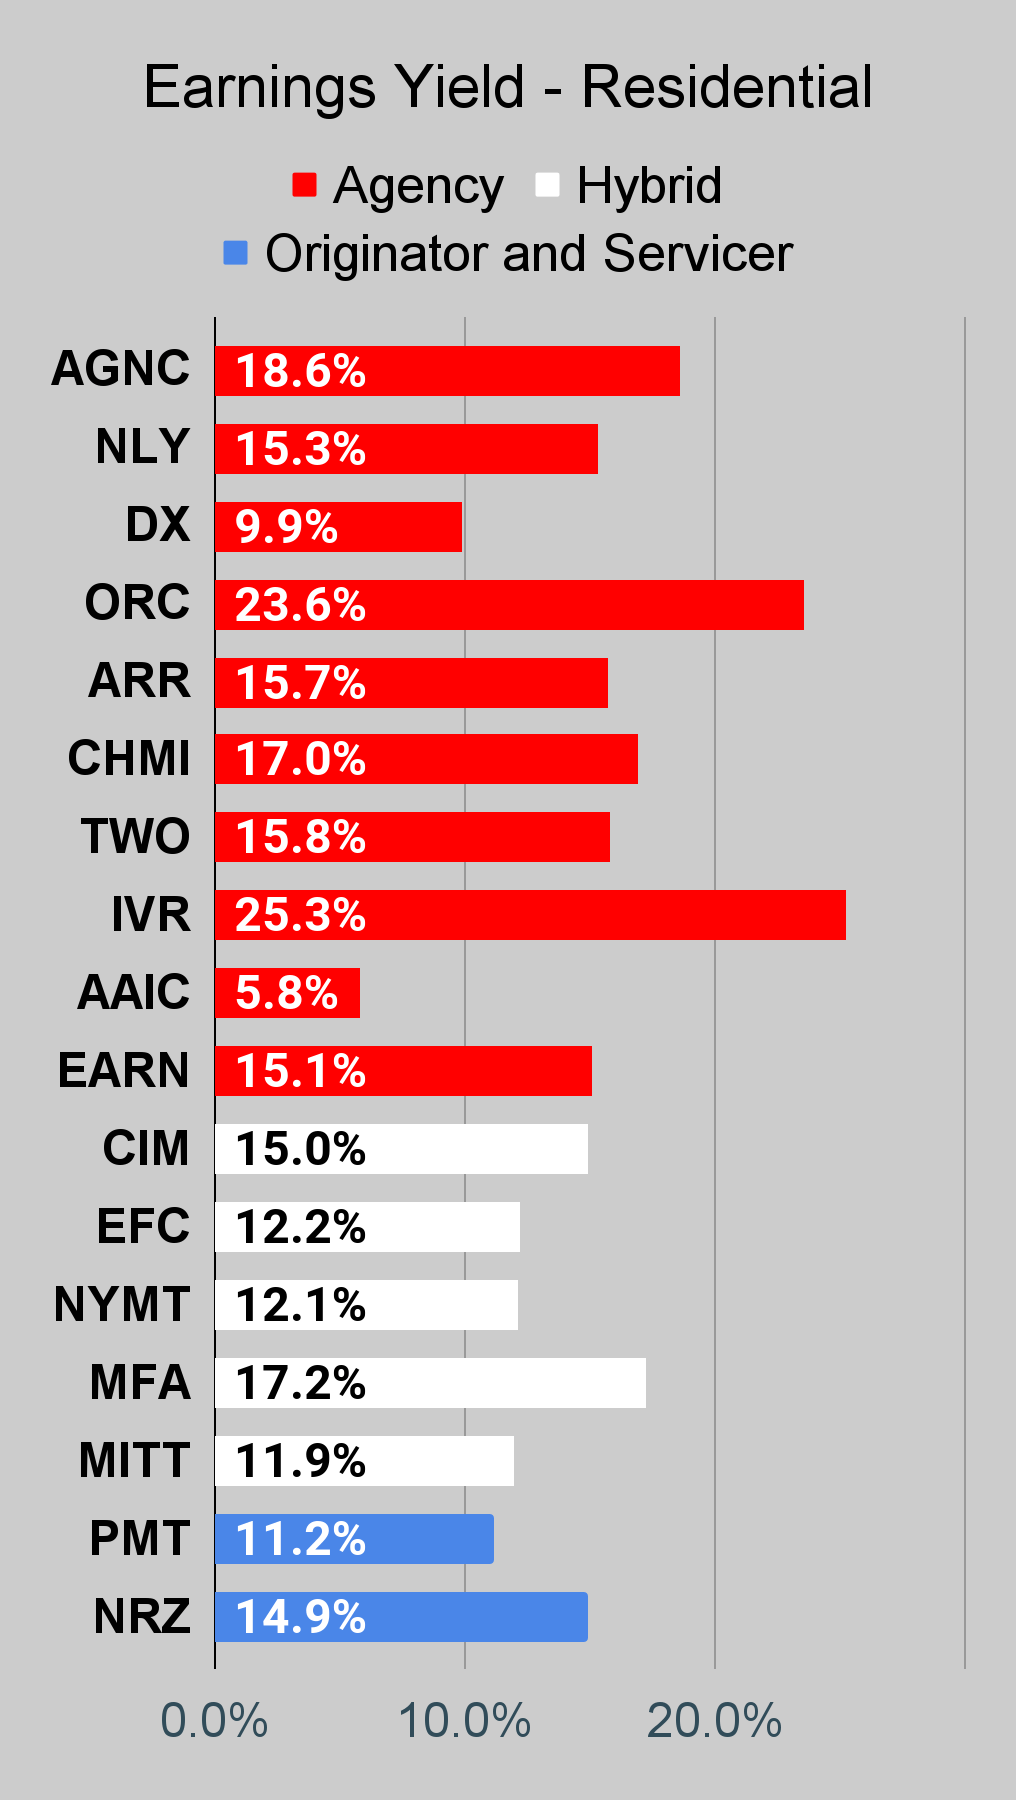
Residential Mortgage REIT Charts
Note: The chart for our public articles uses the book value per share from the latest earnings release. Current estimated book value per share is used in reaching our targets and trading decisions. It is available in our service, but those estimates are not included in the charts below.
 The REIT Forum |
 The REIT Forum |
 The REIT Forum |
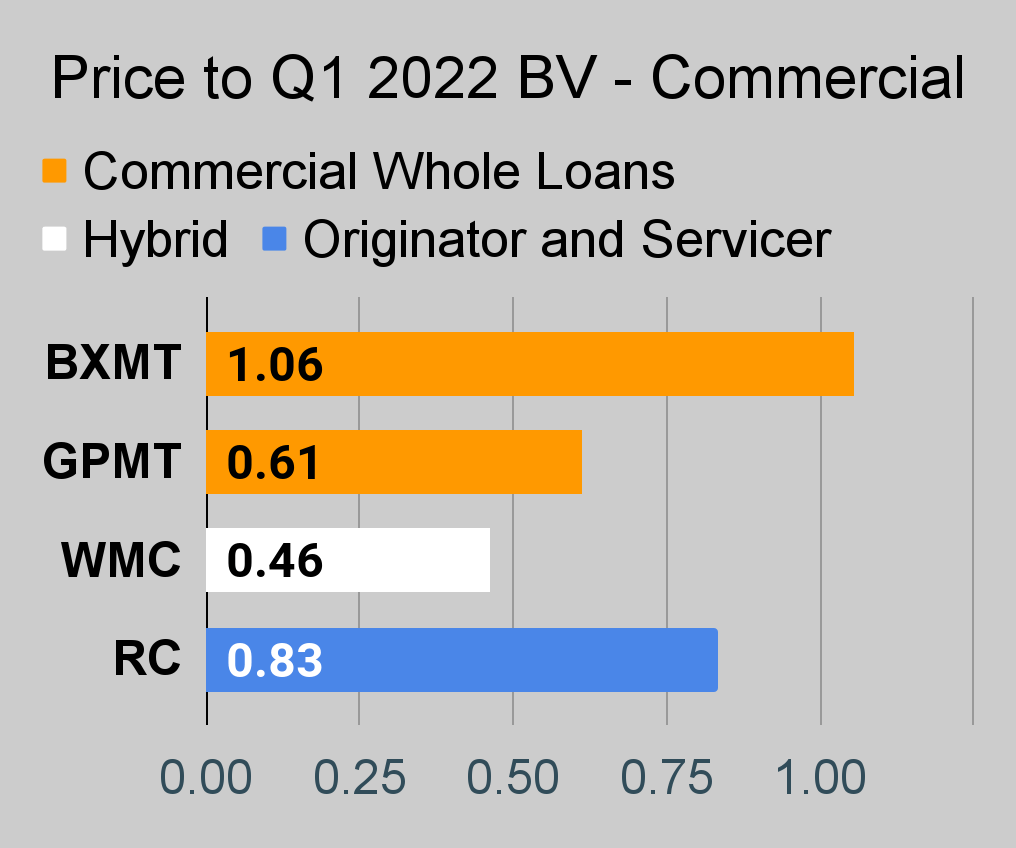
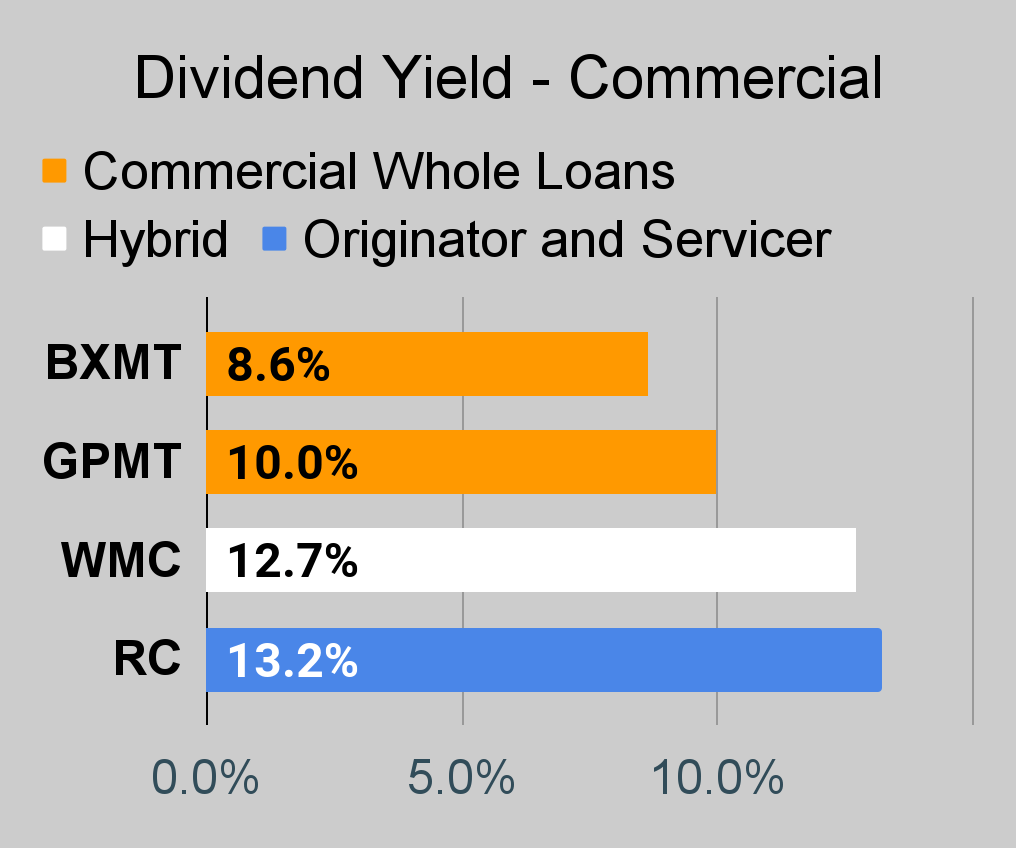
Commercial Mortgage REIT Charts
 The REIT Forum |
 The REIT Forum |
 The REIT Forum |
BDC Charts
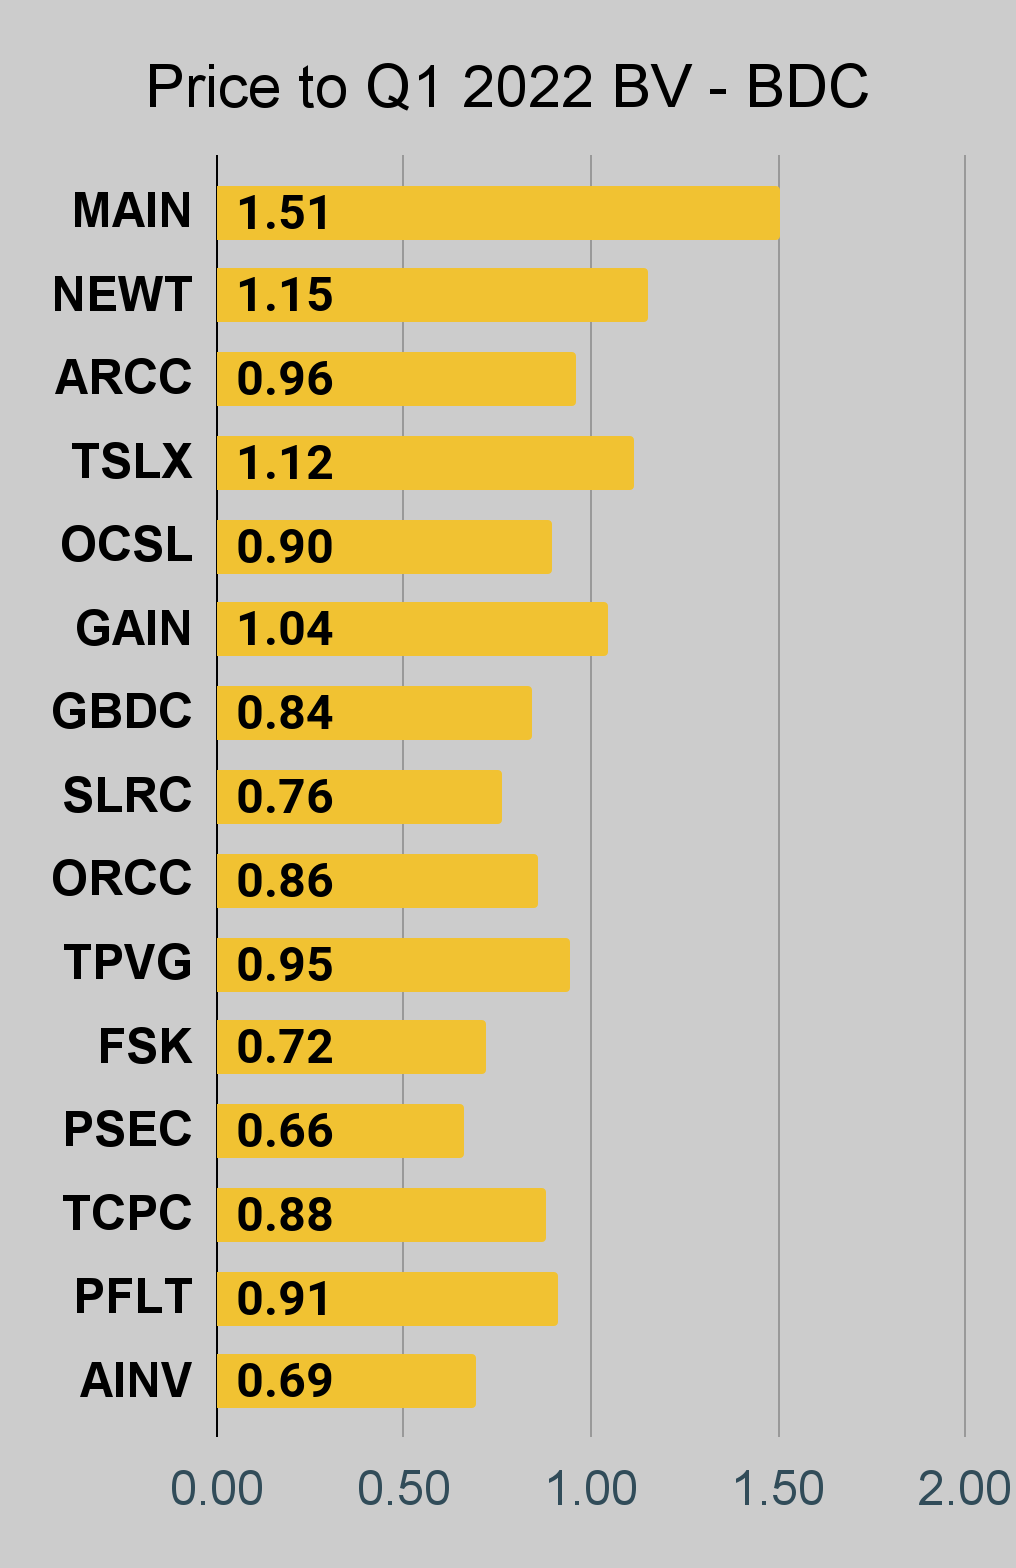 The REIT Forum |
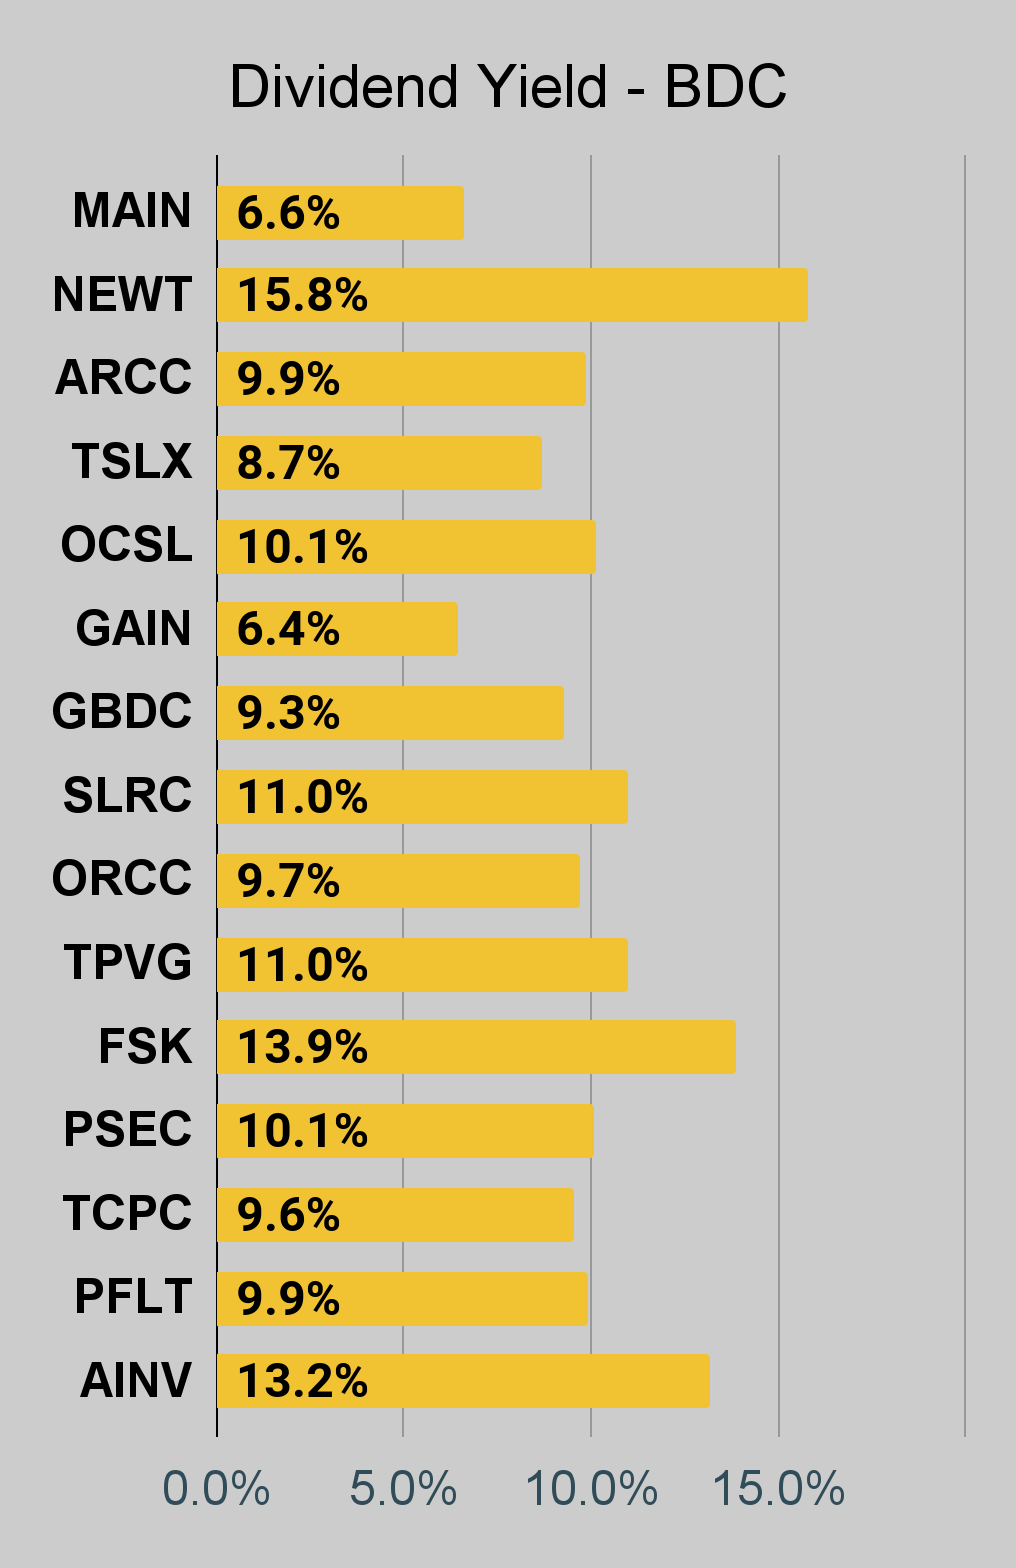 The REIT Forum |
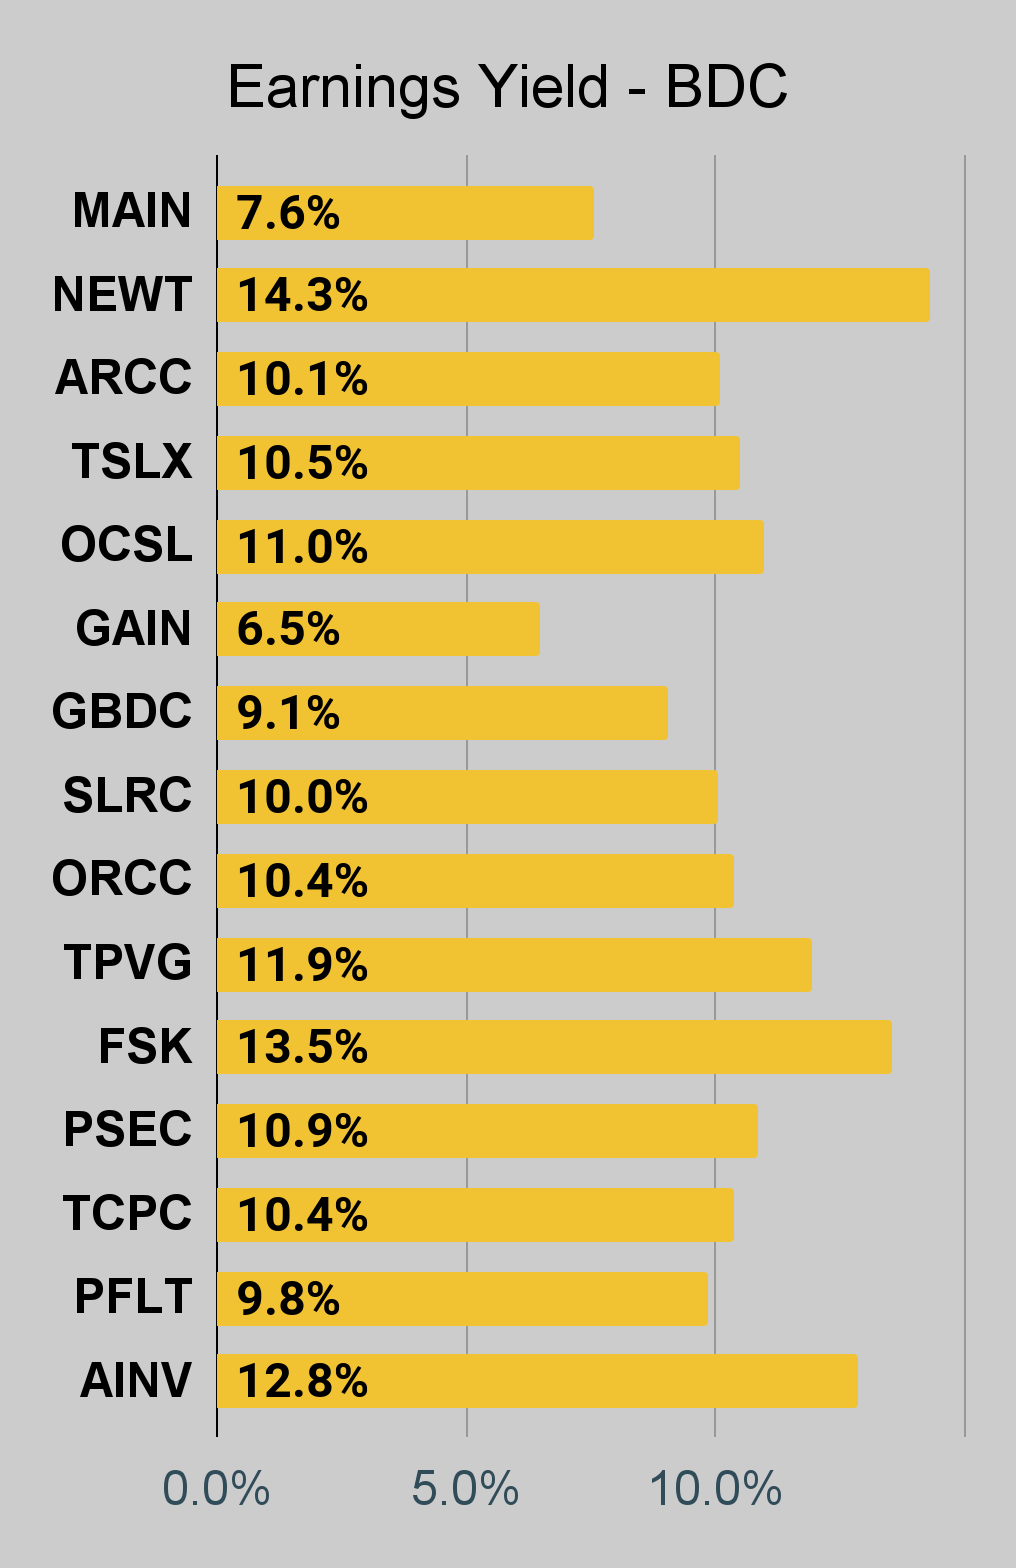 The REIT Forum |
Preferred Share Charts
 The REIT Forum |
 The REIT Forum |
 The REIT Forum |
 The REIT Forum |
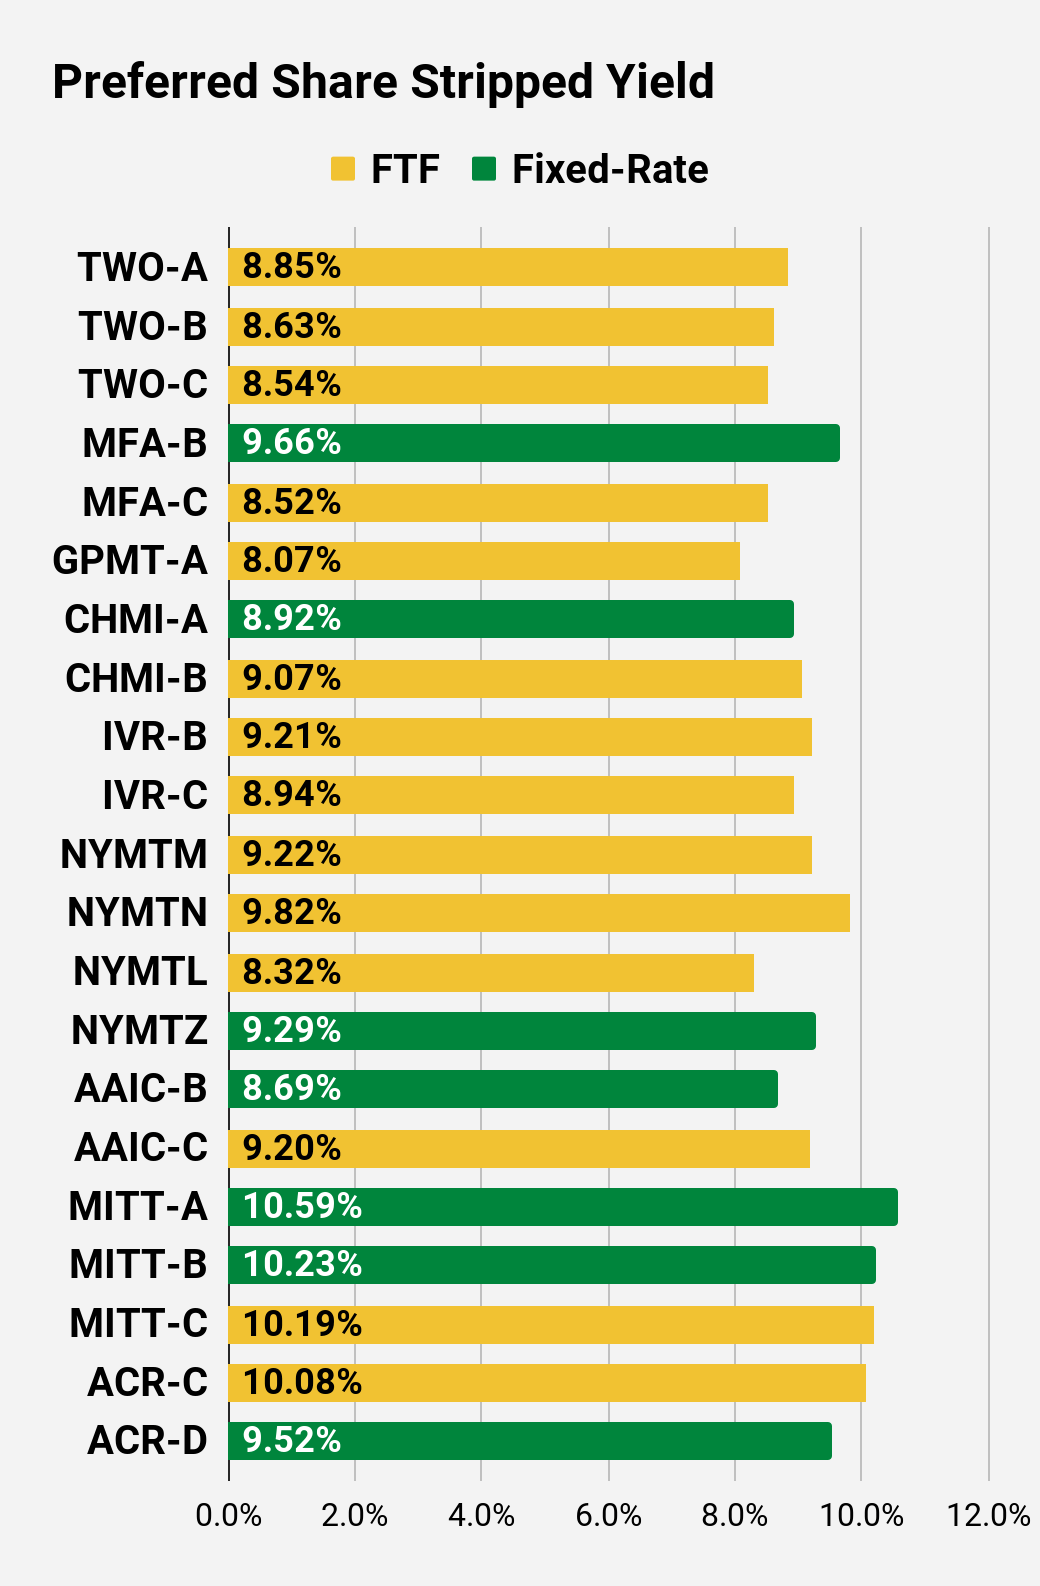 The REIT Forum |
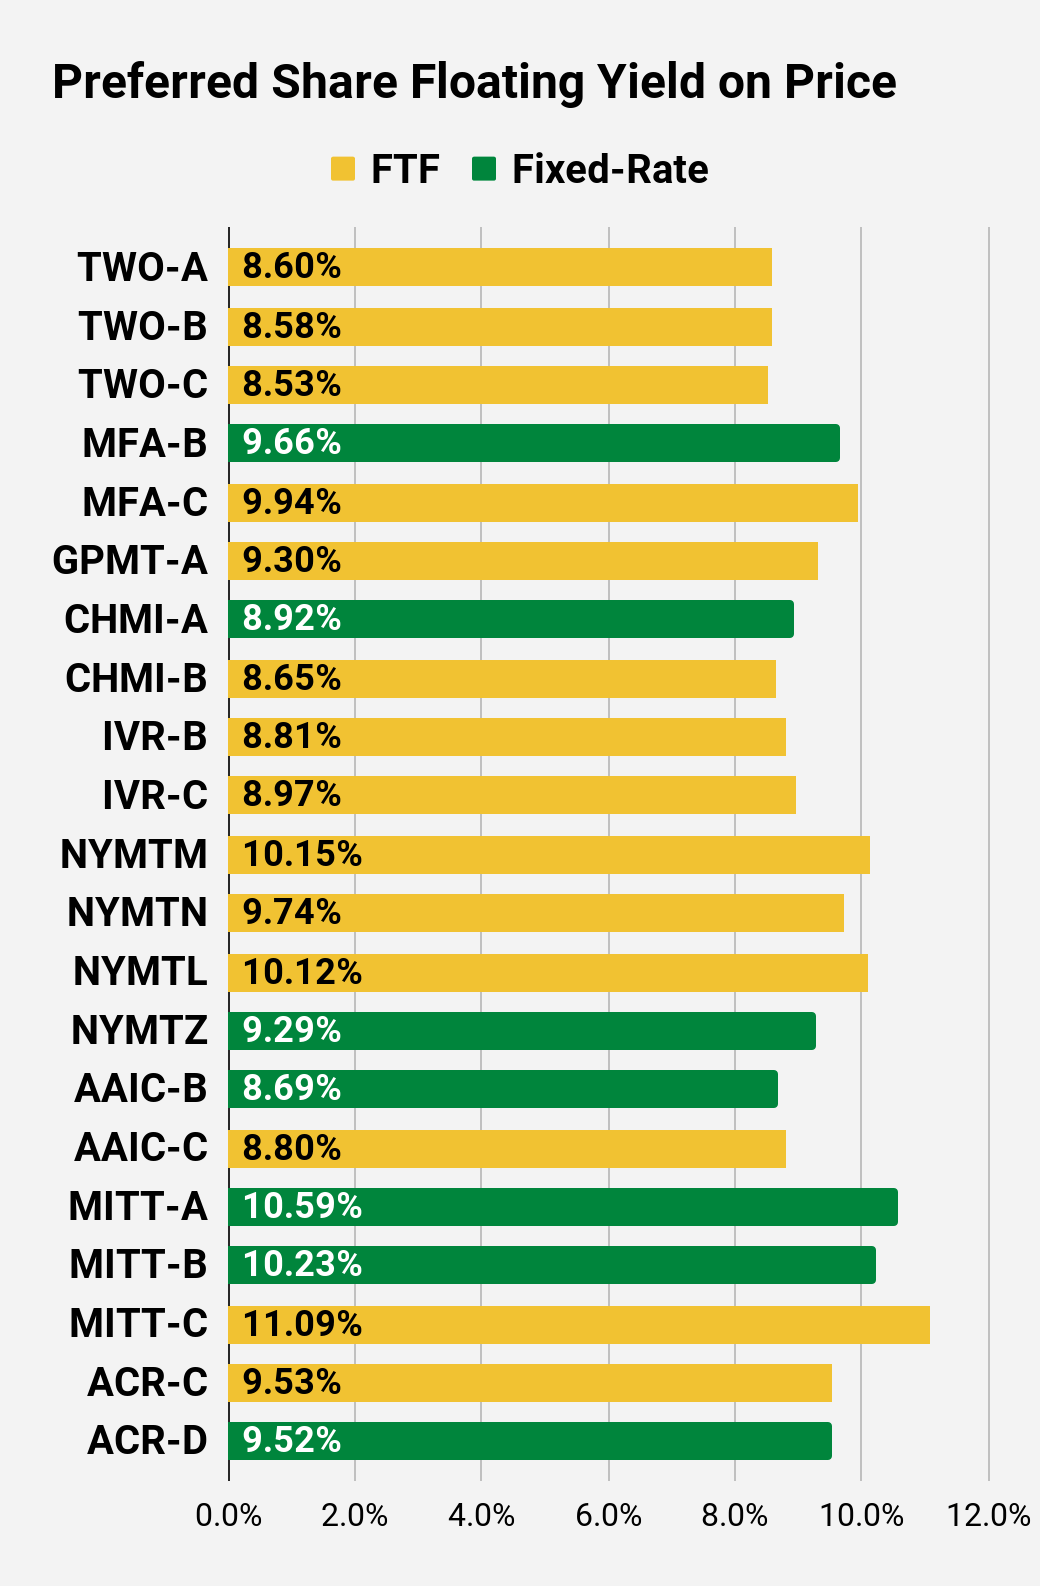 The REIT Forum |
Preferred Share Data
Beyond the charts, we’re also providing our readers with access to several other metrics for the preferred shares.
After testing out a series on preferred shares, we decided to try merging it into the series on common shares. After all, we are still talking about positions in mortgage REITs. We don’t have any desire to cover preferred shares without cumulative dividends, so any preferred shares you see in our column will have cumulative dividends. You can verify that by using Quantum Online. We’ve included the links in the table below.
To better organize the table, we needed to abbreviate column names as follows:
- Price = Recent Share Price – Shown in Charts
- BoF = Bond or FTF (Fixed-to-Floating)
- S-Yield = Stripped Yield – Shown in Charts
- Coupon = Initial Fixed-Rate Coupon
- FYoP = Floating Yield on Price – Shown in Charts
- NCD = Next Call Date (the soonest shares could be called)
- Note: For all FTF issues, the floating rate would start on NCD.
- WCC = Worst Cash to Call (lowest net cash return possible from a call)
- QO Link = Link to Quantum Online Page
Second Batch:
Strategy
Our goal is to maximize total returns. We achieve those most effectively by including “trading” strategies. We regularly trade positions in the mortgage REIT common shares and BDCs because:
- Prices are inefficient.
- Long-term, share prices generally revolve around book value.
- Short-term, price-to-book ratios can deviate materially.
- Book value isn’t the only step in analysis, but it is the cornerstone.
We also allocate to preferred shares and equity REITs. We encourage buy-and-hold investors to consider using more preferred shares and equity REITs.
Performance
We compare our performance against four ETFs that investors might use for exposure to our sectors:
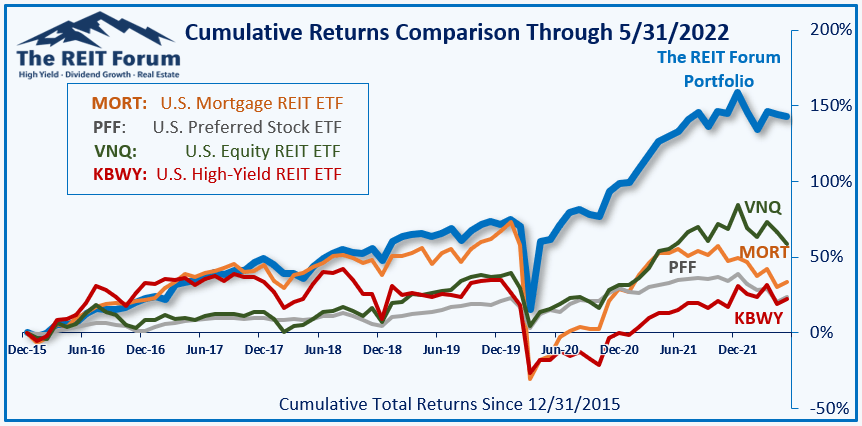
The REIT Forum
The four ETFs we use for comparison are:
|
Ticker |
Exposure |
|
One of the largest mortgage REIT ETFs |
|
|
One of the largest preferred share ETFs |
|
|
Largest equity REIT ETF |
|
|
The high-yield equity REIT ETF. Yes, it has been dreadful. |
When investors think it isn’t possible to earn solid returns in preferred shares or mortgage REITs, we politely disagree. The sector has plenty of opportunities, but investors still need to be wary of the risks. We can’t simply reach for yield and hope for the best. When it comes to common shares, we need to be even more vigilant to protect our principal by regularly watching prices and updating estimates for book value and price targets.
Ratings:
- Neutral on NEWT to close out our old rating
- Bullish on FSK, RC, and preferred share CIM-A
Be the first to comment