

Baris-Ozer
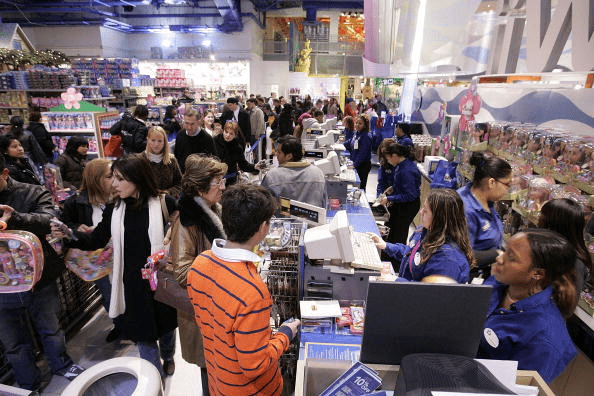
Most people love a bargain. Thanksgiving’s Black Friday deals are legendary for inspiring a bargain hunting mania among Americans.
Source: Getty
I don’t know about you, but this Thanksgiving, I plan to stay sane, and safe. I’m going to be enjoying the holiday with my family, not risking life and limb trying to score cheap TVs… 😉
But the one thing I will be doing is taking advantage of this bear market, which is creating the kind of Black Friday blue-chip deals I can get excited about.
When the market sells off aggressively, like it has so far this year, the opportunities it creates are legendary.
Charlie Bilello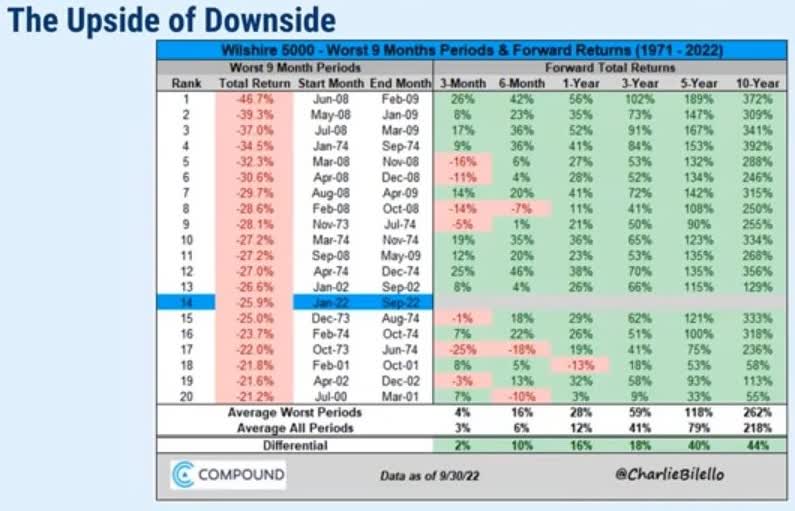
This is the 14th worst bear market since 1971, and that means potentially 3% higher annual returns in the coming decade.
That’s a nearly 4X historical return from blue-chip stocks!
What About The 2023 Recession?
Dividend Kings S&P Valuation Tool, NY Fed, CNBC
The bond market is now 100% certain (with very high conviction) that a recession is coming in 2023.
- Bloomberg’s model also says 100% risk of a recession
- Ned Davis Research 96%
- Conference Board 94%
- 85% of CEOs expect a mild and short recession in 2023
- 44% are still planning to hire more workers
- just 14% are planning to cut growth spending
(Source: David Rice)
Eighteen economic indicators point to a potential recession beginning in four to six months.
- March to May 2023
- April base-case
- agreeing with UBS and Goldman Sachs
But guess what? Even if you can time a recession perfectly, it still doesn’t mean you should try timing the market.
Charlie Bilello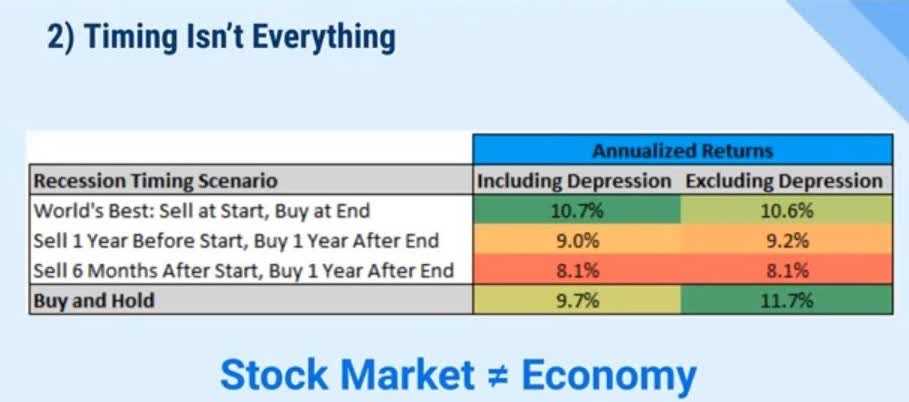
Outside of the Great Depression, perfect economic timing would have still lost to buy and hold investing. Why?
Bank of America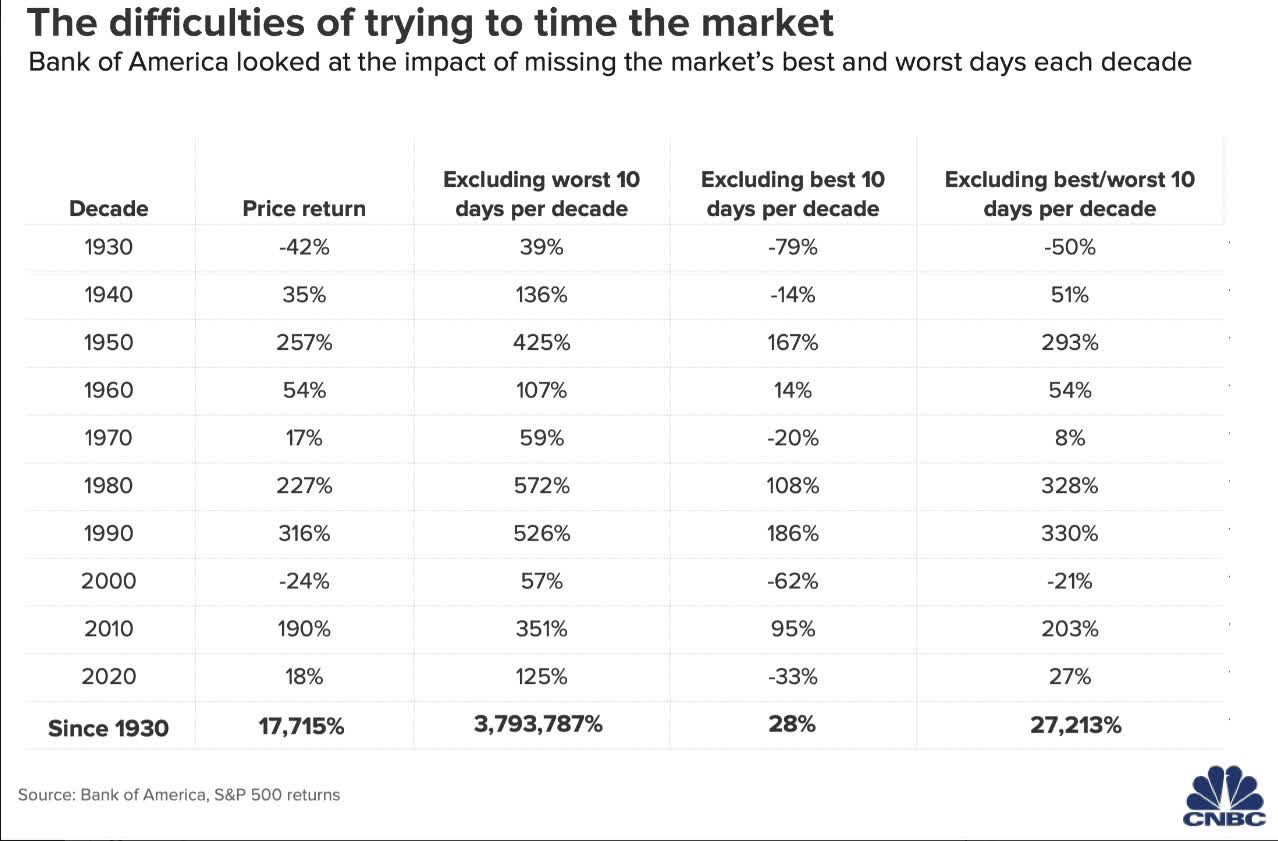
Because 99.84% of the market’s long-term gains come from just a handful of the single biggest daily rallies.
Rallies like this one.
Daily Shot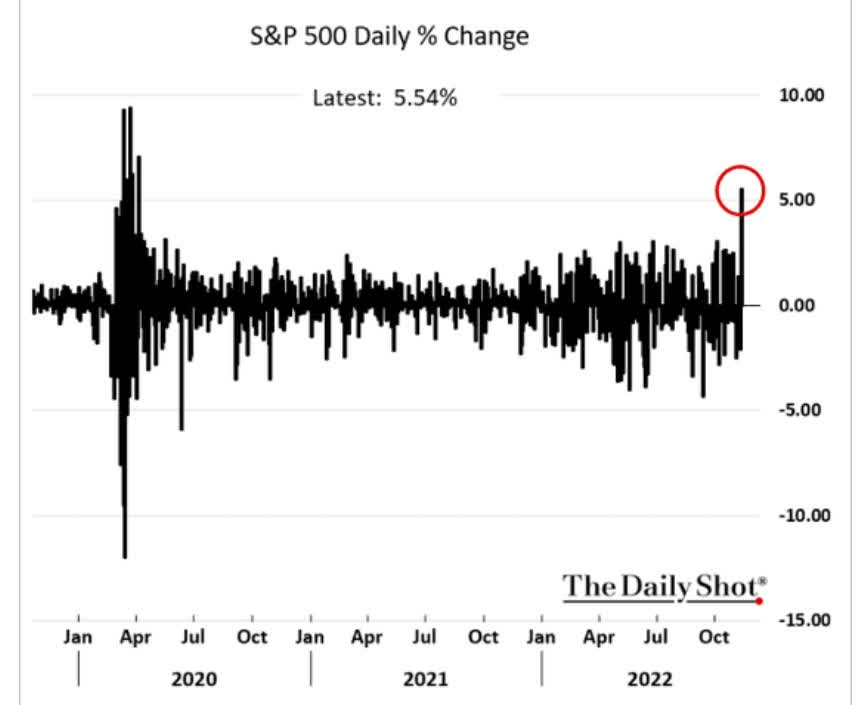
Remember the Nov. 10 rally after CPI came in not as terrible as expected? 7.7% inflation is still terrible. But the market doesn’t stop falling because bad news stops, just when it stops being as bad as feared.
If you missed that 5.5% rally in the S&P (7.4% in the Nasdaq, and 12% for Amazon) your returns will suffer in the future.
But guess what? It’s not too late to let the world’s best blue-chips help you achieve your retirement dreams.
Because the Black Friday blue-chip bargains I’m presenting today aren’t just great, they are dividend aristocrat deals, the world’s most dependable income investments.
How To Find The Best Dividend Aristocrat Black Friday Deals… In 1 Minute
Let me show you how to screen the Dividend Kings Zen Research Terminal, which runs of the DK 500 Master List, to easily find the best dividend aristocrat Black Friday deals.
The Dividend Kings 500 Master List includes some of the world’s best companies, including:
- every dividend champion (25+ year dividend growth streaks, including foreign aristocrats)
- every dividend aristocrat
- every dividend king (50+ year dividend growth streaks)
- every Ultra SWAN (as close to perfect quality companies as exist)
- the 20% highest quality REITs according to iREIT
- 40 of the world’s best growth blue-chips
| Step | Screening Criteria | Companies Remaining | % Of Master List |
| 1 | Reasonable Buy, Good Buy, Strong Buy, Very Strong Buy, Ultra Value Buy (Never Overpay For Stocks) | 353 | 70.60% |
| 2 | 10+ Quality (Blue-Chip Or Better) | 309 | 61.80% |
| 3 | “Dividend Champions” List (all companies with 25+ year dividend growth streaks) | 66 | 13.20% |
| 4 | 11+% long-term total return potential (equal to the dividend aristocrat consensus) | 20 | 4.00% |
| 5 | 2+% Yield | 11 | 2.2% |
| Total Time | 1 minute |
So here they are the 11 best Dividend Aristocrat Black Friday deals you can safely buy today.
The 11 Best Dividend Aristocrat Black Friday Deals
I’ve linked to articles exploring each company’s investment thesis, growth outlook, and risk profile.
(Source: Dividend Kings Zen Research Terminal)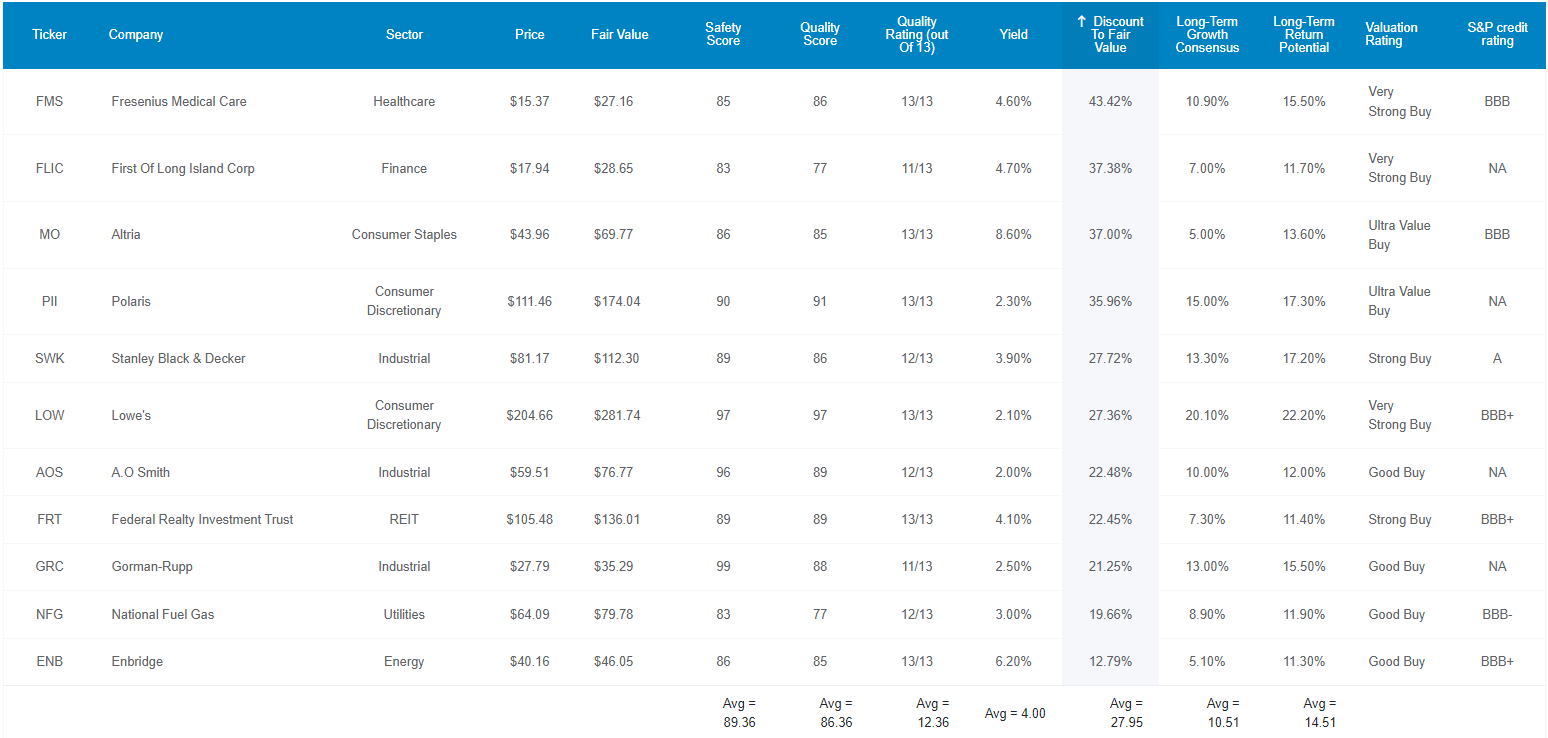
Here they are in order of most to least undervalued.
- Fresenius Medical Care (FMS)
- First of Long Island Corp (FLIC)
- Altria (MO)
- Polaris (PII)
- Stanley Black & Decker (SWK)
- Lowe’s (LOW)
- A.O. Smith (AOS)
- Federal Realty Investment Trust (FRT)
- Gorman-Rupp (GRC)
- National Fuel Gas (NFG)
- Enbridge (ENB)
Tax Implications
- ENB is a Canadian company
- 15% dividend tax withholding in taxable accounts only
- no withholding in retirement accounts
- tax credit available for taxable accounts to recoup the withholding
- own in retirement accounts to minimize the tax credit paperwork
- FMS is a German company
- 23.375% dividend tax withholding
- own in taxable accounts to qualify for the tax credit to recoup the withholding
FAST Graphs Up Front
Fresenius Medical 2024 Consensus Return Potential
(Source: FAST Graphs, FactSet)
First Of Long Island 2024 Consensus Return Potential
(Source: FAST Graphs, FactSet)
Altria 2024 Consensus Return Potential
(Source: FAST Graphs, FactSet)
Polaris Consensus Return Potential
(Source: FAST Graphs, FactSet)
Stanley Black & Decker 2024 Consensus Return Potential
(Source: FAST Graphs, FactSet)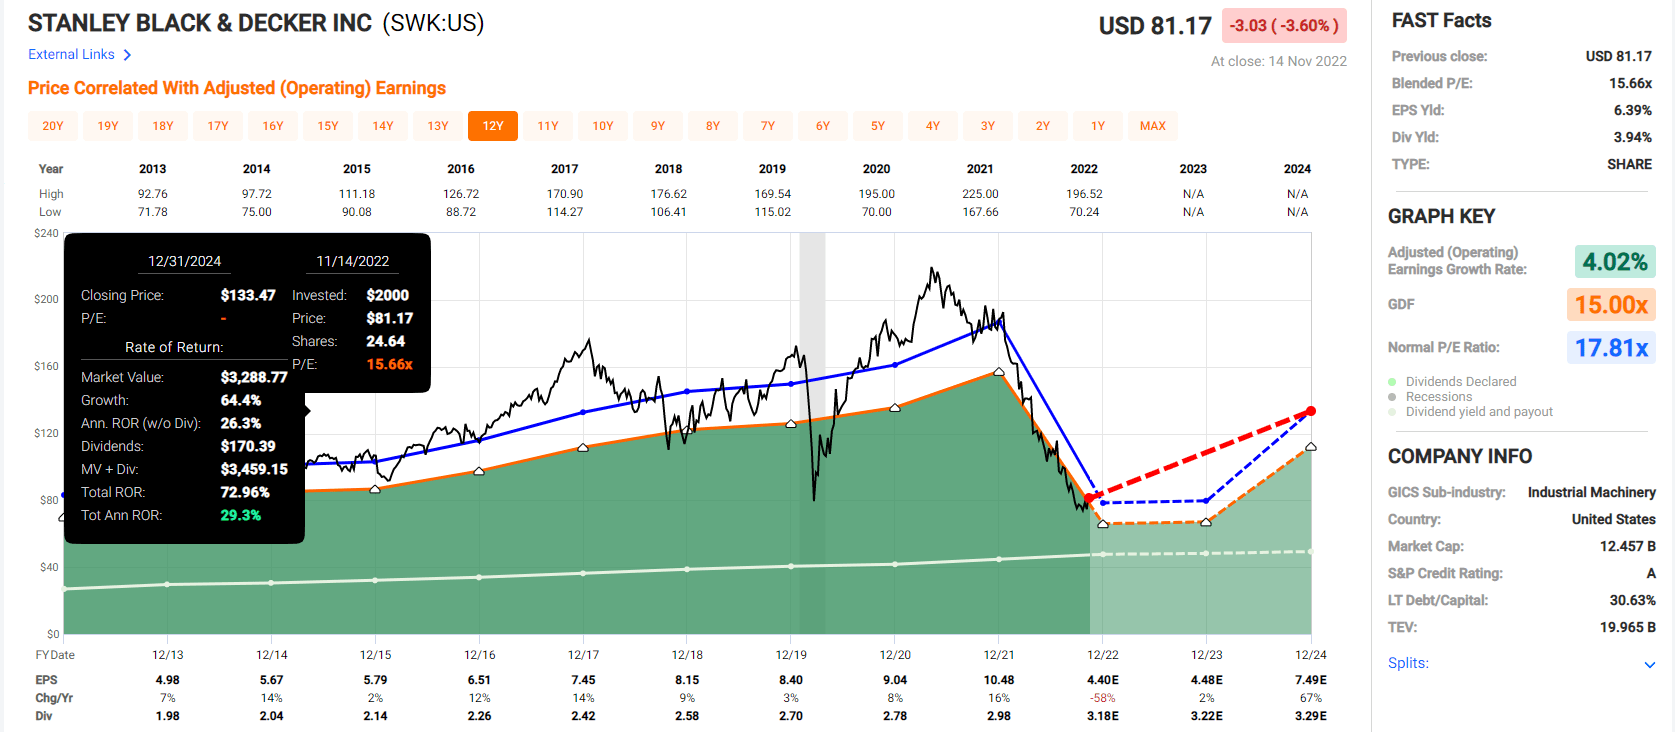
Lowe’s 2025 Consensus Return Potential
(Source: FAST Graphs, FactSet)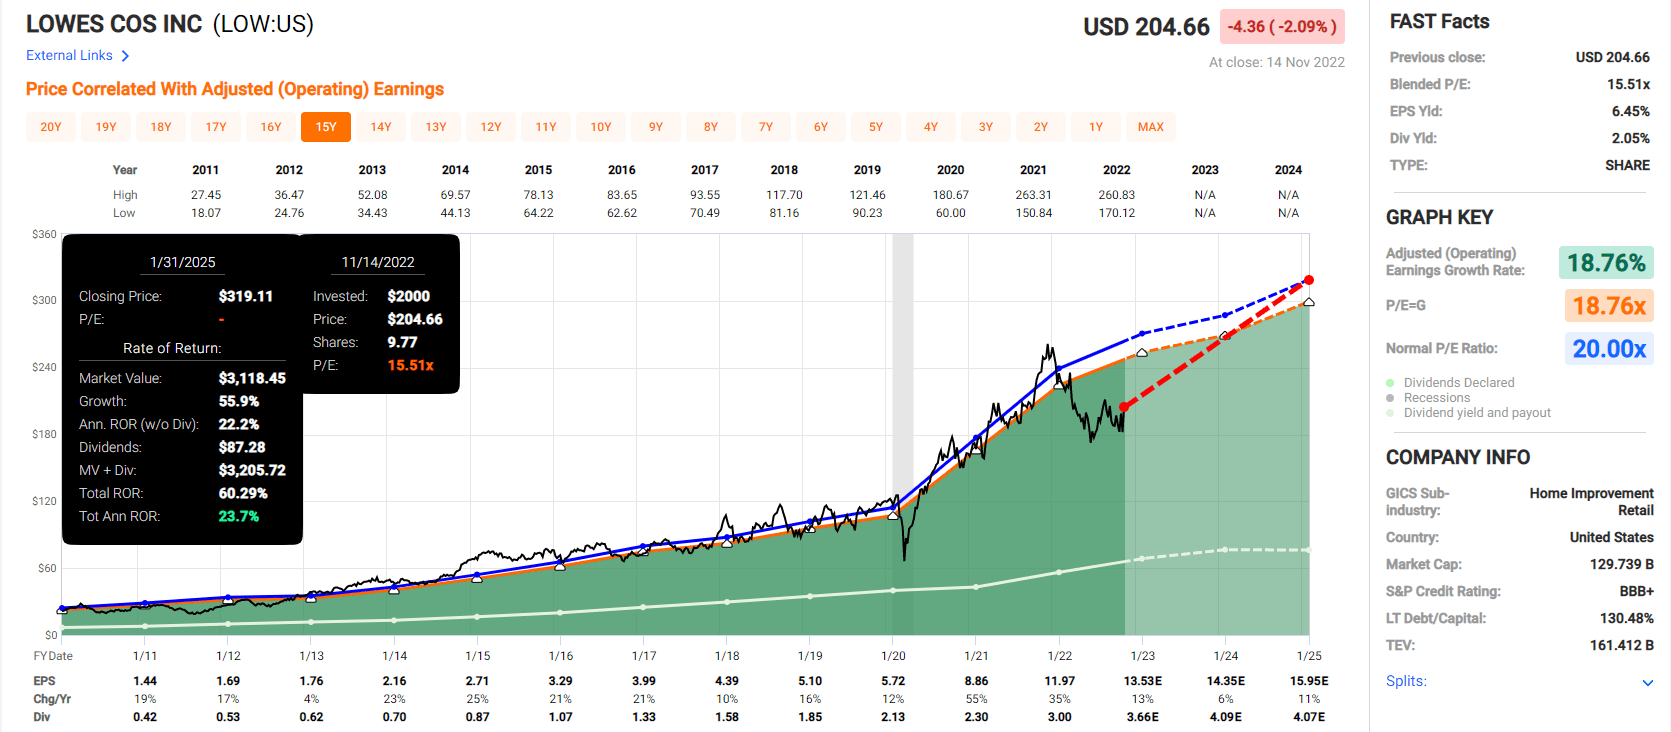
Federal Realty 2024 Consensus Return Potential
(Source: FAST Graphs, FactSet)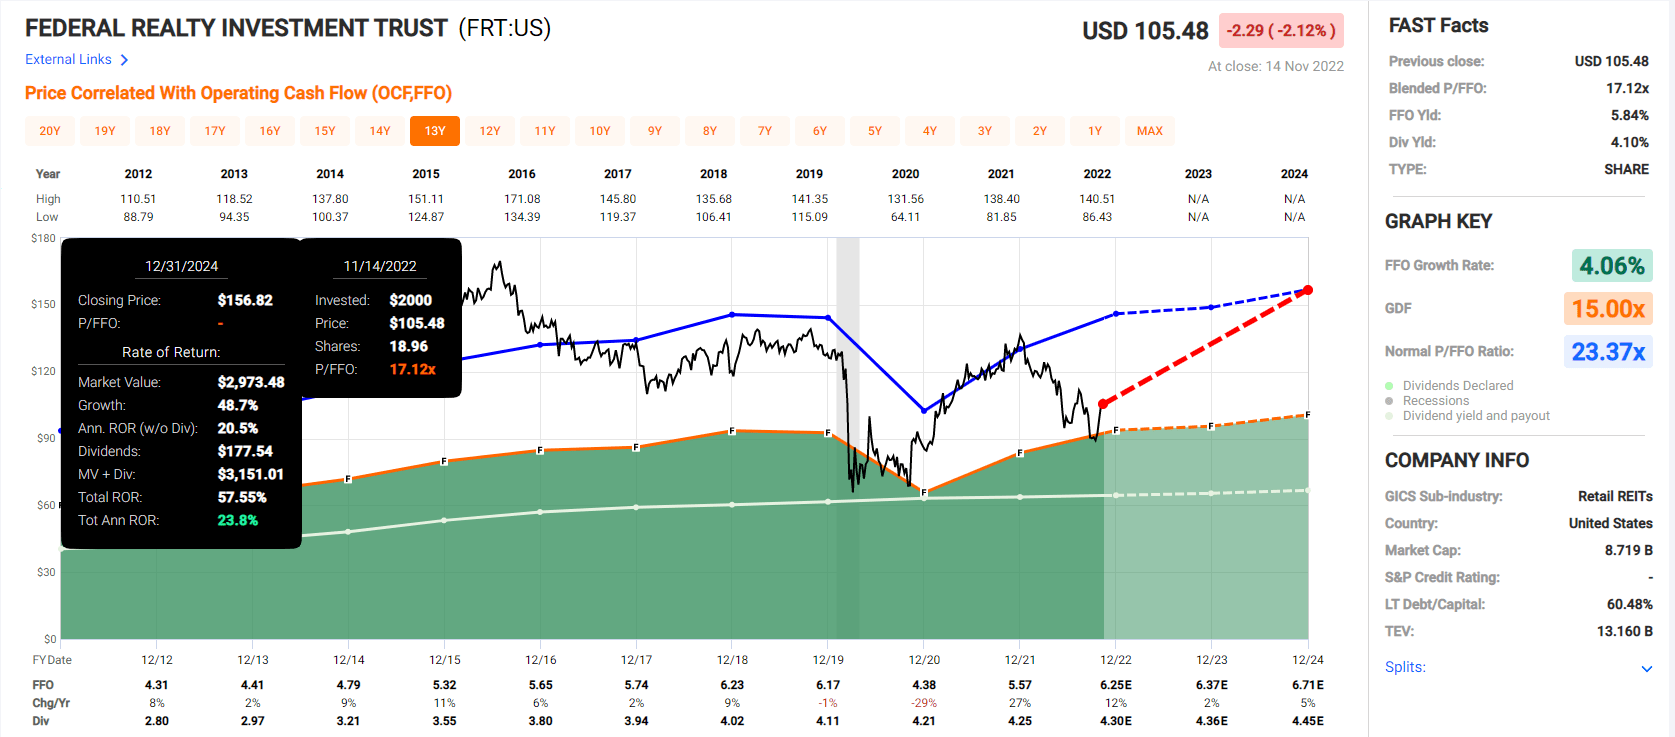
A.O. Smith 2024 Consensus Return Potential
(Source: FAST Graphs, FactSet)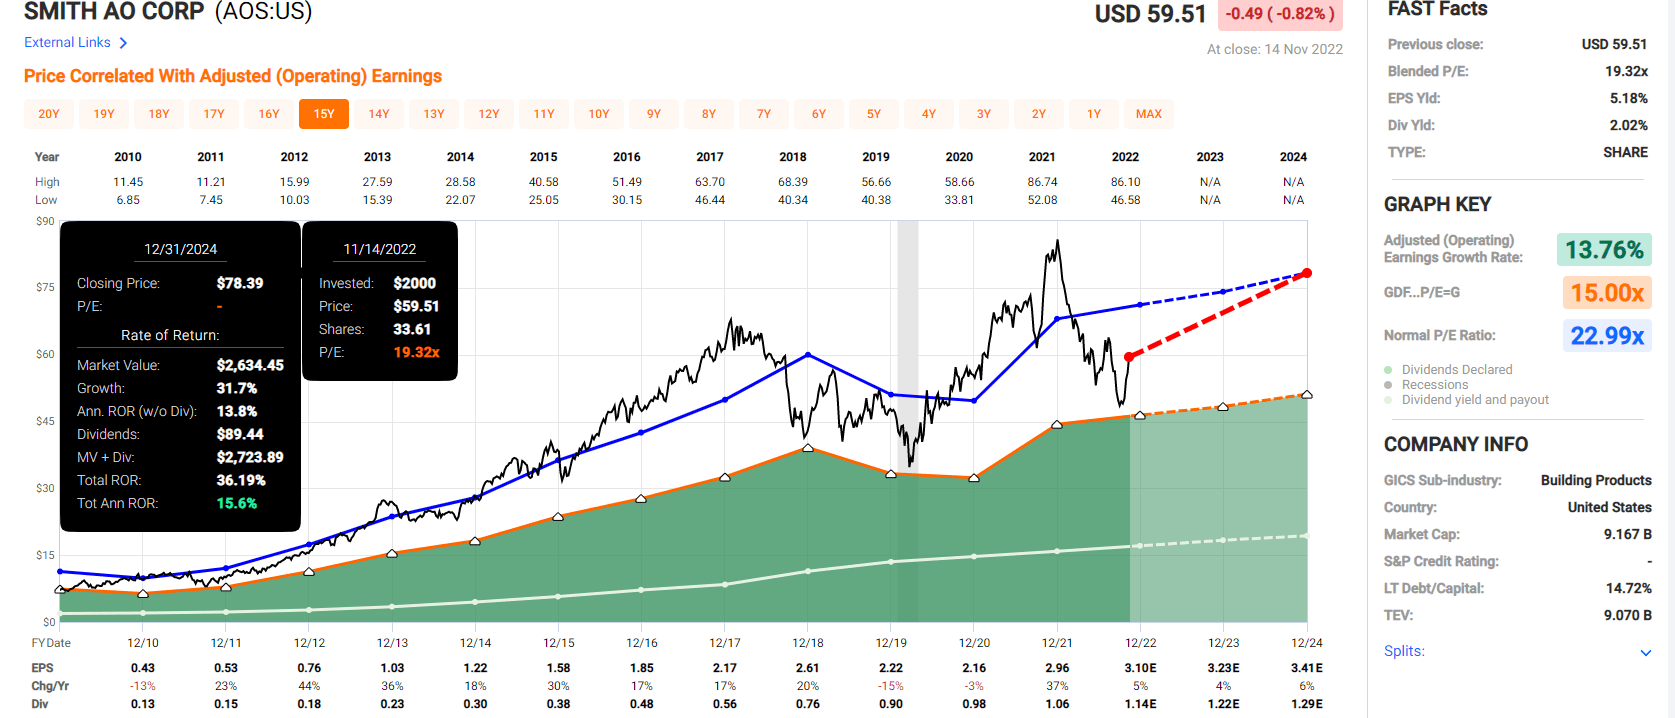
Gorman-Rupp 2024 Consensus Return Potential
(Source: FAST Graphs, FactSet)
National Fuel Gas 2024 Consensus Return Potential
(Source: FAST Graphs, FactSet)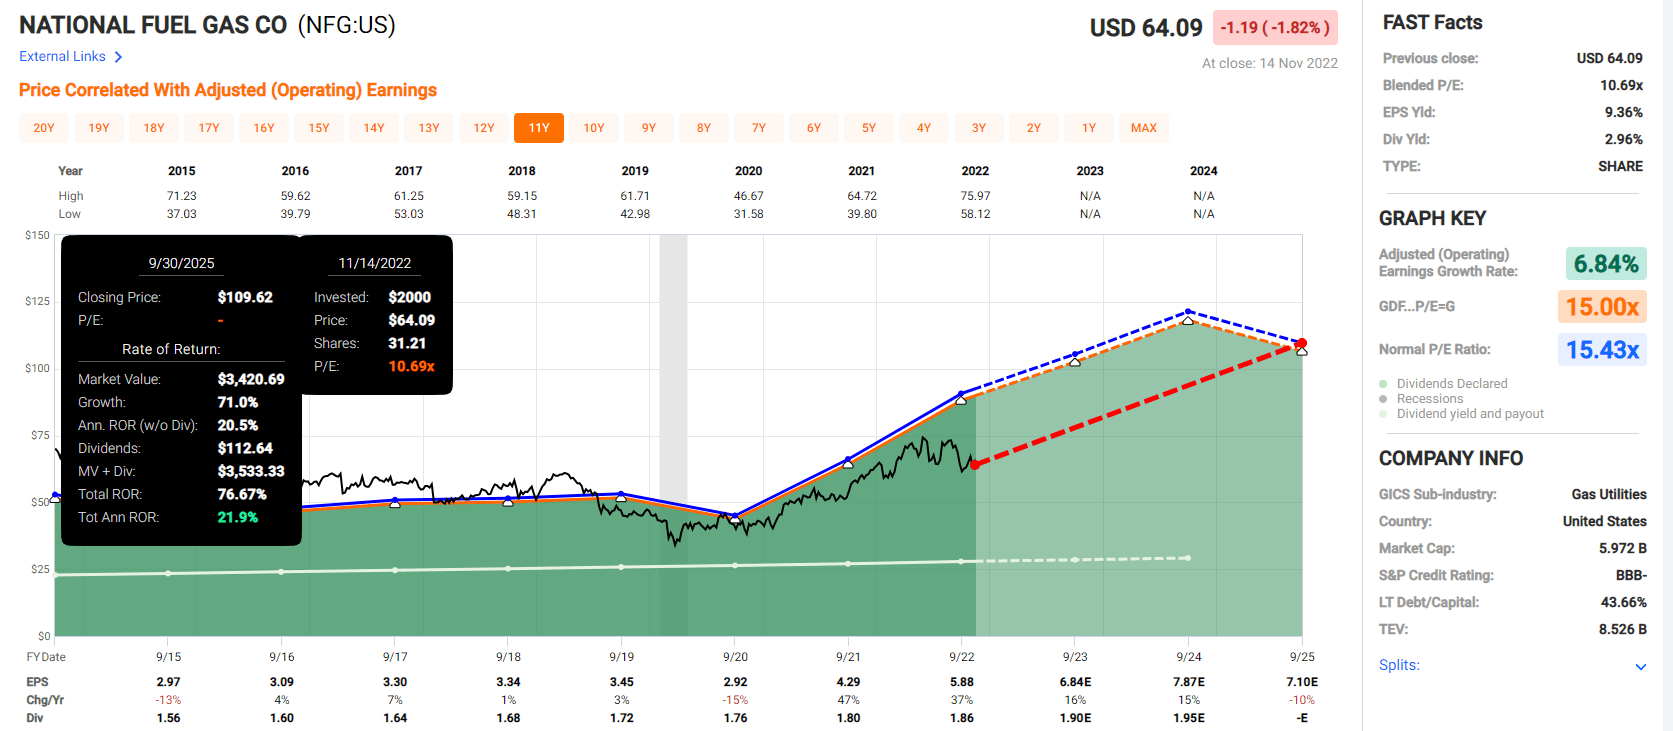
Enbridge 2024 Consensus Return Potential
(Source: FAST Graphs, FactSet)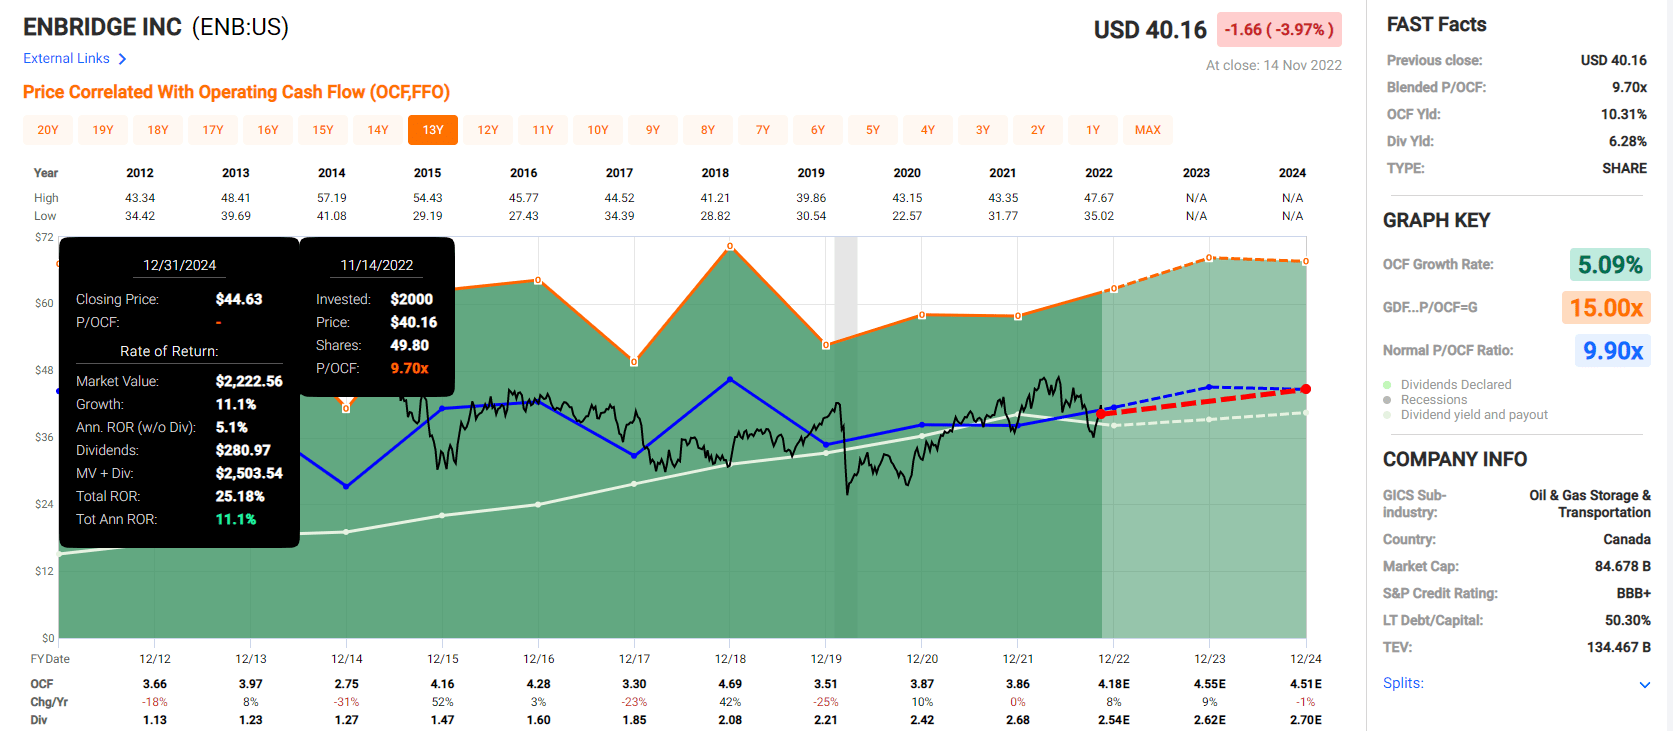
- average 2024 annual total return consensus: 25.4% CAGR
- average 2024 consensus total return: 61%
Now compare that to the S&P 500.
S&P 500 2024 Consensus Return Potential
(Source: FAST Graphs, FactSet)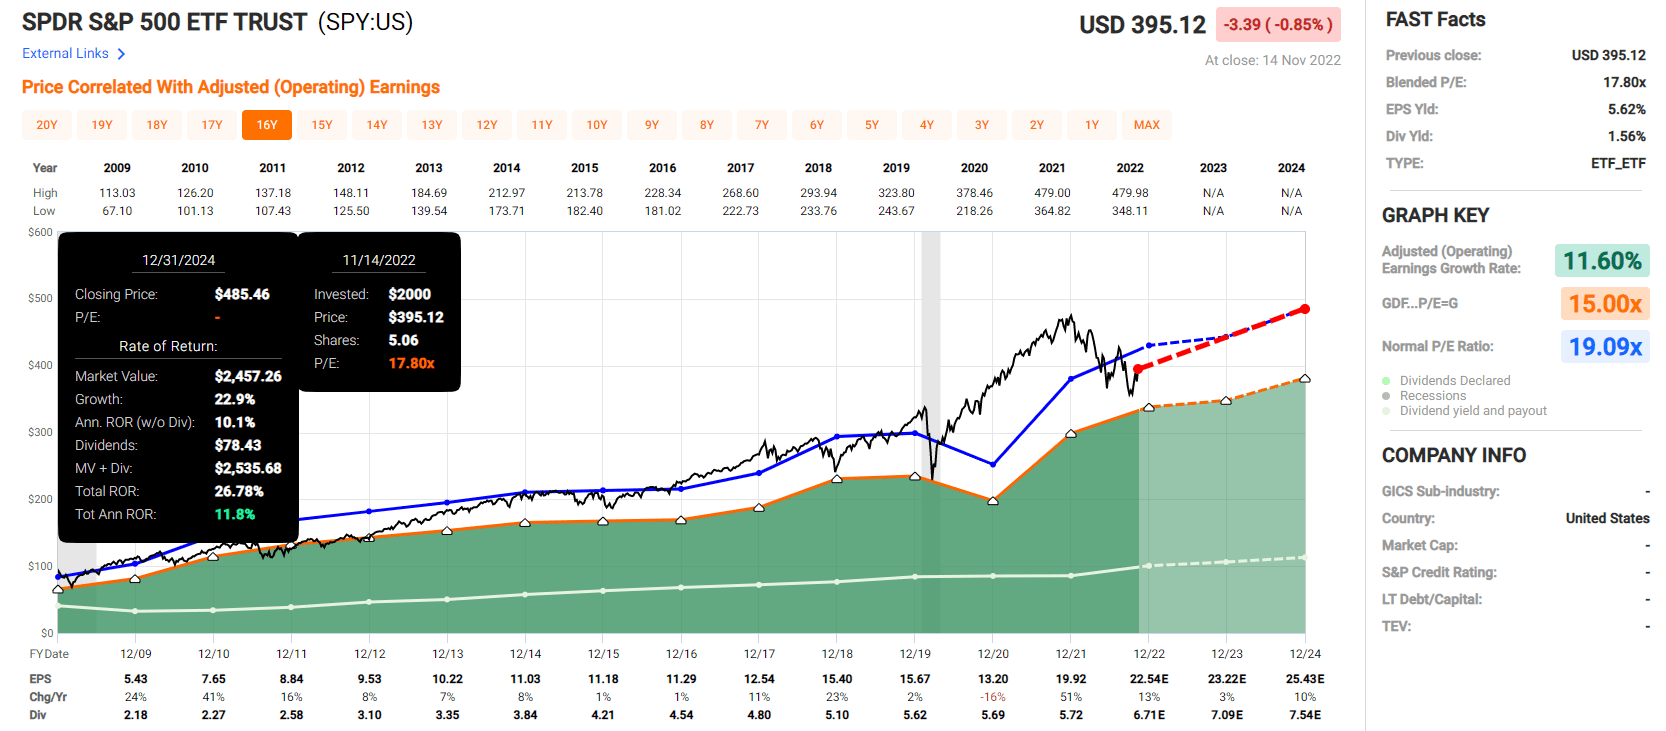
Analysts expect the S&P to potentially deliver 27% total returns or 12% annually over the next two years.
- the Black Friday aristocrats offer more than 2X better return potential than the market
My goal isn’t to try to help you earn 25% in a year, or 61% over two years. These Black Friday aristocrat bargains are truly “buy and hold forever” investments, and here’s why.
Some Of The World’s Highest Quality Blue-Chip Bargains
(Source: Dividend Kings Zen Research Terminal)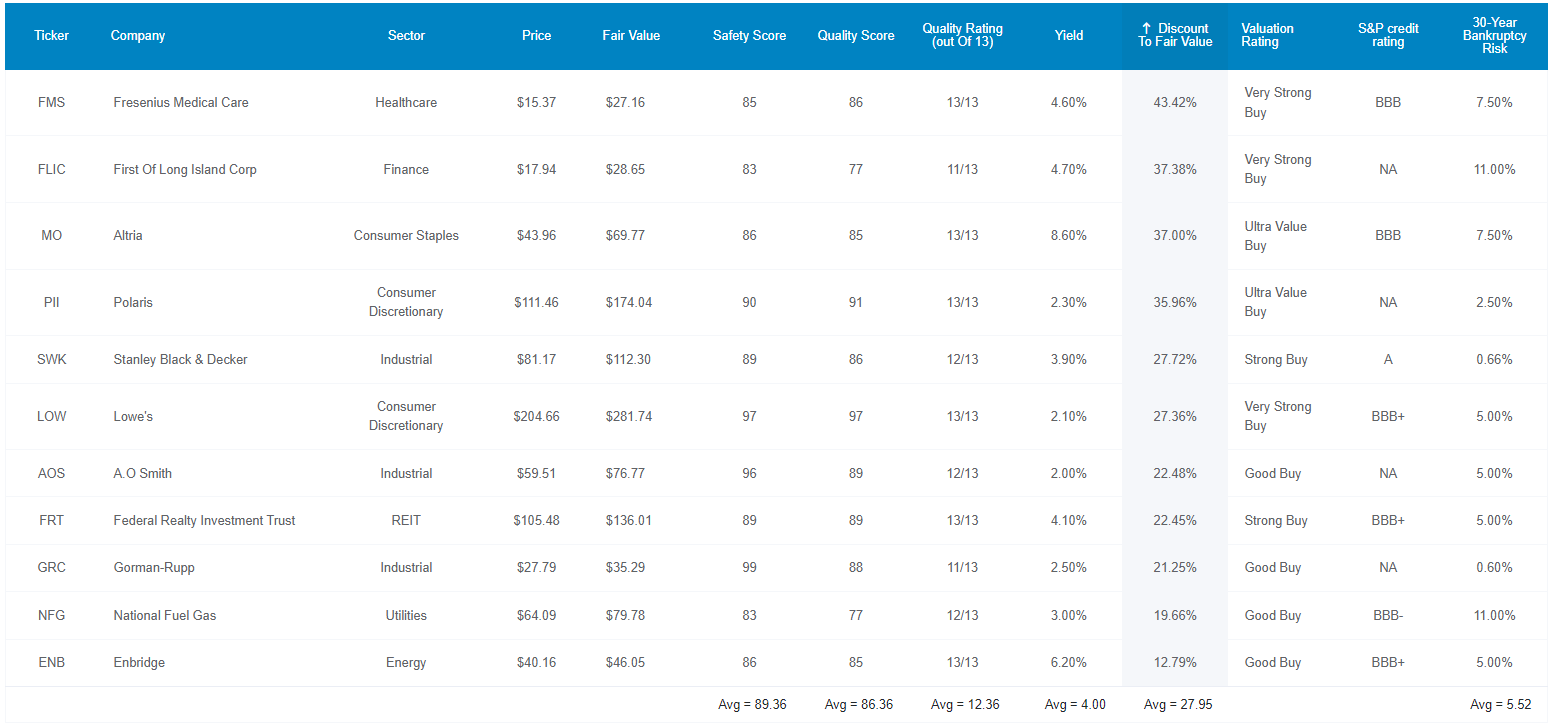
These aren’t just blue chips or aristocrats, they are 12.4/13 Super SWAN aristocrats. What does that mean? Let’s compare their fundamentals to the dividend aristocrats.
Fundamentals 8% Better Than The Dividend Aristocrats
| Metric | Dividend Aristocrats | 11 Black Friday Dividend Aristocrat Deals |
Compared To Aristocrats |
| Quality | 87% | 86% | 99% |
| Safety | 90% | 89% | 99% |
| Average Recession Dividend Cut Risk | 0.5% | 0.5% | 100% |
| Severe Recession Dividend Cut Risk | 1.50% | 1.55% | 103% |
| Dependability | 84% | 84% | 100% |
| Dividend Growth Streak (Years) | 44.8 | 42.0 | 94% |
| Long-Term Risk Management Industry Percentile | 67% Above-Average, Low Risk | 59%, Average, Medium-Risk | 88%% |
| Average Credit Rating | A- Stable | BBB+ Stable | NA |
| Average Bankruptcy Risk | 3.04% | 5.52% | 182% |
| Average Return On Capital | 105% | 105% | 100% |
| Average ROC Industry Percentile | 83% | 82% | 99% |
| 13-Year Median ROC | 89% | 99% | 111% |
| Forward PE | 20.4 | 14.4 | 71% |
| Discount To Fair Value | 0% | 28% | NA |
| DK Rating | Reasonable Buy | Very Strong Buy | NA |
| Yield | 2.5% | 4.0% | 160% |
| LT Growth Consensus | 8.5% | 10.7% | 126% |
| Total Return Potential | 11.0% | 14.7% | 134% |
| Risk-Adjusted Expected Return | 7.5% | 9.8% | 131% |
| Inflation & Risk-Adjusted Expected Return | 5.2% | 7.6% | 145% |
| Conservative Years To Double | 13.7 | 9.5 | 69% |
| Average | 108% |
(Source: Dividend Kings Zen Research Terminal)
Their average risk of a dividend cut in a historical recession since WWII is approximately 0.5%.
Their average cut risk in a Pandemic/Great Recession level downturn is approximately 1.55%.
Ben Graham considered 20-year streaks without a dividend cut an important sign of quality. A 20+ year dividend growth streak is the Graham standard of excellence.
These Black Friday aristocrats deals have an average dividend growth streak of 42 years, more than 2X the Graham standard of excellence.
Joel Greenblatt considers return on capital or ROC his gold standard proxy for quality and moatiness.
- Using ROC and cash-adjusted PEs Greenblatt achieved 40% CAGR returns for 21 years
- one of the greatest investors in history
ROC = annual pre-tax profit/the cost of running the business and the S&P 500’s is 14.6%.
The aristocrats delivered 105% over the past year and these Black Friday aristocrats also 105%.
That’s in the 82nd percentile for their respective industries, a wide moat according to Joel Greenblatt.
- and 6X better than the S&P 500
Their 13-year median ROC is 99%, indicating wide and stable or even improving moats.
S&P estimates their average 30-year bankruptcy risk (fundamental risk of going to zero) at 5.5%, a BBB+ stable credit rating.
And S&P also estimates their long-term risk management is in the 59th global percentile.
DK uses S&P Global’s global long-term risk-management ratings for our risk rating.
- S&P has spent over 20 years perfecting their risk model
- which is based on over 30 major risk categories, over 130 subcategories, and 1,000 individual metrics
- 50% of metrics are industry specific
- this risk rating has been included in every credit rating for decades
The DK risk rating is based on the global percentile of how a company’s risk management compares to 8,000 S&P-rated companies covering 90% of the world’s market cap.
Black Friday Dividend Aristocrats Score 59th Percentile On Global Long-Term Risk Management
S&P’s risk management scores factor in things like:
- supply chain management
- crisis management
- cyber-security
- privacy protection
- efficiency
- R&D efficiency
- innovation management
- labor relations
- talent retention
- worker training/skills improvement
- customer relationship management
- climate strategy adaptation
- corporate governance
- brand management
Black Friday Aristocrat’s Long-Term Risk Management Is The 266nd Best In The Master List (47 Percentile In The Master List)
| Classification | S&P LT Risk-Management Global Percentile |
Risk-Management Interpretation |
Risk-Management Rating |
| BTI, ILMN, SIEGY, SPGI, WM, CI, CSCO, WMB, SAP, CL | 100 | Exceptional (Top 80 companies in the world) | Very Low Risk |
| Strong ESG Stocks | 86 |
Very Good |
Very Low Risk |
| Foreign Dividend Stocks | 77 |
Good, Bordering On Very Good |
Low Risk |
| Ultra SWANs | 74 | Good | Low Risk |
| Dividend Aristocrats | 67 | Above-Average (Bordering On Good) | Low Risk |
| Low Volatility Stocks | 65 | Above-Average | Low Risk |
| Master List average | 61 | Above-Average | Low Risk |
| Dividend Kings | 60 | Above-Average | Low Risk |
| Black Friday Aristocrat Deals | 59 | Average, Bordering On Above-Average | Medium Risk |
| Hyper-Growth stocks | 59 | Average, Bordering On Above-Average | Medium Risk |
| Dividend Champions | 55 | Average | Medium Risk |
| Monthly Dividend Stocks | 41 | Average | Medium Risk |
(Source: DK Research Terminal)
Their risk-management consensus is in the bottom 43% of the world’s highest quality companies and similar to that of such other blue chips as
- Coca-Cola (KO): Ultra SWAN dividend king
- C.H. Robinson Worldwide (CHRW) Ultra SWAN dividend aristocrat
- Norfolk Southern (NSC) Ultra SWAN
- Amazon (AMZN): Ultra SWAN
- Pepsi (PEP): Super SWAN dividend king
OK, so now that you know why these are some of the most dependable and safest aristocrat bargains on Wall Street, here’s why you might want to buy some of them today.
Wonderful Companies At Wonderful Prices
(Source: Dividend Kings Zen Research Terminal)
For context:
- S&P 500 17.6X forward earnings: 4% historically overvalued
- Dividend Aristocrats: 20.5X forward earnings = historical fair value
These Black Friday aristocrat deals, which according to Joel Greenblatt are 6X higher quality than the S&P and match the aristocrats, are trading at 14.4X forward earnings, a 28% historical discount to their usual 20X PE.
Analysts expect them to deliver 17% total returns within the next year but they are so undervalued their 12-month fundamentally justified total return potential is 45%.
- if they grow as expected in the next 12 months and return to mid-range historical market-determined fair value you will make 45%
But my goal isn’t to help you earn 17% in a year, or even 45% in 12 months, or 61% in two years.
I’m trying to help you potentially achieve life-changing 61X returns over 30 years, the retirement time frame.
Aristocrat Bargains That Can Help You Retire In Safety And Splendor
(Source: Dividend Kings Zen Research Terminal)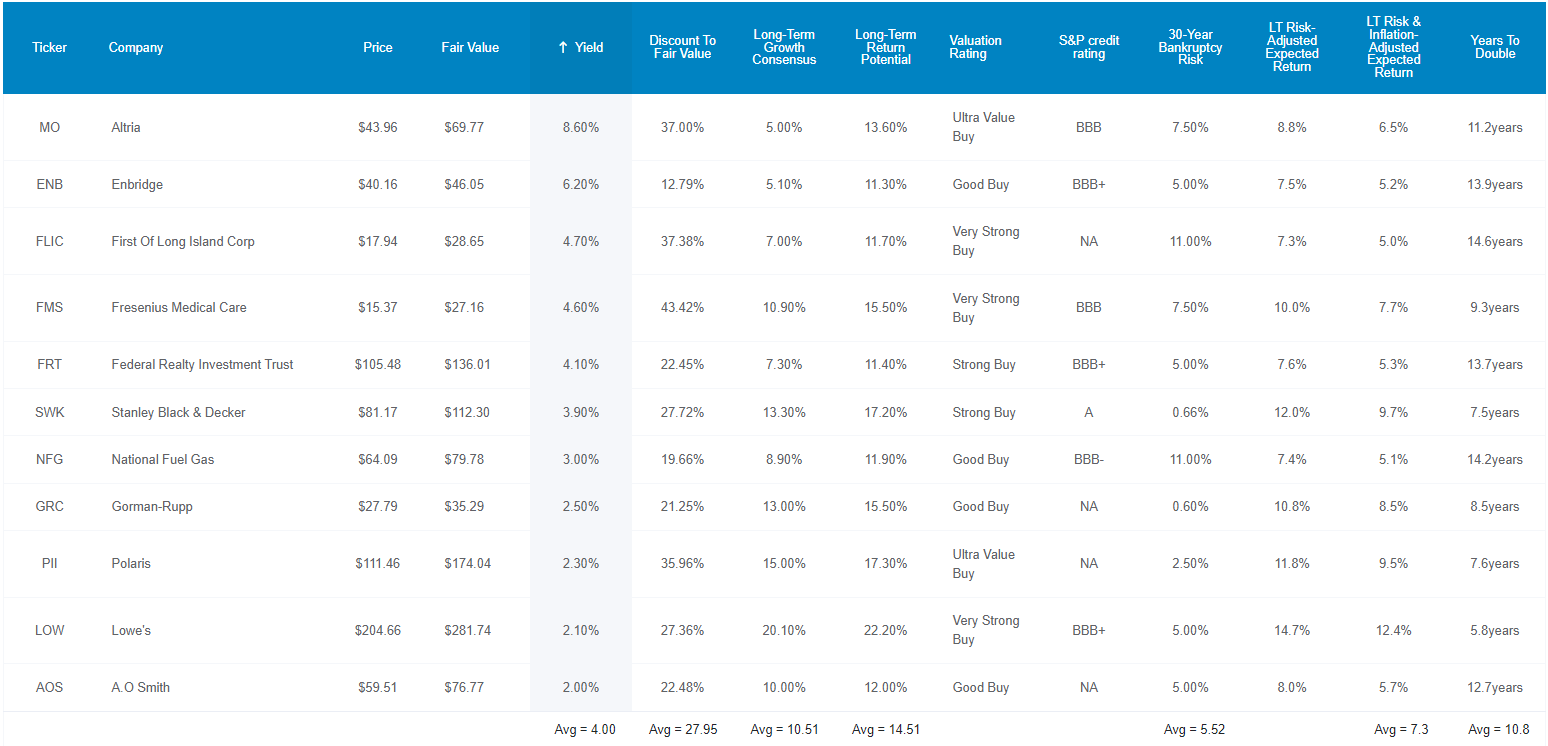
These Black Friday aristocrat deals offer one of the safest 4.0% yields on earth, backed up by a BBB+ stable credit rating, and 42 year dividend growth streak.
And they’re also growing 10.7% CAGR, much faster than the S&P 500’s and aristocrats 8.5%.
That means 14.7% CAGR long-term return potential, from deep value aristocrat bargains paying a yield that’s 2.5X higher than the broader market (and almost 2X higher than the aristocrats).
| Investment Strategy | Yield | LT Consensus Growth | LT Consensus Total Return Potential | Long-Term Risk-Adjusted Expected Return | Long-Term Inflation And Risk-Adjusted Expected Returns | Years To Double Your Inflation & Risk-Adjusted Wealth |
10-Year Inflation And Risk-Adjusted Expected Return |
| 11 Black Friday Aristocrat Deals | 4.00% | 10.70% | 14.7% | 10.3% | 8.0% | 9.0 | 2.15 |
| Nasdaq | 0.8% | 11.8% | 12.6% | 8.8% | 6.5% | 11.0 | 1.88 |
| Schwab US Dividend Equity ETF | 3.6% | 8.5% | 12.1% | 8.4% | 6.1% | 11.8 | 1.81 |
| Dividend Aristocrats | 2.6% | 8.5% | 11.1% | 7.8% | 5.4% | 13.2 | 1.70 |
| S&P 500 | 1.8% | 8.5% | 10.3% | 7.2% | 4.9% | 14.8 | 1.61 |
(Source: DK Research Terminal, FactSet, Morningstar, Ycharts)
That’s potentially 2% better long-term returns than the Nasdaq, and more than 4% better than the S&P 500.
It’s returns on par with the greatest investors in history, what private equity charges a fortune in fees to try to achieve.
Inflation-Adjusted Consensus Return Potential: $1,000 Initial Investment
| Time Frame (Years) | 8.0% CAGR Inflation-Adjusted S&P 500 Consensus | 8.8% Inflation-Adjusted Aristocrat Consensus | 12.4% CAGR Inflation-Adjusted 11 Black Friday Aristocrat Deal Consensus | Difference Between Inflation-Adjusted 11 Black Friday Aristocrat Deal Consensus And S&P Consensus |
| 5 | $1,468.65 | $1,526.66 | $1,791.64 | $323.00 |
| 10 | $2,156.93 | $2,330.70 | $3,209.99 | $1,053.06 |
| 15 | $3,167.77 | $3,558.19 | $5,751.16 | $2,583.40 |
| 20 | $4,652.33 | $5,432.16 | $10,304.04 | $5,651.71 |
| 25 | $6,832.64 | $8,293.08 | $18,461.18 | $11,628.54 |
| 30 | $10,034.74 | $12,660.73 | $33,075.88 | $23,041.14 |
(Source: DK Research Terminal, FactSet)
Analysts think these aristocrat bargains could deliver 61X returns over the next 30 years, or 33X inflation-adjusted returns. Those potentially life-changing rich retirement returns are more than 3X those of the S&P 500 and nearly triple that of the dividend aristocrats.
| Time Frame (Years) | Ratio Inflation-Adjusted 11 Black Friday Aristocrat Deal Consensus/Aristocrat Consensus | Ratio Inflation-Adjusted 11 Black Friday Aristocrat Deal Consensus vs. S&P consensus |
| 5 | 1.17 | 1.22 |
| 10 | 1.38 | 1.49 |
| 15 | 1.62 | 1.82 |
| 20 | 1.90 | 2.21 |
| 25 | 2.23 | 2.70 |
| 30 | 2.61 | 3.30 |
(Source: DK Research Terminal, FactSet)
OK this all sounds very promising but what evidence is there that these 11 aristocrat bargains can deliver anything close to 15% long-term returns?
Historical Returns Since 1996 (Annual Rebalancing)
The future doesn’t repeat, but it often rhymes. – Mark Twain
“Past performance is no guarantee of future results.”
However, studies show that blue chips with relatively stable fundamentals offer predictable returns based on yield, growth, and valuation mean reversion over time.
Bank of America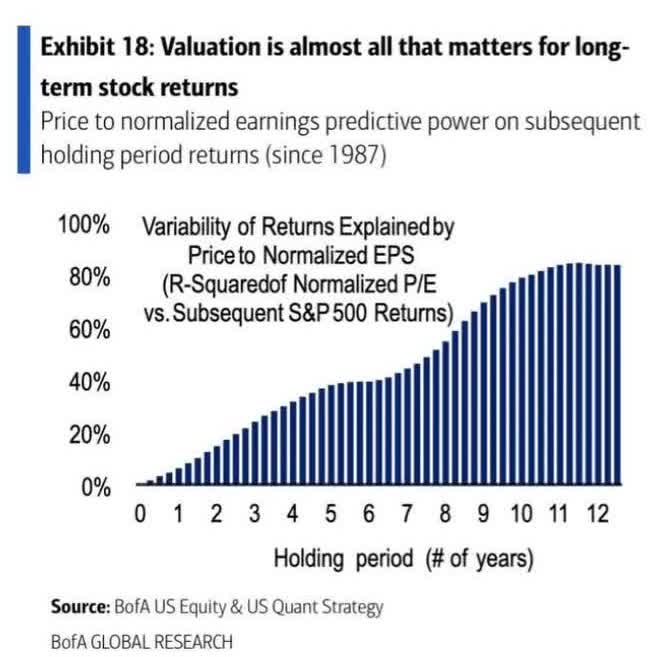
Twenty-six years is a time frame in which 93% of total returns are due to fundamentals, not luck.
(Source: Portfolio Visualizer Premium)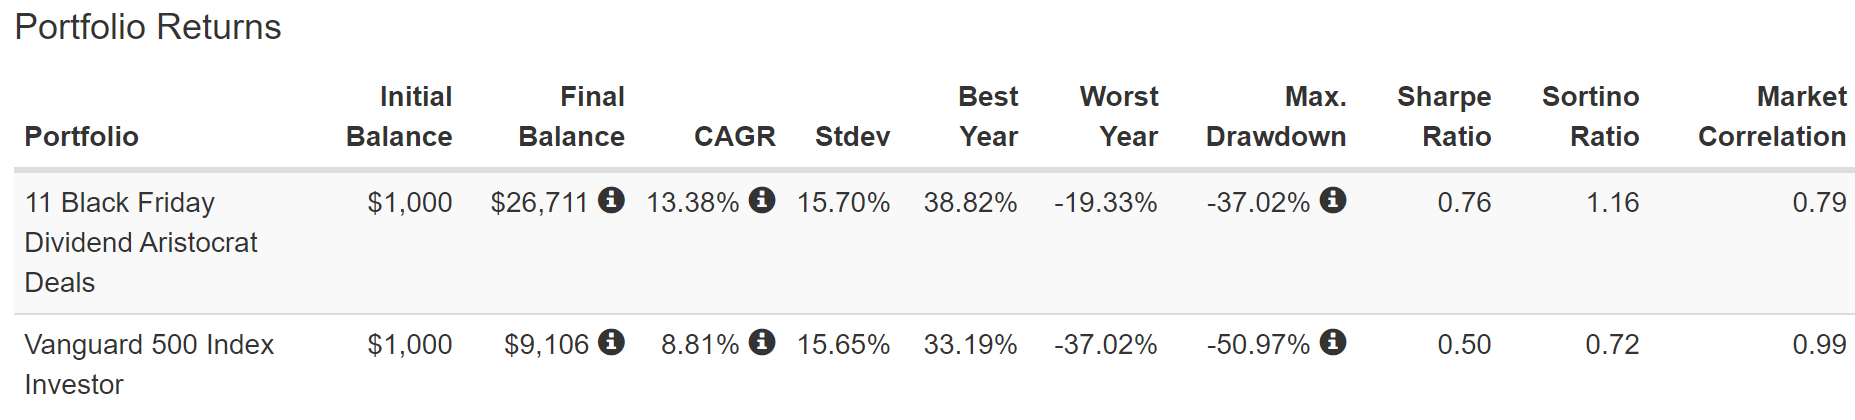
Running circles around the S&P 500 for over a quarter century, and with smaller declines during most bear markets.
(Source: Portfolio Visualizer Premium)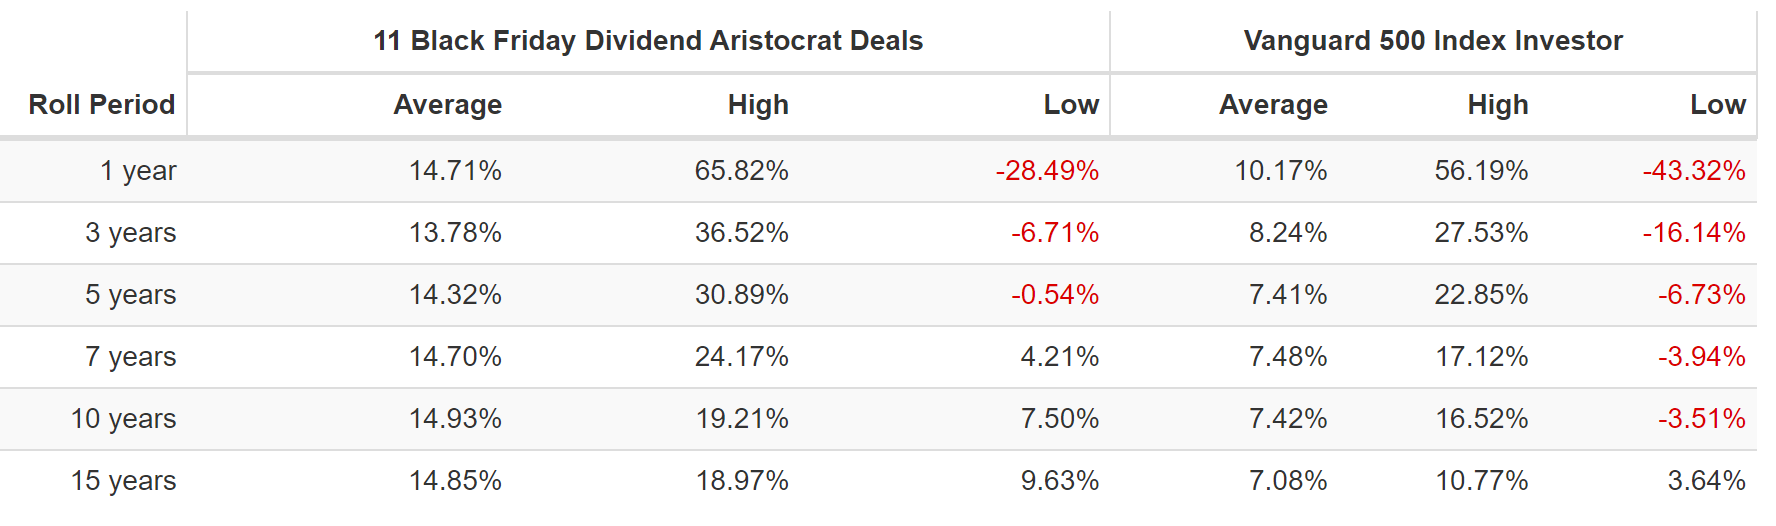
14.7% CAGR long-term growth consensus vs…14.9% average 15-year rolling returns for 26 years and 14.7% CAGR average rolling 12-month returns.
(Source: Portfolio Visualizer Premium)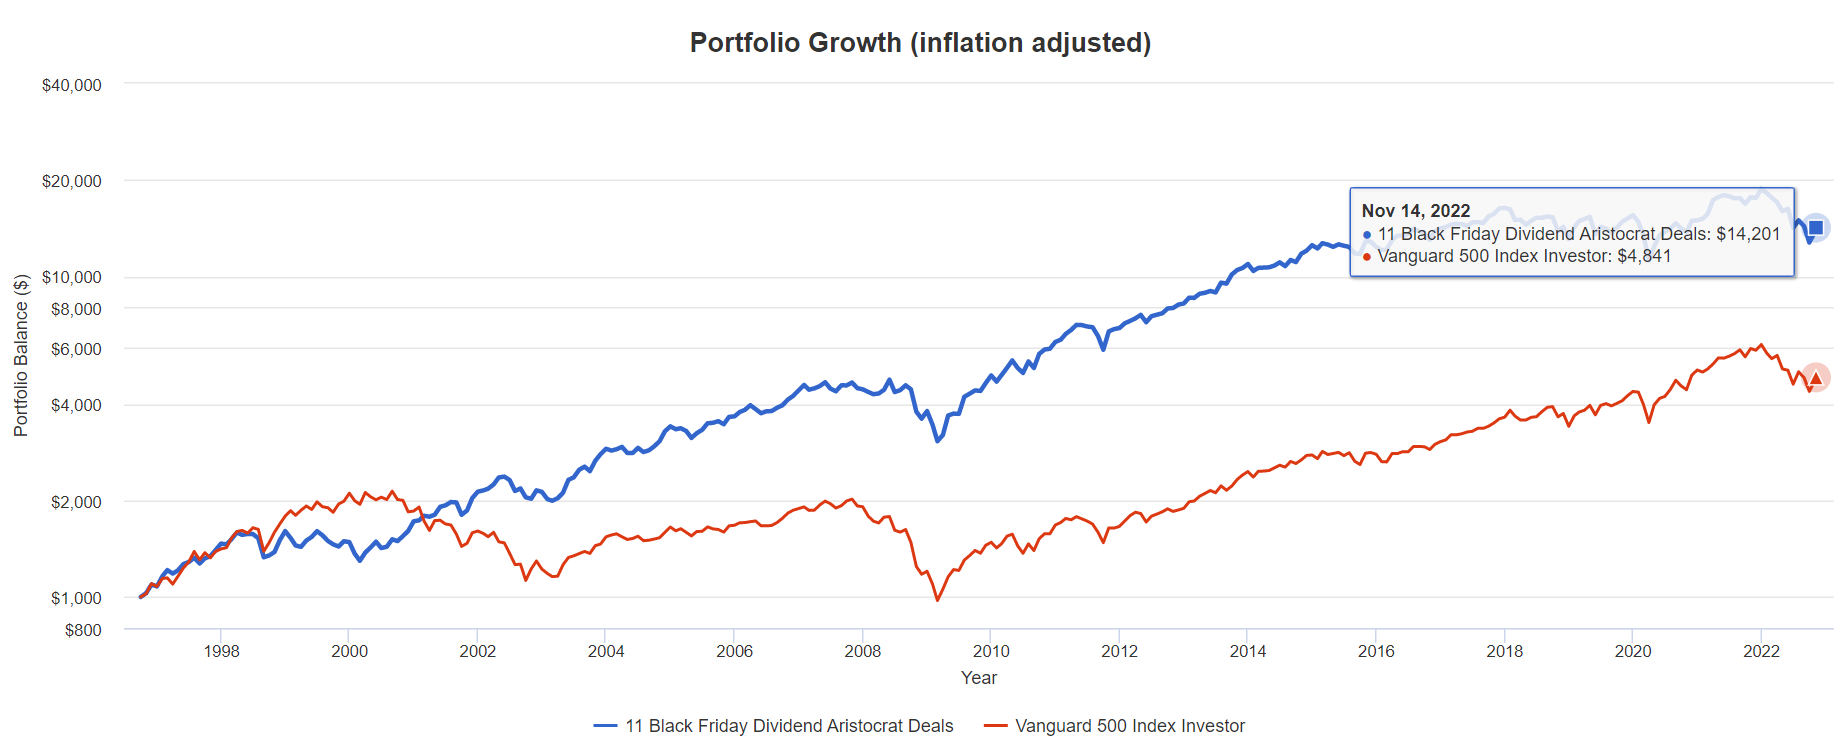
14X inflation-adjusted returns over 26 years, 3X more than the S&P 500.
- just as analysts expect in the future
And let’s not forget the best part of high-yield aristocrats… incredibly dependable long-term income growth!
Income That Rich Retirement Dreams Are Made From
2007 and 2008 were 3 MO Spin-Offs ((Source: Portfolio Visualizer Premium))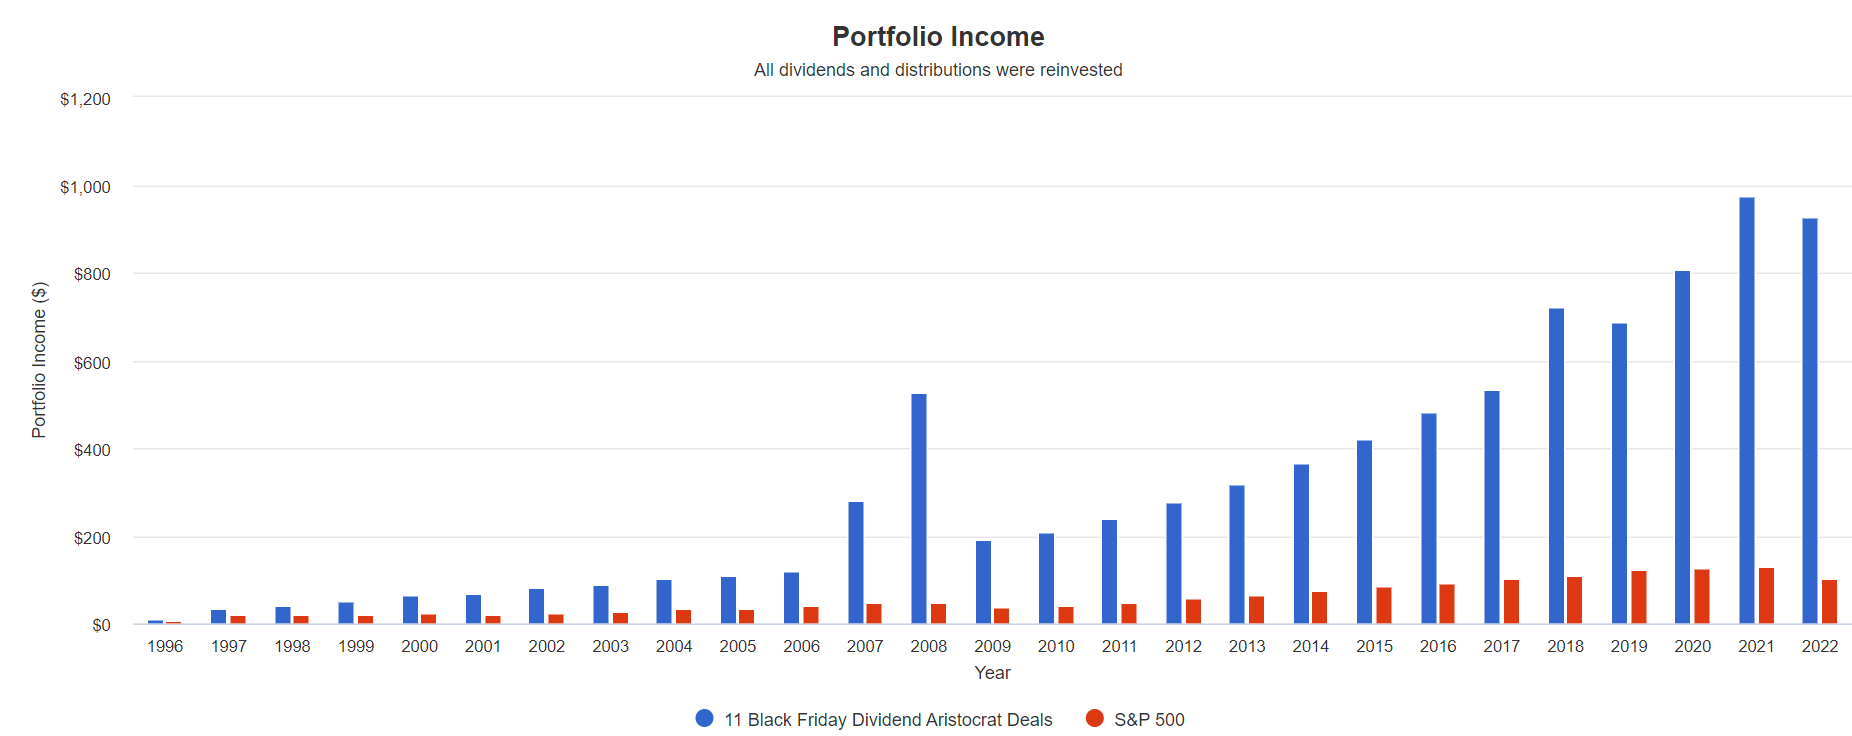
Take a look at what the power of high-yield aristocrat investing can do over time!
Cumulative Dividends Since 1997: $1,000 Initial Investment
| Metric | S&P 500 | 11 Black Friday Aristocrat Deals |
| Total Dividends | $1,599 | $9,027 |
| Total Inflation-Adjusted Dividends | $855.08 | $4,827.27 |
| Annualized Income Growth Rate | 8.1% | 15.2% |
| Total Income/Initial Investment % | 1.60 | 9.03 |
| Inflation-Adjusted Income/Initial Investment % | 0.86 | 4.83 |
| More Inflation-Adjusted Income Than S&P | NA | 5.65 |
| Starting Yield | 2.0% | 3.6% |
| Today’s Annual Dividend Return On Your Starting Investment (Yield On Cost) | 13.9% | 123.6% |
| 2022 Inflation-Adjusted Annual Dividend Return On Your Starting Investment (Inflation-Adjusted Yield On Cost) | 7.4% | 66.1% |
(Source: Portfolio Visualizer Premium)
Twenty-five years of 15% annual income growth, 2X faster than the S&P 500 resulting in 6X more inflation-adjusted income and a 5X return of your inflation-adjusted investment in dividends alone.
A 3.6% yield in 1996 is now 66% inflation-adjusted yield on cost.
- every $1 invested in 1996 is now paying $0.66 in annual inflation-adjusted income
- still growing at 15% per year
- doubling every five years
Turning These 11 Dividend Aristocrat Bargains Into A Complete Retirement Portfolio
These 11 Black Friday aristocrats represent eight sectors and thus it’s safe for most people to just buy these 11. On paper… but remember that a 100% stock portfolio is going to be highly volatile at times, even if it’s nothing but Super SWAN aristocrats.
(Source: Portfolio Visualizer Premium)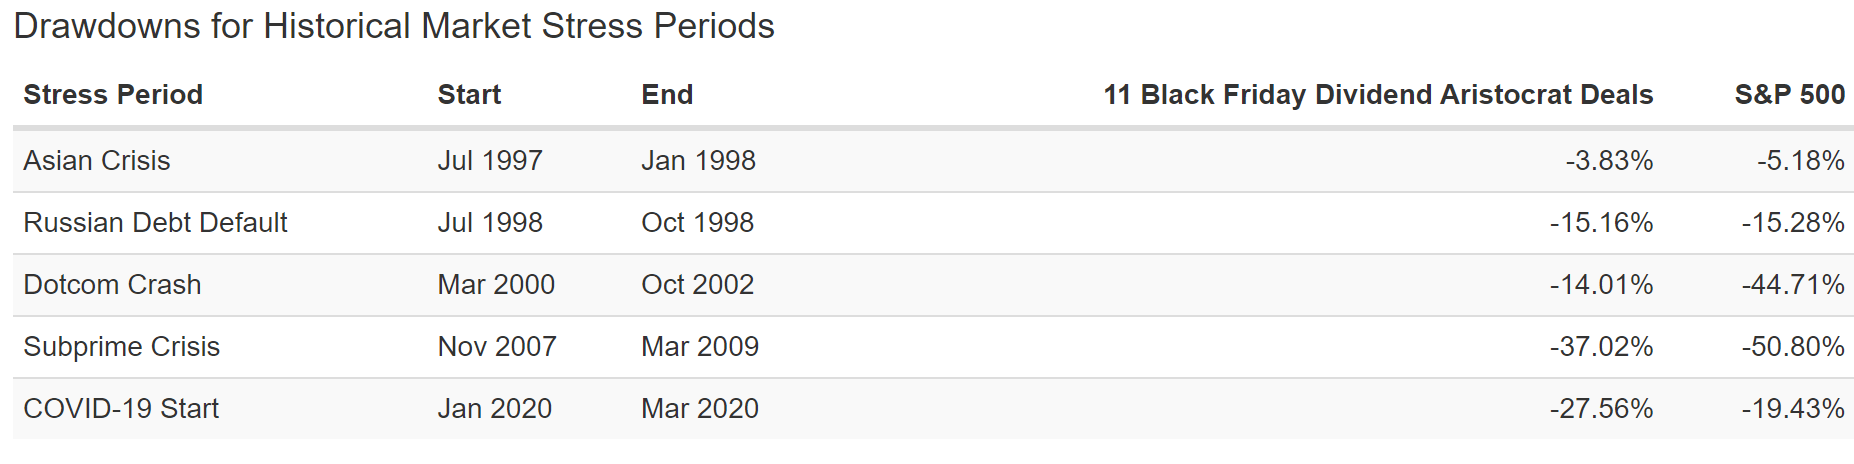
They tend to fall less than the market but they still fell 37% during the Great Recession.
- which could cause you to become a panic seller at the exact wrong time
(Source: Portfolio Visualizer Premium)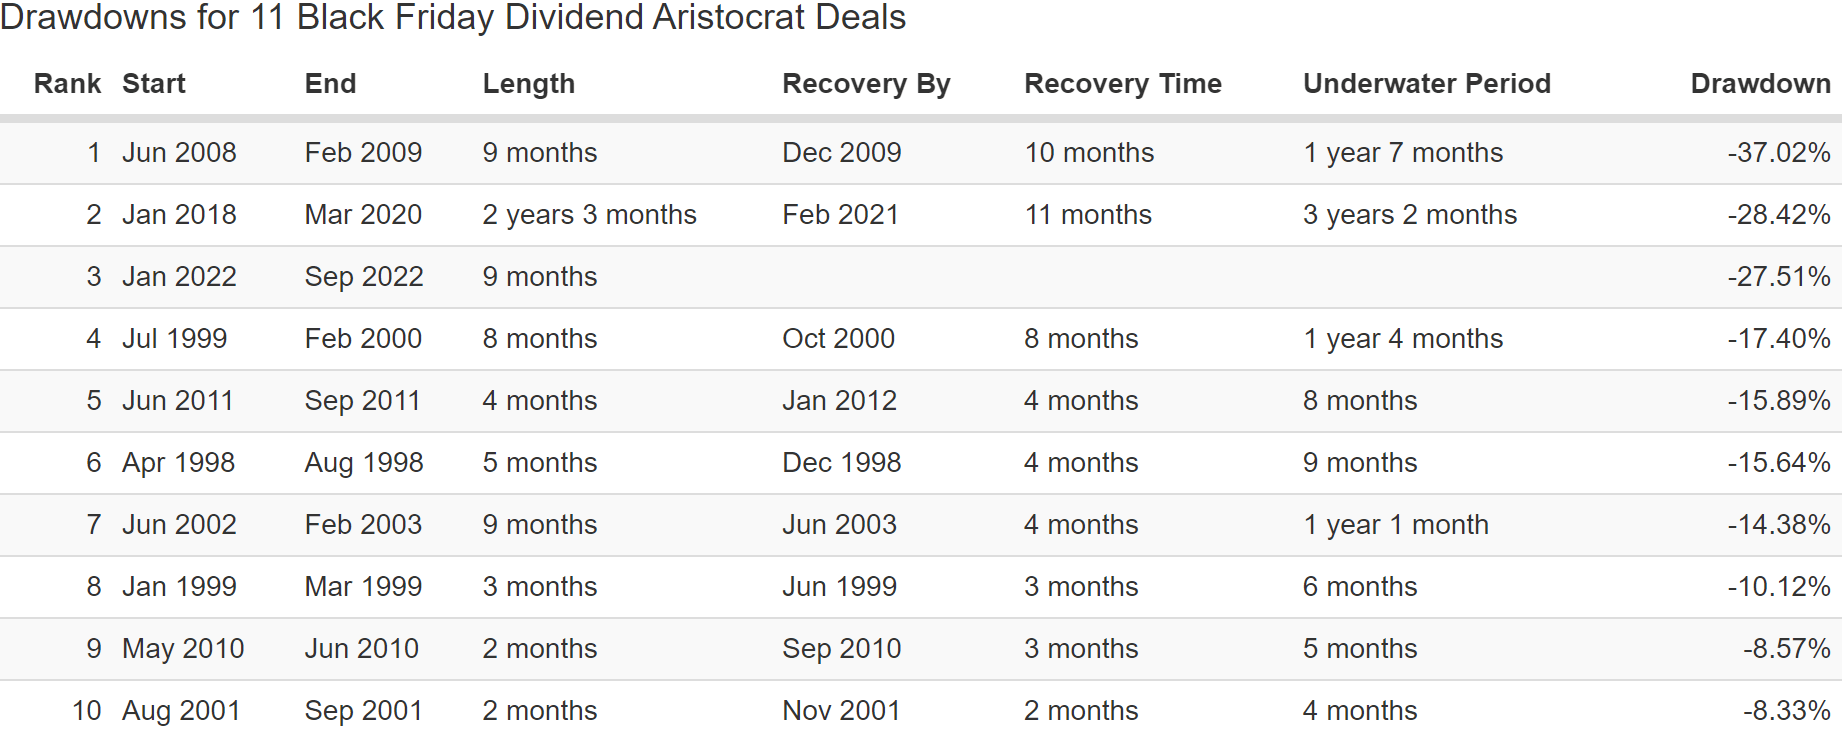
They fell a peak 28% during this bear market, the same as the S&P 500.
Black Friday Aristocrat Deals During The 2022 Bear Market
(Source: Portfolio Visualizer Premium)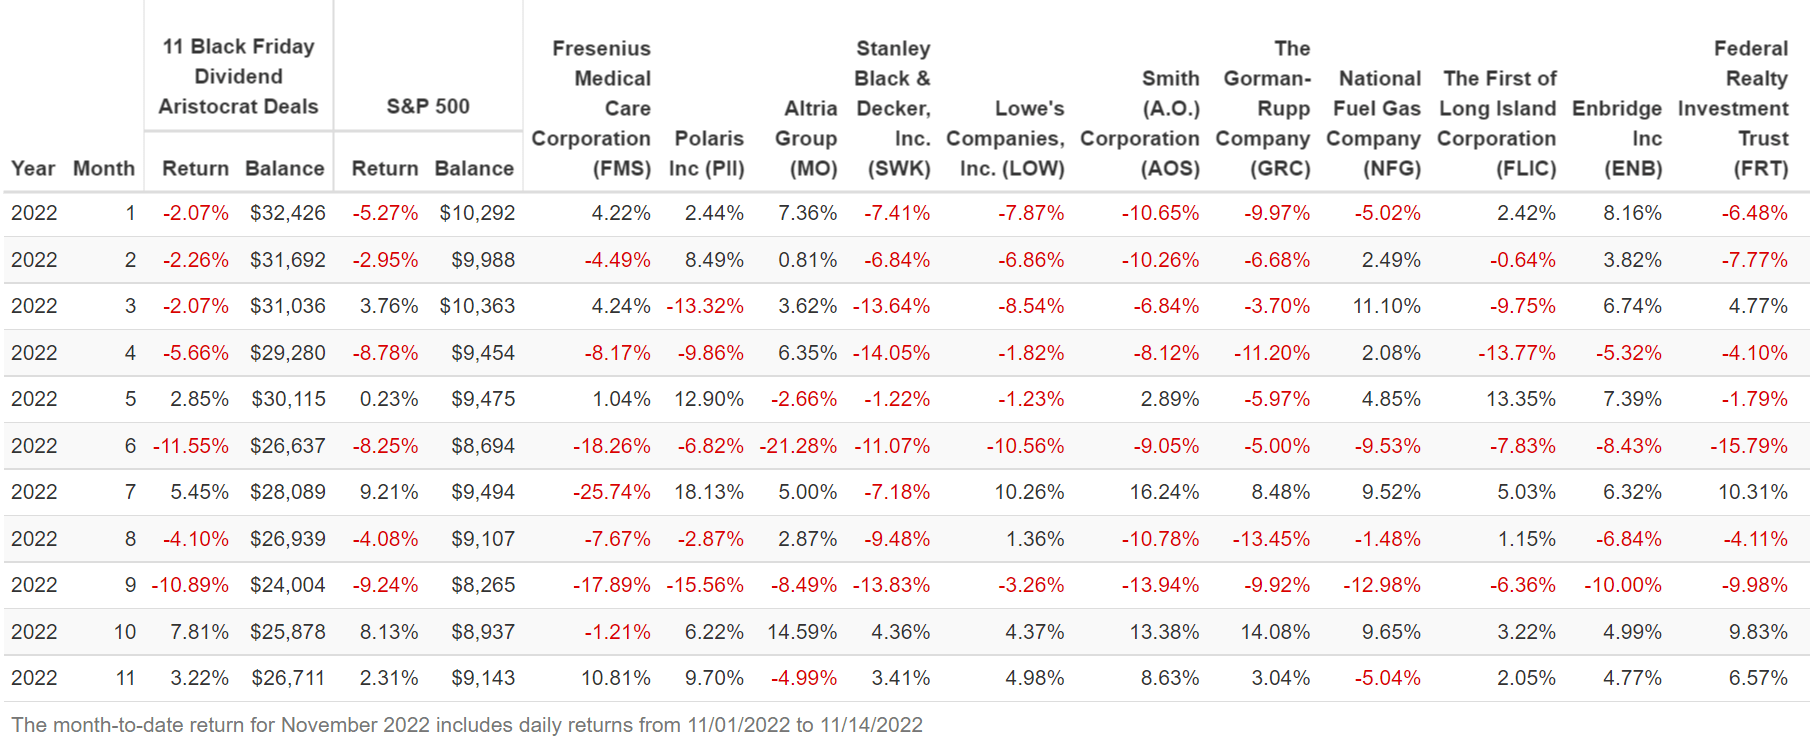
Even normally low volatility aristocrats can fall as much as 26% in a single month.
And the entire portfolio fell as much as 12% in June 2022.
But here’s how you can stay safe and sane in such turbulent times.
Behold The Awesome Power Of ZEUS
ZEUS = Zen Extraordinary Ultra SWAN portfolio strategy
The DK ZEUS portfolio strategy is based on the historically long-term recession-optimized asset allocation.
- as shown in Nick Maggiulli’s book ‘Just Keep Buy”
- Chief Data Scientist for Ritholtz Wealth Management
The ZEUS strategy is a set and forget buy and hold forever and rebalance once per year strategy designed and proven to provide:
- far better yield than the 60/40
- superior returns to the 60/40 and even S&P 500
- 33% lower annual volatility than the market
- 33% to 66% smaller peak declines during even the most extreme market crashes
ZEUS is the king of sleep well at night retirement portfolios and lets you ride over market potholes in a Rolls Royce.
What exactly is ZEUS?
- 33% blue-chip ETFs
- 33% hedging assets (cash, bonds, managed futures, alternatives)
- 33% individual blue-chips
So in this case here’s the ZEUS Aristocrat Value portfolio or ZAV.
- 33% SCHD or VYM (gold standard high-yield blue-chip ETFs)
- 16.7% EDV or TLT (long duration US treasury ETFs)
- 16.7% managed futures (DBMF, AMFAX, PQTAX, or GIFMX)
- 33% Black Friday Aristocrat Deals (3% each)
ZEUS Aristocrat Value Vs 60/40
| Metric | 60/40 | ZEUS Aristocrat Value Portfolio | X Better Than 60/40 |
| Yield | 2.3% | 4.8% | 2.13 |
| Growth Consensus | 5.1% | 6.4% | 1.25 |
| LT Consensus Total Return Potential | 7.4% | 11.2% | 1.52 |
| Risk-Adjusted Expected Return | 5.1% | 7.8% | 1.52 |
| Safe Withdrawal Rate (Risk And Inflation-Adjusted Expected Returns) | 2.9% | 5.6% | 1.94 |
| Conservative Time To Double (Years) | 25.0 | 12.9 | 1.94 |
(Source: DK Research Terminal, FactSet)
ZAV offers more than 2X the yield of a 60/40 and 50% higher long-term return potential, resulting in a 2X higher safe withdrawal rate.
It’s also likely to double, in inflation-adjusted terms, twice as fast.
ZEUS Aristocrat Value Vs 60/40
| Metric | S&P 500 | ZEUS Aristocrat Value Portfolio | X Better Than S&P 500 |
| Yield | 1.8% | 4.8% | 2.67 |
| Growth Consensus | 8.5% | 6.4% | 0.75 |
| LT Consensus Total Return Potential | 10.3% | 11.2% | 1.09 |
| Risk-Adjusted Expected Return | 7.2% | 7.8% | 1.09 |
| Safe Withdrawal Rate (Risk And Inflation-Adjusted Expected Returns) | 4.9% | 5.6% | 1.13 |
| Conservative Time To Double (Years) | 14.6 | 12.9 | 1.13 |
(Source: DK Research Terminal, FactSet)
In fact, ZAV is better than the S&P 500, despite being just 67% stocks.
You don’t have to sacrifice returns for low volatility and a smooth ride down Wall Street;)
Inflation-Adjusted Consensus Total Return Potential: $510,000 Average Retired Couple’s Savings At Age 65 Initial Investment
| Time Frame (Years) | 5.1% CAGR Inflation-Adjusted 60/40 | 8.9% Inflation-Adjusted ZAV Portfolio | Difference Between ZAV Consensus and 60/40 Consensus |
| 5 | $654,226.87 | $780,029.97 | $125,803.10 |
| 10 | $839,240.78 | $1,193,032.86 | $353,792.07 |
| 15 | $1,076,576.22 | $1,824,708.60 | $748,132.38 |
| 20 | $1,381,029.60 | $2,790,838.04 | $1,409,808.45 |
| 25 | $1,771,581.71 | $4,268,504.55 | $2,496,922.84 |
| 30 (retirement time frame) | $2,272,581.10 | $6,528,551.94 | $4,255,970.84 |
| 35 | $2,915,262.01 | $9,985,227.83 | $7,069,965.82 |
| 40 | $3,739,691.66 | $15,272,111.74 | $11,532,420.08 |
| 45 | $4,797,268.18 | $23,358,244.90 | $18,560,976.72 |
| 50 | $6,153,925.02 | $35,725,747.31 | $29,571,822.29 |
| 55 | $7,894,241.40 | $54,641,477.83 | $46,747,236.43 |
| 60 (investing lifetime) | $10,126,715.41 | $83,572,530.29 | $73,445,814.88 |
| 100 (institutional time frame, multi-generational wealth, philanthropic trusts) | $74,256,457.08 | $2,502,605,923.17 | $2,428,349,466.09 |
(Source: DK Research Terminal, FactSet)
Over 30 years analysts expect ZAV to potentially deliver $4.3 million in additional inflation-adjusted wealth.
If you’re young and have a 60 year investing lifetime? It could deliver 164X inflation-adjusted returns.
- S&P 500 consensus 101X inflation-adjusted returns over 60 years
| Time Frame (Years) |
Ratio ZAV Consensus Vs 60/40 Consensus |
| 5 | 1.19 |
| 10 | 1.42 |
| 15 | 1.69 |
| 20 | 2.02 |
| 25 | 2.41 |
| 30 | 2.87 |
| 35 | 3.43 |
| 40 | 4.08 |
| 45 | 4.87 |
| 50 | 5.81 |
| 55 | 6.92 |
| 60 | 8.25 |
| 100 | 33.70 |
(Source: DK Research Terminal, FactSet)
Over a retirement time frame, ZAV could potentially triple the returns of a 60/40.
And over an institutional time frame of 100 years? 34X higher inflation-adjusted wealth.
- 34X more donations to charity if that’s your goal
OK, this sounds amazing but it’s almost too good to be true. Except that it’s not.
Great returns and sleeping well at night isn’t magic, it’s math (asset allocation and blue-chip world-beater assets).
Historical Returns Since December 2007(Start Of The Great Recession)
(Source: Portfolio Visualizer Premium)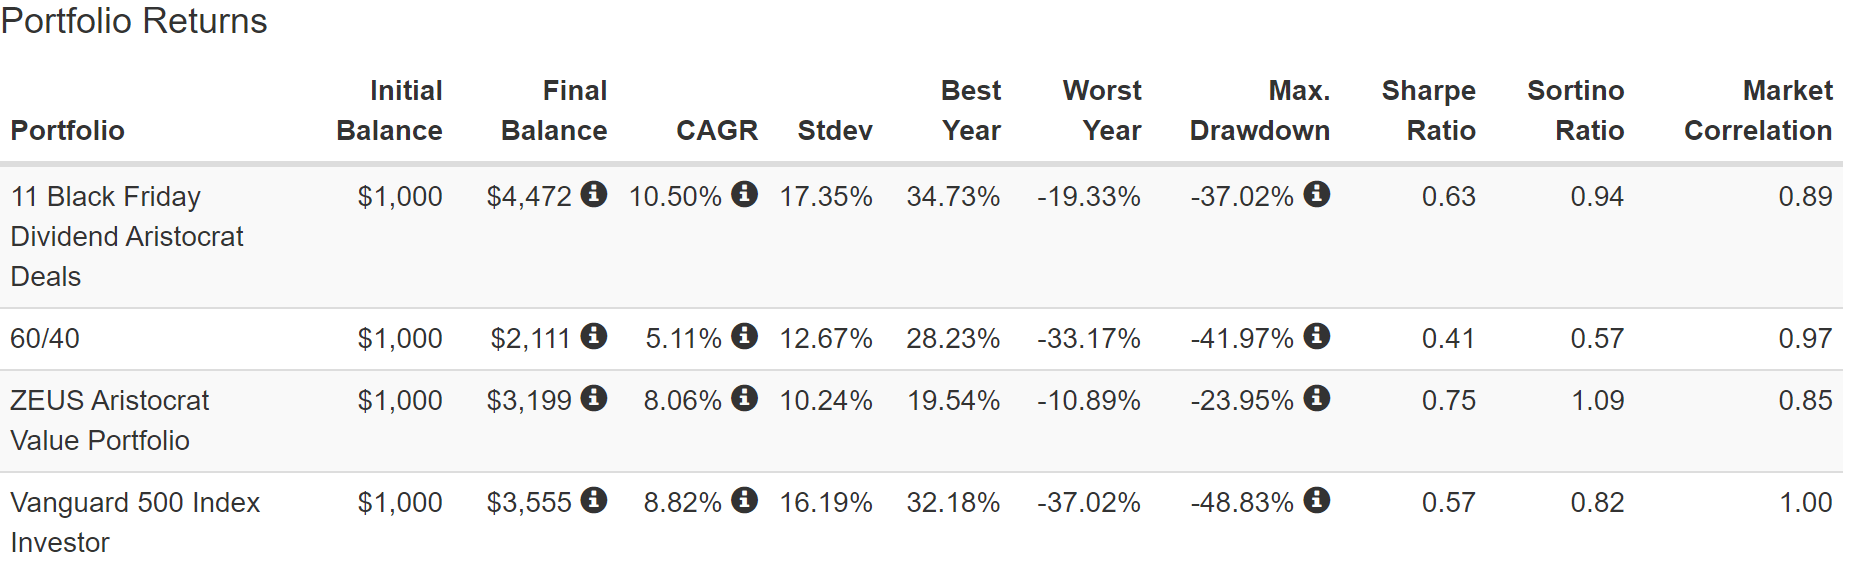
60/40 smashing and almost market-matching returns but with just 10% annual volatility.
- 33% less volatile than the S&P 500
A 24% peak decline during the Great Recession, half that of the S&P 500 and 43% smaller than a 60/40.
2X better negative volatility-adjusted returns than the 60/40 (Sortino Ratio) and a superior Sortino to the Black Friday aristocrats alone.
- ZAV’s Sortino beats the Black Friday aristocrats
- Aristocrats delivered superior Sortino to the S&P
- which delivered a better Sortino than a 60/40
(Source: Portfolio Visualizer Premium)
Fifteen years of some of the most extreme market conditions in history and ZEUS suffered just one bear market. It took the second-largest market crash in US history for ZEUS to suffer a bear market.
- and took no longer than 18 months to recover from the Great Recession
- 60/40 tool 3.5 years
- S&P took 4.5 years
Now let’s take a stroll down memory lane. Here’s how ZEUS performed in all the bear markets of the last 15 years.
ZEUS During The 2022 Stagflation Bear Market
(Source: Portfolio Visualizer Premium)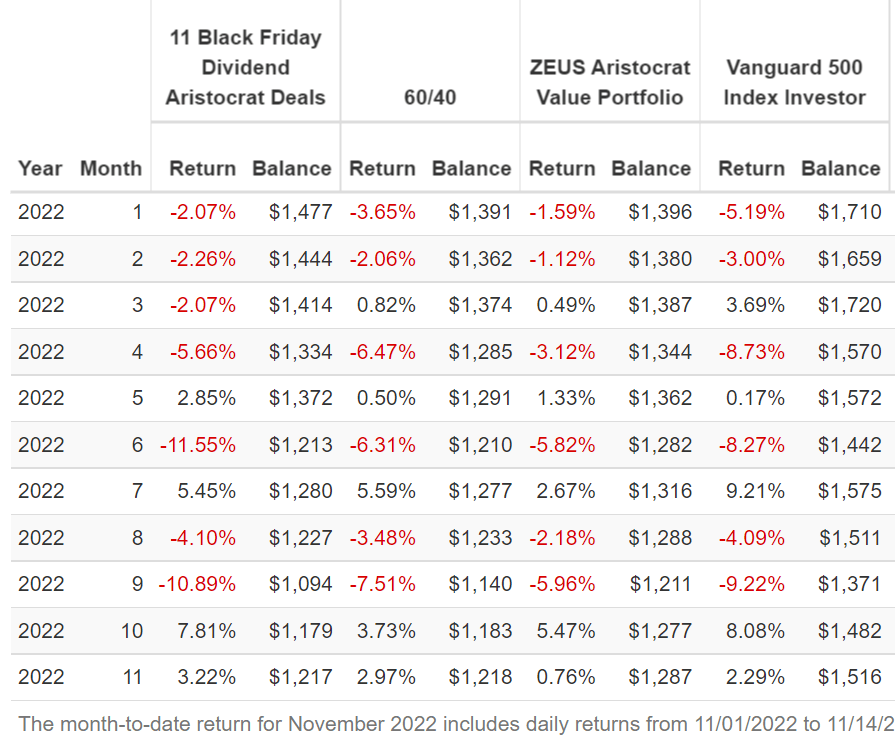
In a year when nothing has been working, ZEUS did its job.
When stocks fell 9% in September and the aristocrats fell 11%, ZEUS fell 6%.
When stocks fall 9% in April and the aristocrats fell 6%, ZEUS fell just 3%, 1/3rd as much as the market and half as much a 60/40.
When stocks fell 8% in June, and the aristocrats 12%, ZEUS fell 6%.
ZEUS During The Pandemic
(Source: Portfolio Visualizer Premium)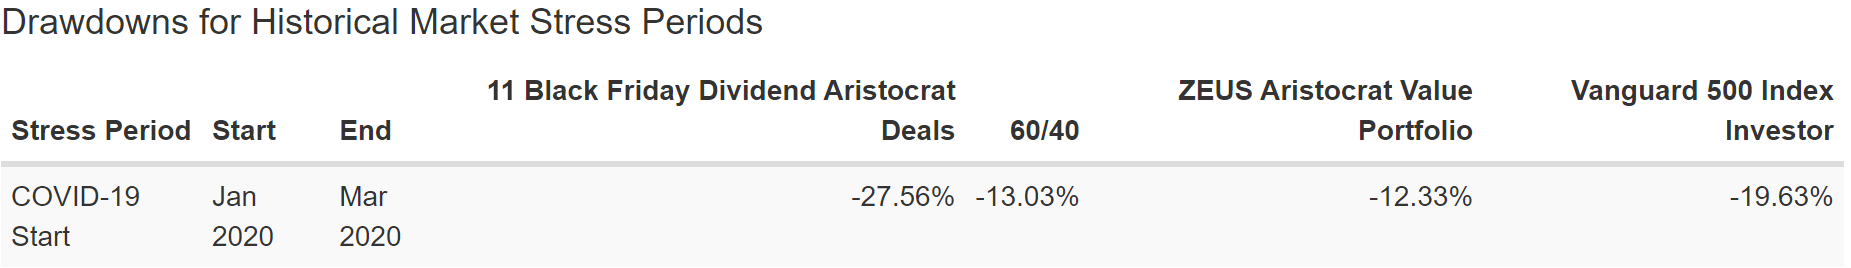
When the aristocrats crashed in the Pandemic (why they are such bargains today) ZEUS fell less than a 60/40 and 40% less than the S&P 500.
ZEUS During The 2018 Bear Market
(Source: Portfolio Visualizer Premium)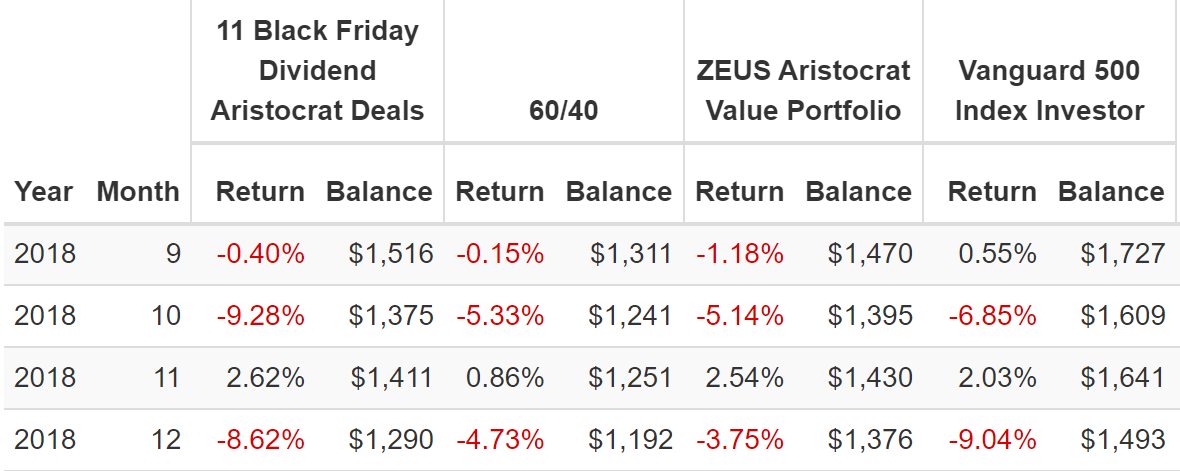
When the S&P fell 21% in 2018, ZEUS fell less than 10%, including just 4% when the market fell 9% in December.
ZEUS During The 2011 Bear Market
(Source: Portfolio Visualizer Premium)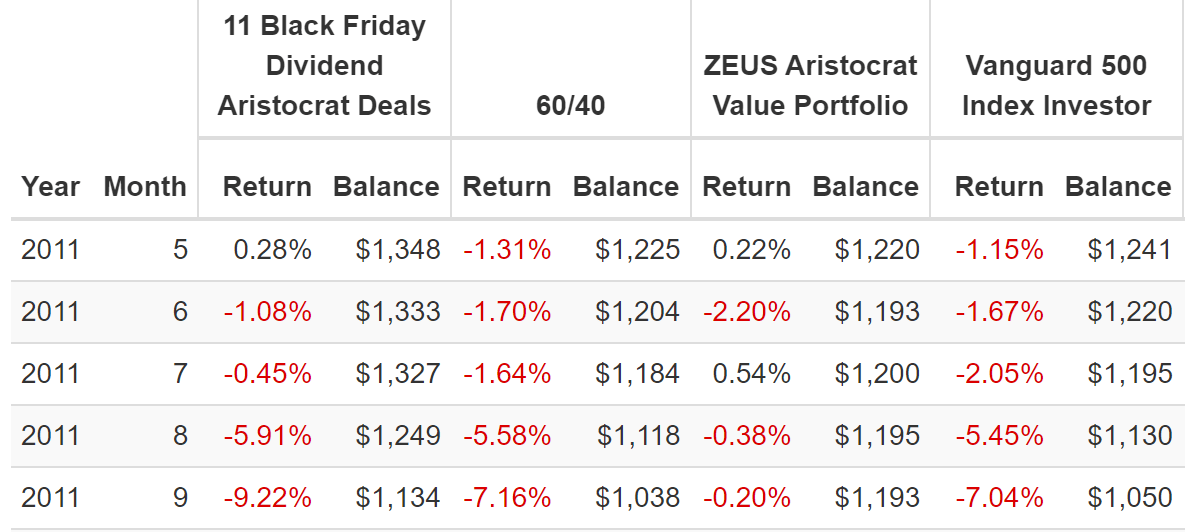
When the market fell 22% in 2011 ZEUS fell just 2%, including staying flat in the final September plunge when the S&P fell 7% and a 60/40 did too.
- 91% smaller decline than the market during the 2011 bear market
- 1/8th as much as the 60/40
ZEUS During The Great Recession
(Source: Portfolio Visualizer Premium)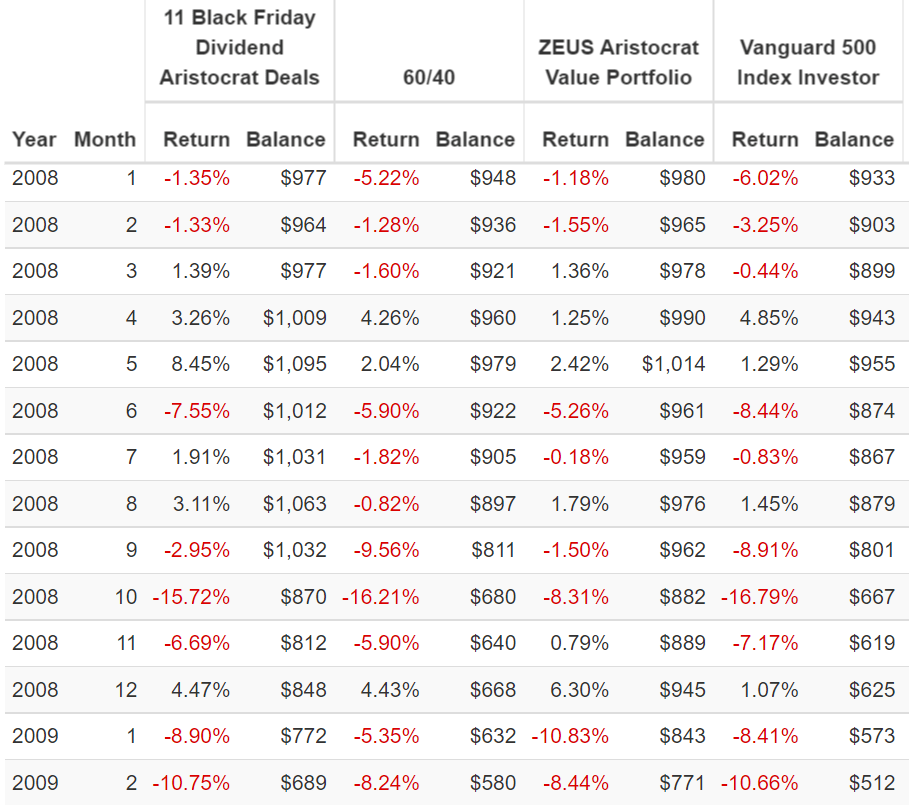
The aristocrats started out the Great Recession doing great. But then the market really started diving including a 17% plunge in October 2008. The aristocrats fell 16% as well, as did a 60/40.
ZEUS? Just 8%, half as much as the market.
During the entire crisis, ZEUS fell half as much as the market and 40% less than a 60/40 and 33% less than the Black Friday Aristocrat deals.
ZEUS: Riding Over Even The Largest Market Potholes In A Rolls Royce
Bottom Line: These Are 11 Black Friday Dividend Aristocrat Deals You Don’t Want To Miss
Let me be clear: I’m NOT calling the bottom in any of these aristocrats (I’m not a market timer).
Super SWAN quality has nothing to do with volatility. Even Super SWAN aristocrats can fall hard and fast in bear markets.
Fundamentals are all that determine safety and quality, and my recommendations.
- over 30+ years, 97% of stock returns are a function of pure fundamentals, not luck
- in the short term; luck is 25X as powerful as fundamentals
- in the long term, fundamentals are 33X as powerful as luck
In the short-term stock prices are a crap-shoot. In the long-term they are fundamentals driven destiny.
Black Friday is a time to gorge on value, not just turkey. And today FMS, PII, MO, SWK, LOW, AOS, GRC, NFG, FLIC, ENB, and FRT represent the 11 best Black Friday dividend aristocrat deals on Wall Street.
- 4.0% very safe yield
- BBB+ stable average credit rating
- 42-year average dividend growth streak (since 1980)
- 28% historical discount (14.4X earnings)
- 10.7% CAGR growth consensus
- 14.7% CAGR long-term return potential, the same as the last 26 years
If you’re worried about the likely final phase of the bear market, then you can combine these aristocrat bargains with a prudent allocation of bonds, managed futures, and ETFs to create a ZEUS Aristocrat Value portfolio.
- 4.8% safe yield
- 11.2% CAGR long-term return potential (similar to the last 15 years of returns )
- 24% peak decline in the Great Recession
- 50% smaller peak declines in virtually all bear markets including 2022
The point is that when you combine the world’s best blue-chip assets, you have a lot to be thankful for. Not just this holiday season, but always.
Because when you focus on safety and quality first, and prudent valuation and sound risk-management always you never have to pray for luck.
You make your own luck and retire in safety and splendor.
Be the first to comment