

Panuwat Dangsungnoen
Investment thesis
NVIDIA Corporation (NASDAQ:NVDA) stock has been significantly sold off, losing over 68% since its all-time-high (ATH), a massive and over-proportional drop when compared to its relevant industry. NVDA has completed its Elliott impulse sequence, as I forecasted in my previous article, and reached the short-term price target I announced as likely, while the stock is seemingly forming its corrective wave sequence.
In this article, I explain an actionable trading opportunity for more short-term investors, but I also consider a contingency plan for more long-term oriented investors. I qualify the most likely price target with 13% upside potential, while I give insights on how I would limit my downside risk, by considering appropriate stop-loss levels and actively managing the risk exposure.
A quick look at the big picture
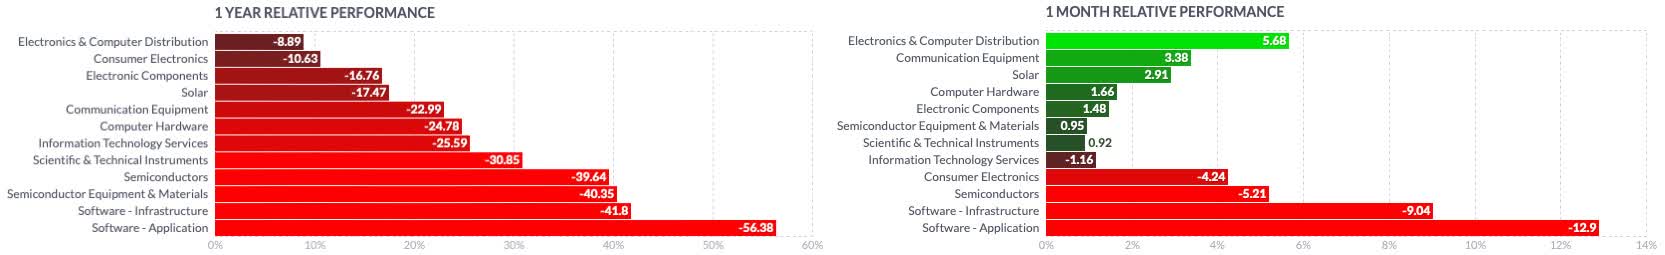
The technology sector in the U.S. has been under pressure for most of the past 12 months. Although retracing its sharp rebound during July and August by giving back all of its gains, the sector, and more specifically some of its industries, could recently perform better. While companies in the information technology services industry are not among the biggest losers in the technology sector, they seem to struggle to build up relative strength. While companies in the electronics and computer distribution industry, communication equipment manufacturers, and the solar industry are recently leading the sector, companies in the software application and infrastructure industries, as well as semiconductor manufacturers, are still among the laggards.
finviz finviz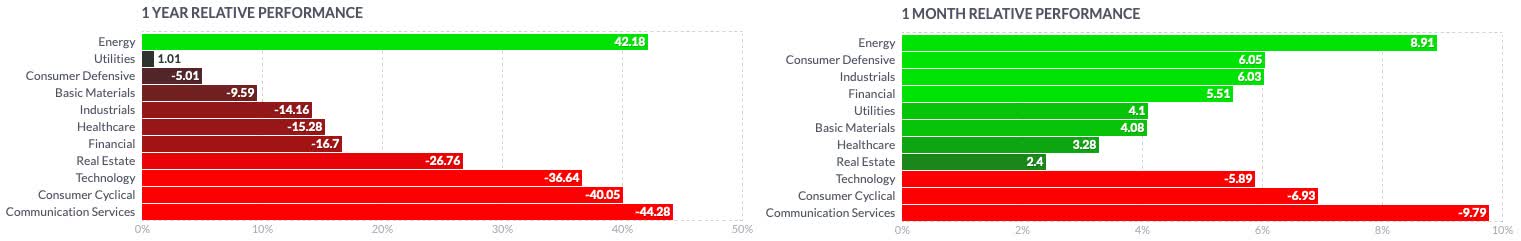
Looking at more specific groups of the industry, the VanEck Semiconductor ETF (SMH) marked its ATH on November 22, 2021, and has since massively corrected, losing over 47% until bottoming on October 13, 2022. It has since reverted and is heading toward its EMA50 on a daily scale, or more importantly, toward its EMA200 on a weekly time frame. While the industry reference is still in its long-term downtrend, it is seemingly building up some relative strength when compared to the broader technology market, the Nasdaq Composite, or more narrowly the Nasdaq-100 tracked by the Invesco QQQ ETF (QQQ).
Author, using TradingView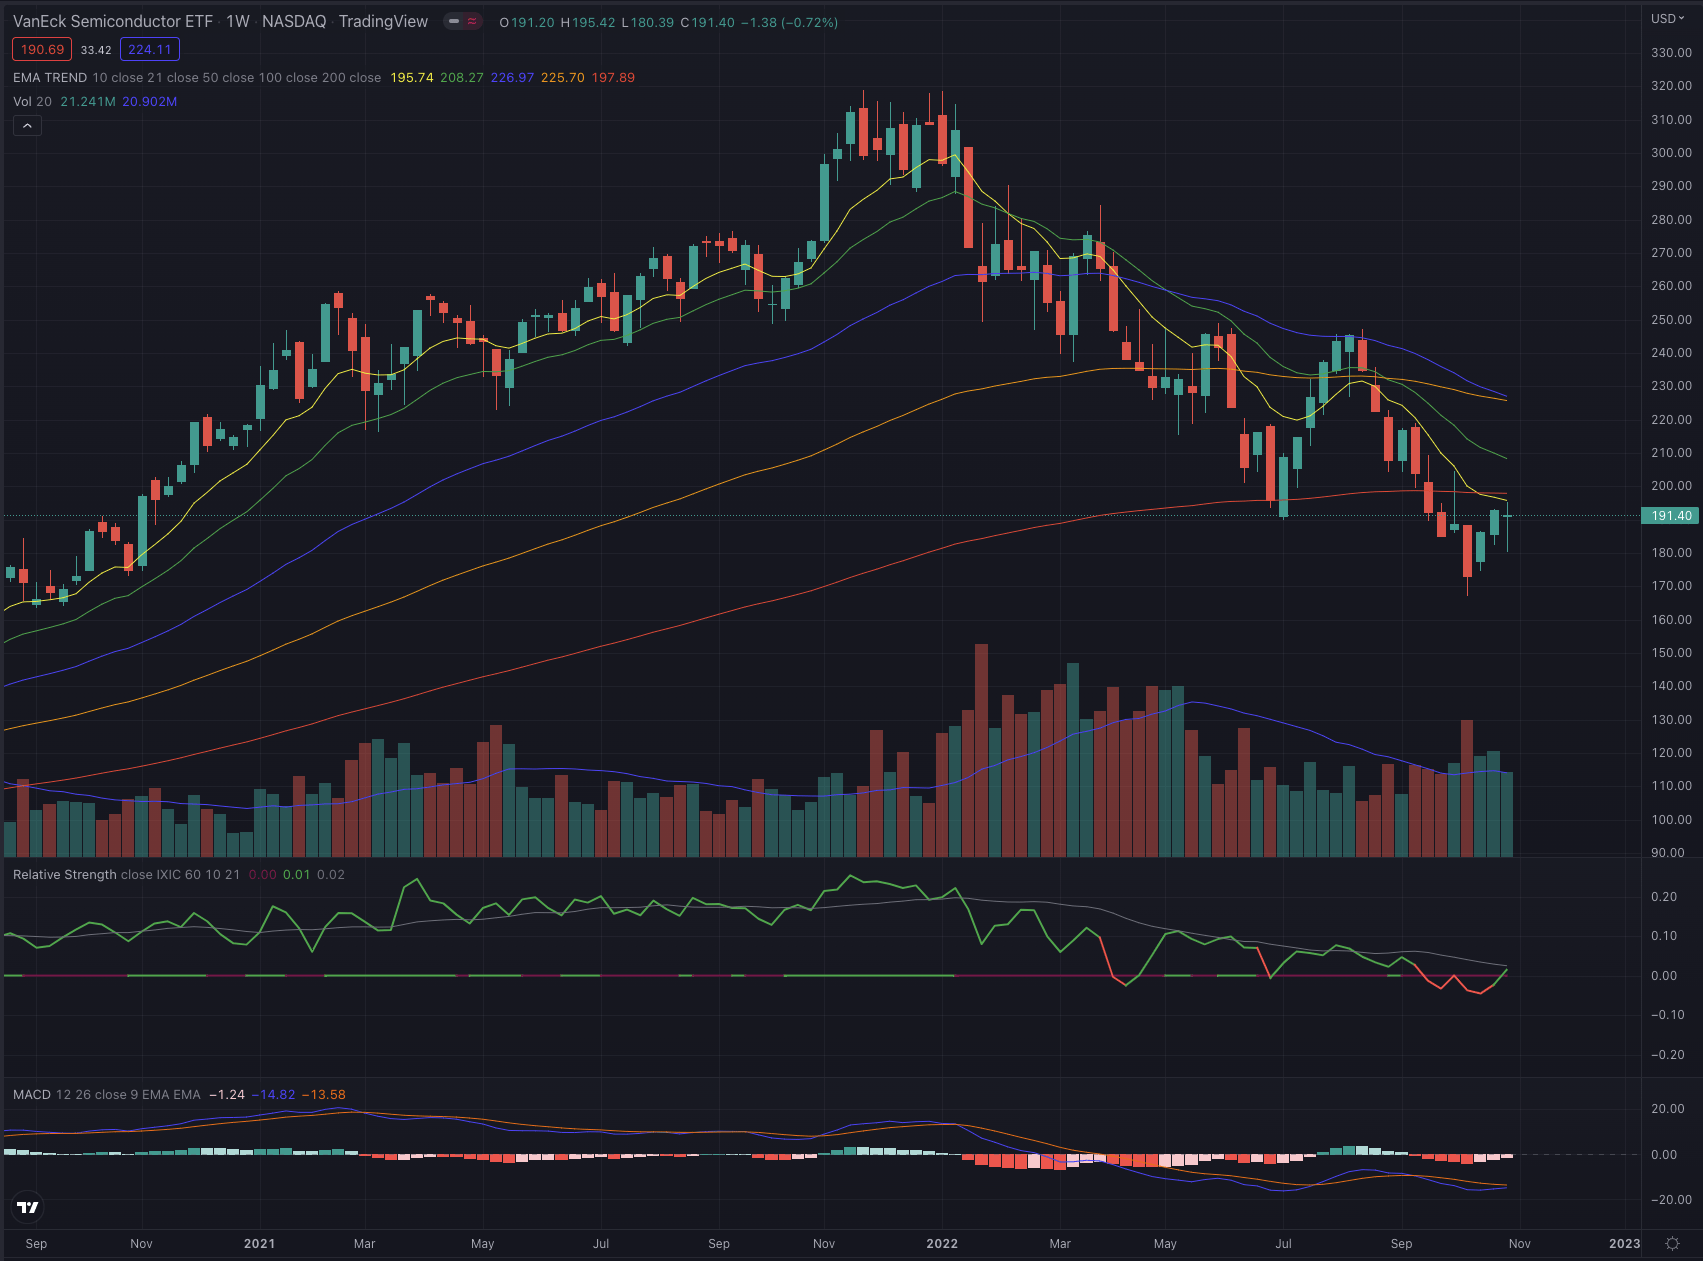
By analyzing the historical stock chart, we notice that NVDA had a mixed performance in the past years through 2020, when the stock began to significantly outperform most of its references, resulting in an overall performance of 167%. Advanced Micro Devices (AMD) did even better, with a massive performance of 416%. All the other references underperformed the stock, with the broader U.S. stock market tracked by the iShares Russell 2000 ETF (IWM) lagging behind the S&P 500 (SP500) and the Invesco QQQ ETF, while Intel (INTC) has been the worst performer overall, losing over 39% over the analyzed time.
Author, using SeekingAlpha.com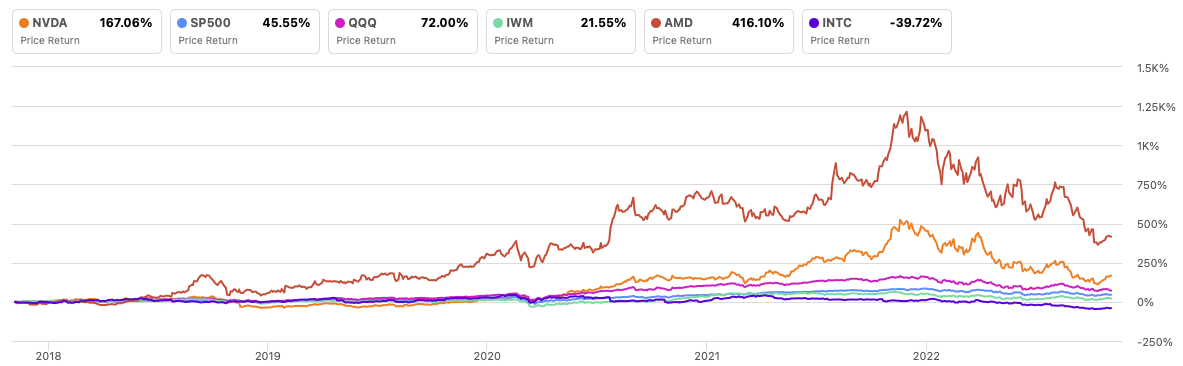
Where are we now?
In my last article Nvidia: The Data Center Powerhouse, published on September 7, 2022, I expressed my worries about seeing the stock performing negatively in the short term. I wrote
I consider the stock falling until $106 as a likely scenario, if the negative trend continues to weight on the technology sector, as selling pressure is accelerating and despite possible further short rallies, the stock failed to break out from its downtrend and just broke the strong support of its EMA200 on its weekly chart.
At the time the article was published, Nvidia’s stock was priced at $135.63. In fact, it continued to fall further under its EMA200 on its weekly chart, significantly dropping for the next five weeks, until bottoming at $108.13. Well, if we want to be picky, not exactly at my target, but with a variance of 2%, close enough to consider it as an insignificant difference in terms of technical analysis.
Author, using TradingView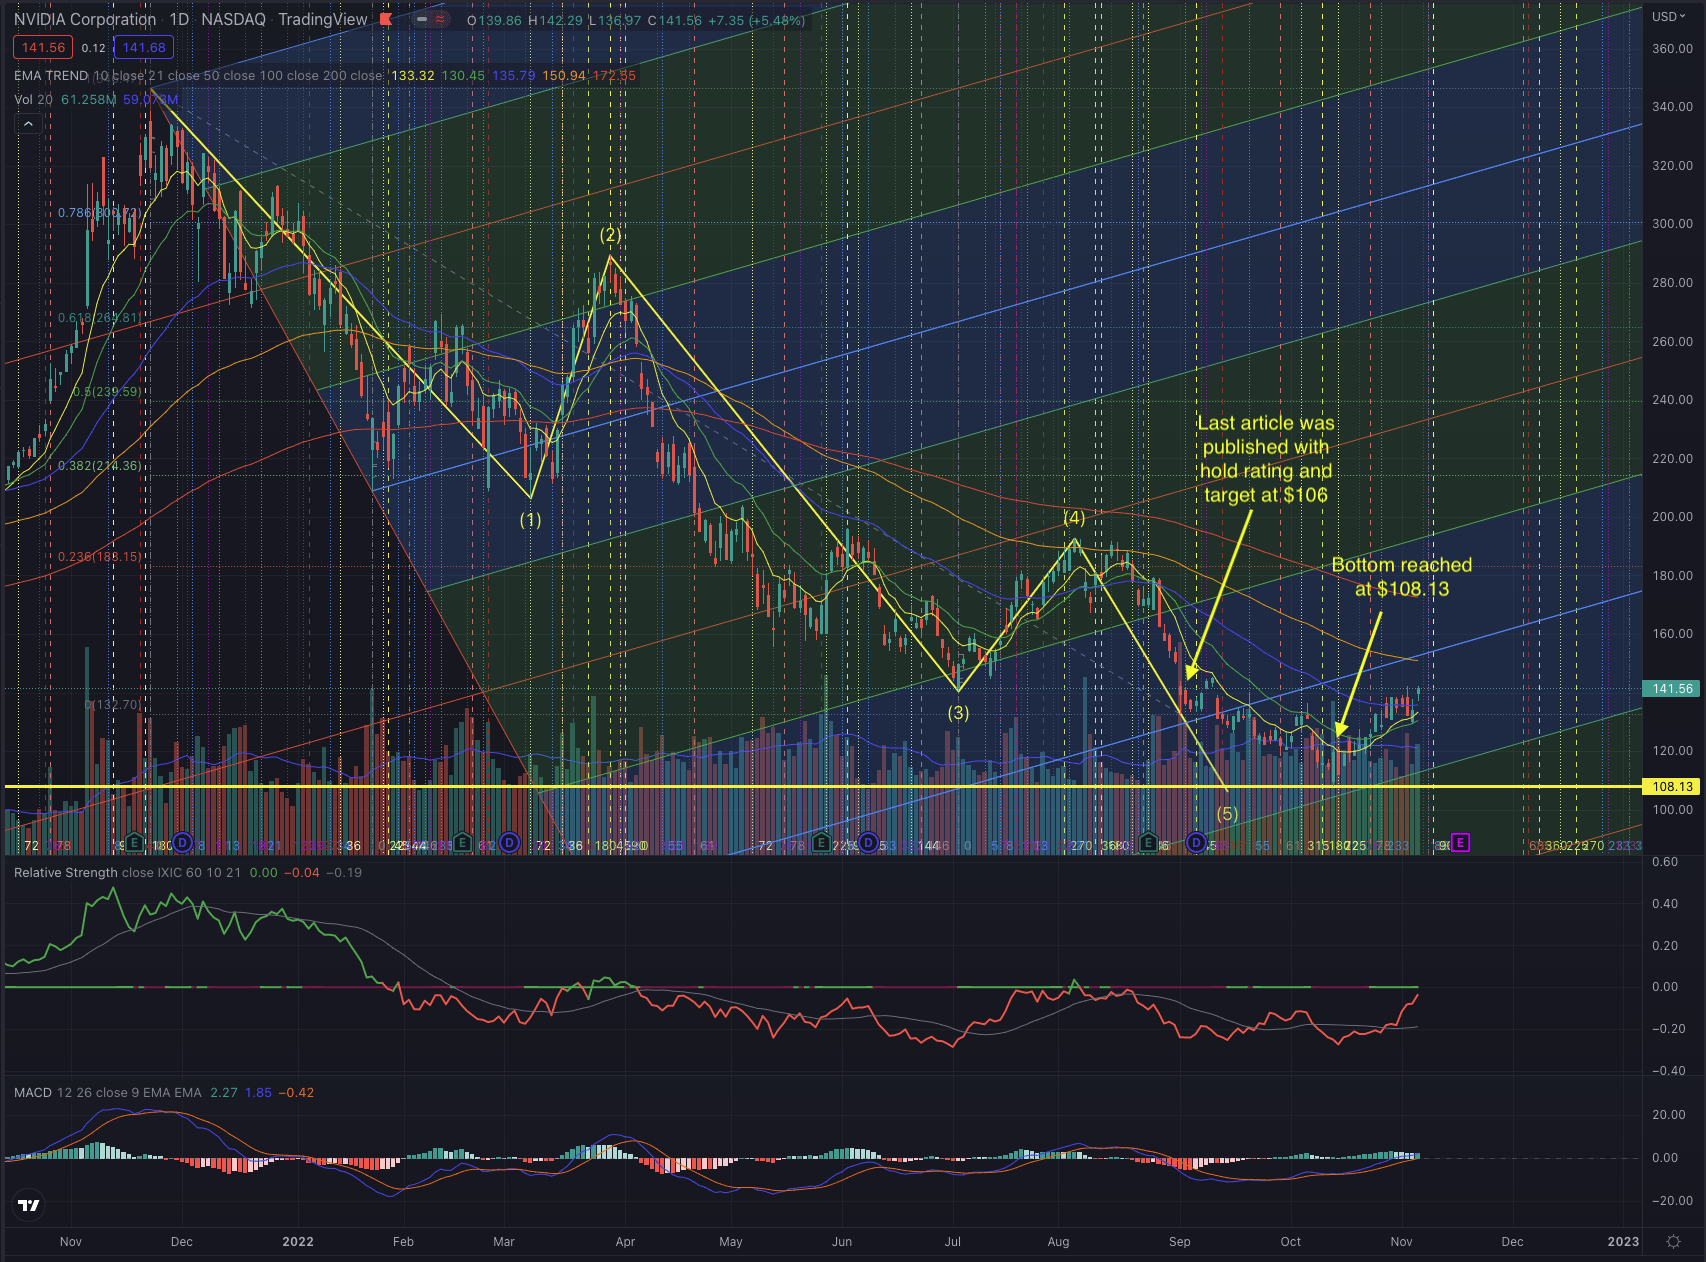
Investors who followed my call could have avoided the 20% decline and maybe even entered a long position around the announced price target. Investors who kept holding Nvidia stock are today still better off than back on September 7th, as NVDA has reported over 4% performance since.
Author, using TradingView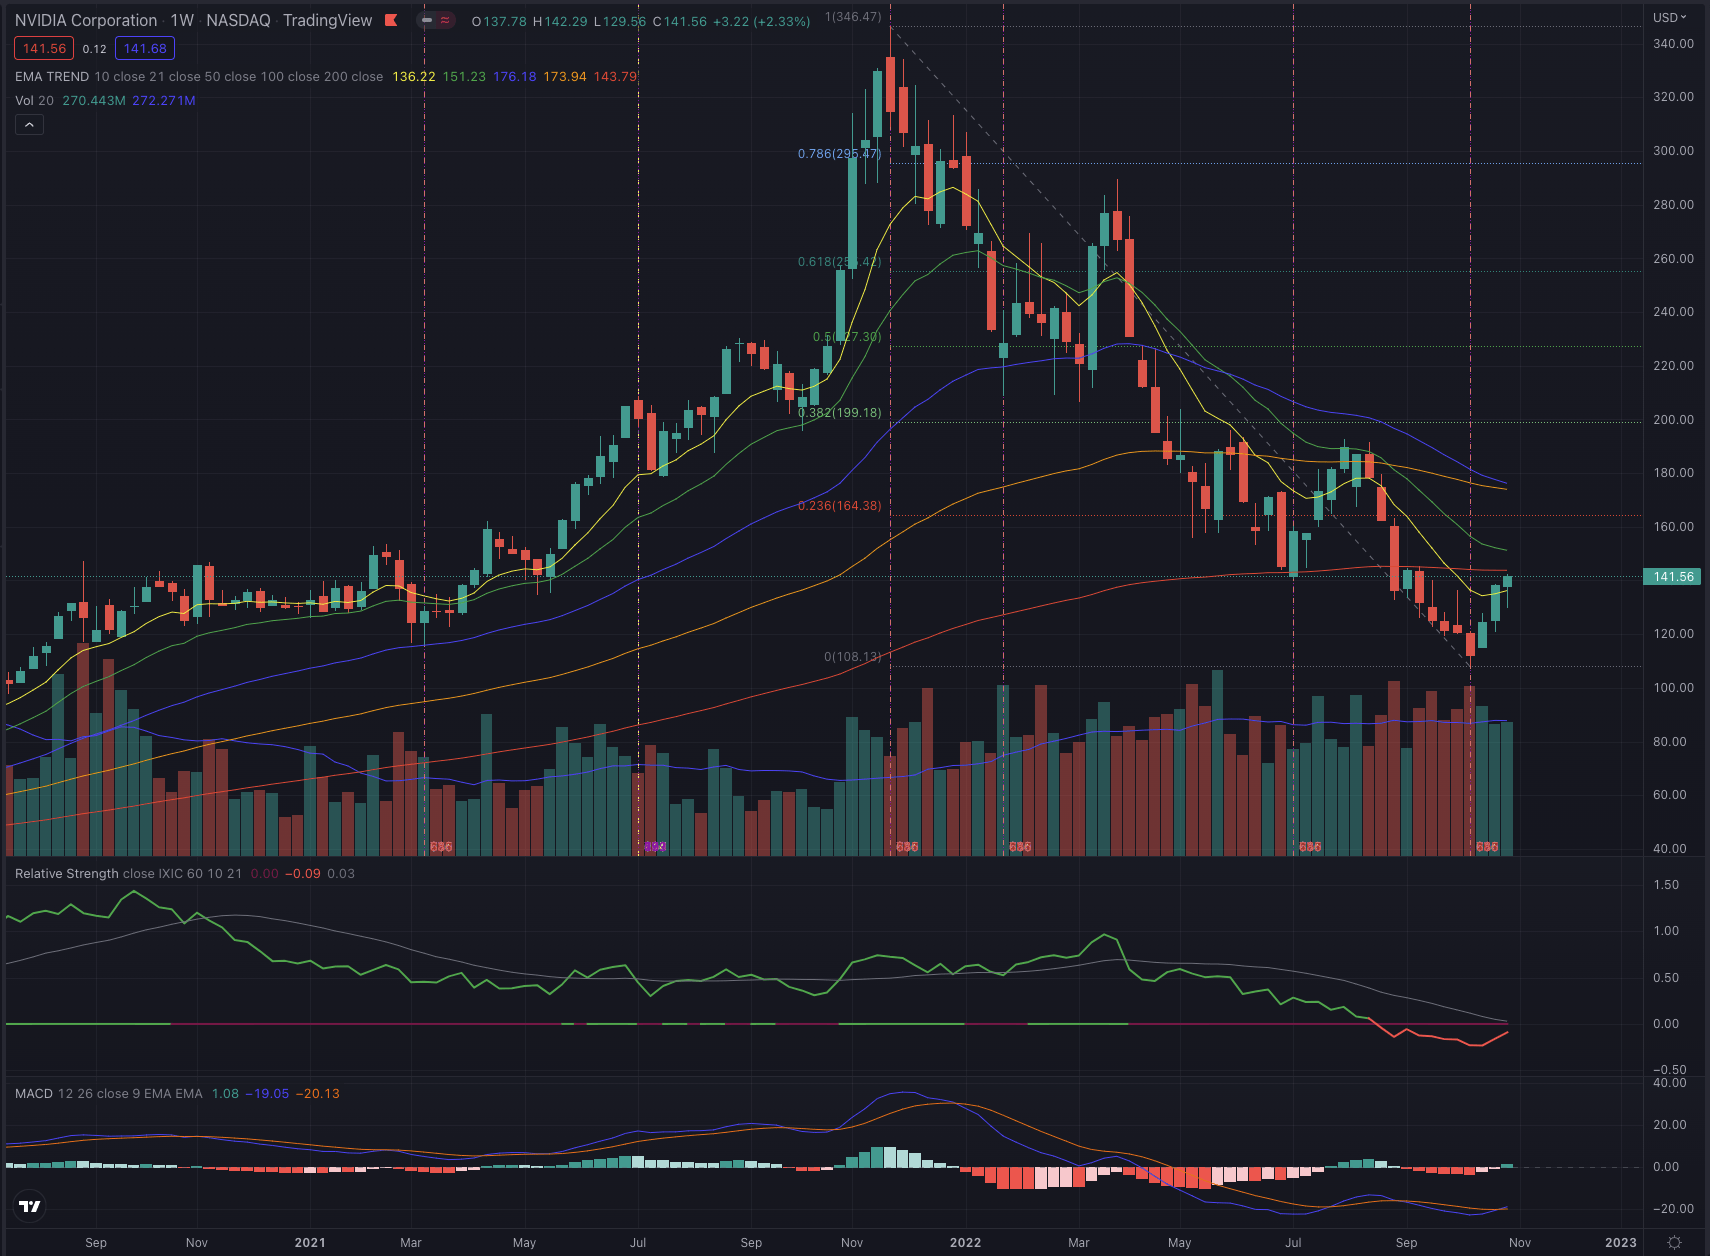
On NVDA’s weekly chart, it’s important to note how the stock is retracing the recent weeks of loss and is now facing its most relevant resistance at the EMA200. While the volume is still relatively hovering under its average, an increase could be expected if Nvidia stock tries to overcome its resistance or will be rejected. The stock is also seemingly building some strength, as we will see more in detail in the coming section.
What is coming next?
I expect the stock to continue performing positively in the short term, as it completed its Elliott Impulse sequence and could be in the process of building a sound base, while it seemingly forms its corrective wave sequence. When considering technical analysis, it’s important to look at multiple time frames to get an overview of possible situations that can form in specific intervals. NVDA closed over its EMA50 at the end of the last week, which I consider as positive, but the stock already retraced over 30% from its October bottom and could consolidate before attempting to overcome its EMA200 on its weekly chart.
Author, using TradingView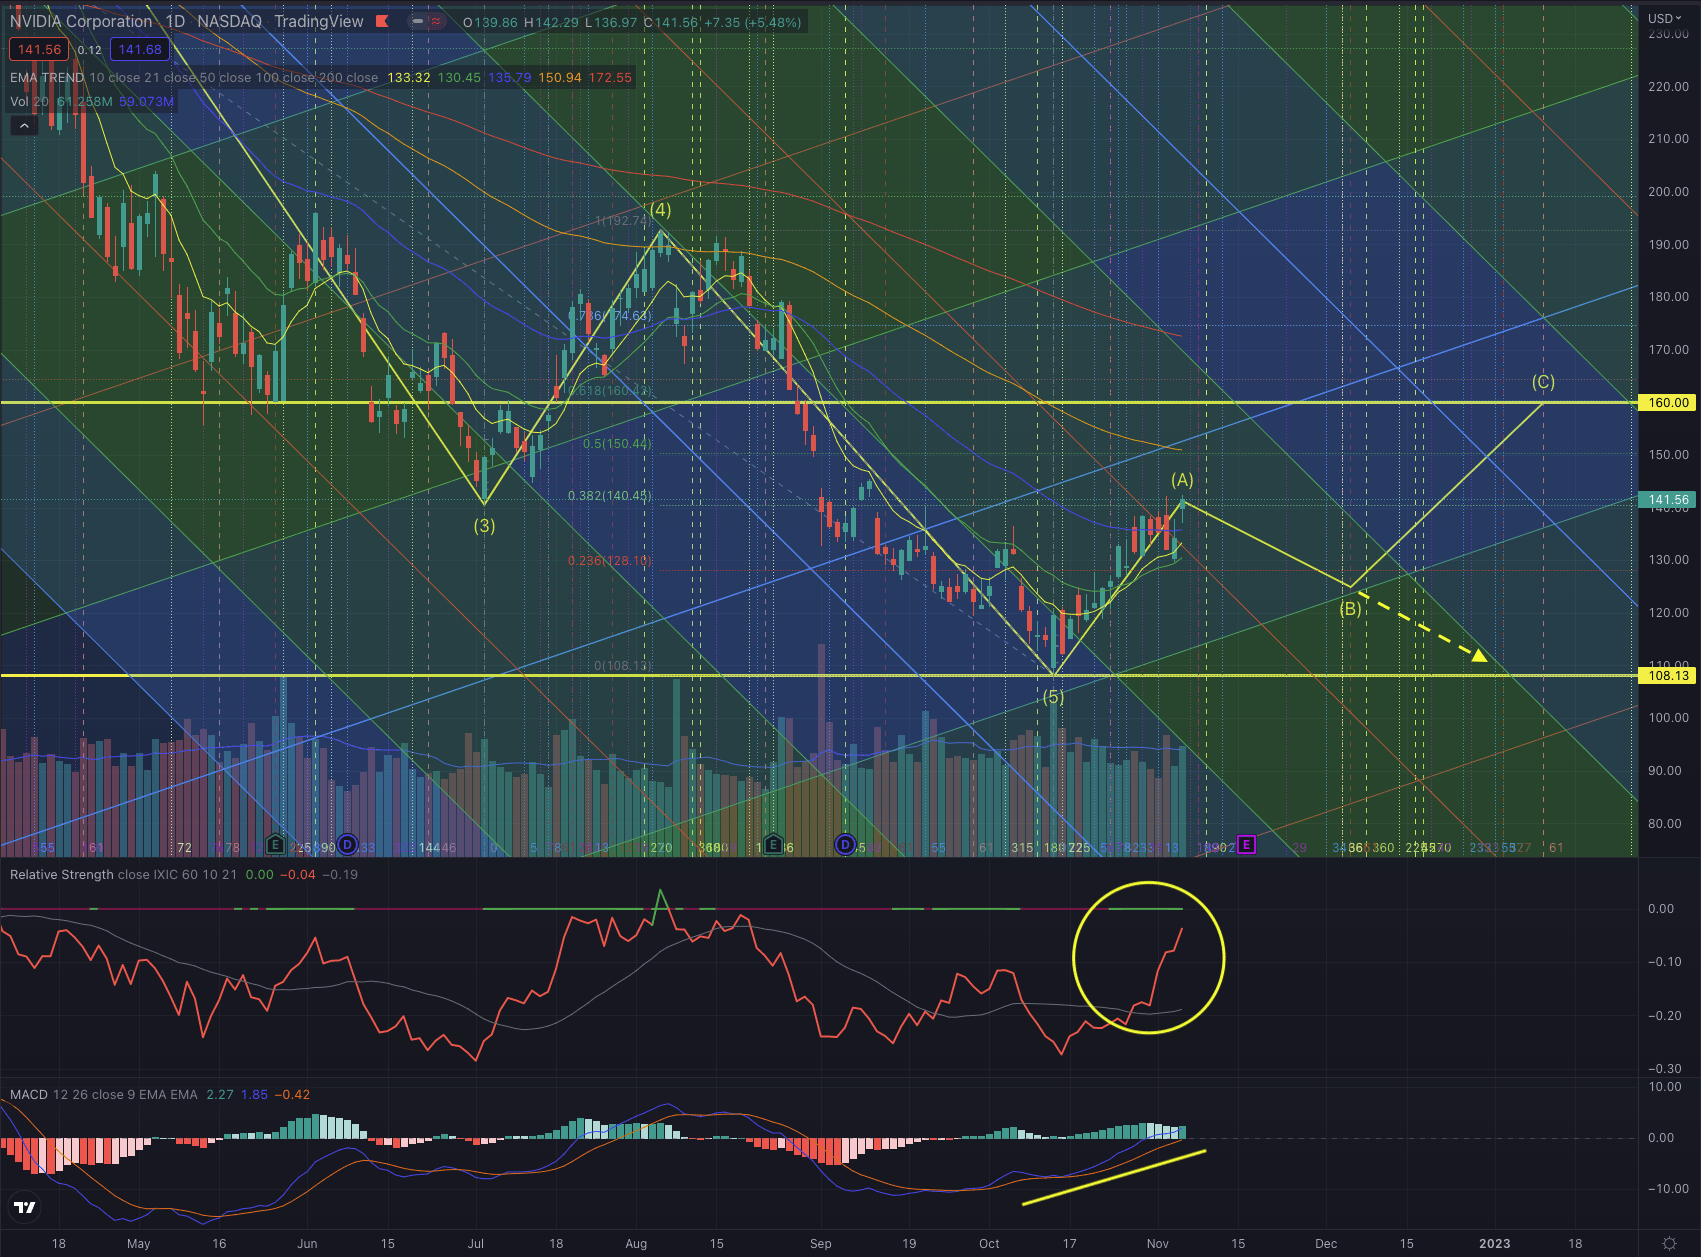
The positive momentum and the build-up of relative strength are underscoring the likelihood of further improvement in Nvidia’s stock price, but even the strongest uptrend is characterized by sporadic pullbacks. I see as likely the stock testing its closest support level, before possibly heading significantly higher. If the stock manages to overcome its EMA200 on its weekly chart, I define $160 as a likely price target from a short-term perspective. This is also a price level that is also close to the target I calculated in my valuation model in my previous article on the company.
The stock’s most important overhead resistance is now defined at around $144, $150, and by its EMA100 on its daily chart, while its closest support levels are set by its EMA50 and further down at $128. I would be careful if the stock approaches its trend channel limit, and certainly cut my exposure if it drops under either the EMA50 on higher volume or, for investors with higher risk tolerance, under $128. Although those price levels could seem close, if the stock fails in its attempt of forming its Elliott corrective sequence, the risk of seeing the stock trying to test again the low at $108 is still relatively high, as illustrated in my alternative scenario.
Investors should closely observe the price action and how Nvidia stock behaves at these crucial support levels, and how an eventual attempt to overcome its resistance is confirmed or rejected, by particularly observing the trading volume in both directions.
Long-term oriented investors who see the recent price levels as an opportunity could consider sizing their long positions accordingly, by considering a first position at the actual levels and by gradually increasing their exposure if the stock manages to overcome its EMA200. I would not consider any major position until the stock has confirmed a significant breakout over its long-term moving average.
The bottom line
Technical analysis is not an absolute instrument, but a way to increase investors’ success probabilities and a tool allowing them to be oriented in whatever security. One would not drive towards an unknown destination without consulting a map or using a GPS. I believe the same should be true when making investment decisions. I adopt techniques based on the Elliott Wave Theory, as well as likely outcomes based on Fibonacci’s principles, by confirming the likelihood of an outcome contingent on time-based probabilities. The purpose of my technical analysis is to confirm or reject an entry point in the stock, by observing its sector and industry, and most of all its price action. I then analyze the situation of that stock and calculate likely outcomes based on the mentioned theories.
The semiconductor industry is still performing relatively worse than other groups in the technology sector, but recently seemingly is building up some strength. This is leading the industry reference SMH to test the resistance in its long-term downtrend. NVIDIA has completed its Elliott impulse sequence and reached the short-term price target I announced as likely in my previous article published on September 7. The stock is seemingly forming its corrective wave sequence, after bottoming mid-October. Under the analyzed circumstances and by observing the explained actionable contingency plan with the most important resistance and support levels, I rank NVIDIA as a short-term buy, while long-term investors could progressively build up their long positions and profit from the recent price levels.
Be the first to comment