

quickshooting/iStock via Getty Images
Thesis
The main reason I decided to start writing for Seeking Alpha this year was to create a high-quality journal about my investment process. I hoped that by writing down my investment thesis in detail I would be able to review my investments periodically and learn from successes and mistakes.
In this article, I’ll revisit a part of my Ally (NYSE:ALLY) thesis I believe I got wrong. I originally wrote about ALLY in February. The article’s title, ‘Ally Bank – Poised To Benefit From Rate Hikes And Consumer Trends’, suggests that ALLY would benefit from rising interest. So far this has been completely incorrect.
I believed that ALLY would benefit from rising rates partly based on the following table from the company’s 2021 10-K.
ALLY interest rate sensitivity table (ALLY 2021 10-K)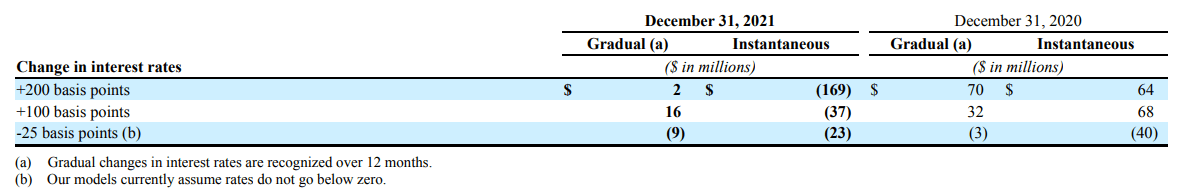
I fell into the classic mistake of assuming that the future would look like the recent past. In recent history interest rates and the forward yield curve have changed slowly. So far 2022 has seen rapidly rising interest rates and interest rate expectations.
Selected treasury yields YTD (ustreasuryyieldcurve.com)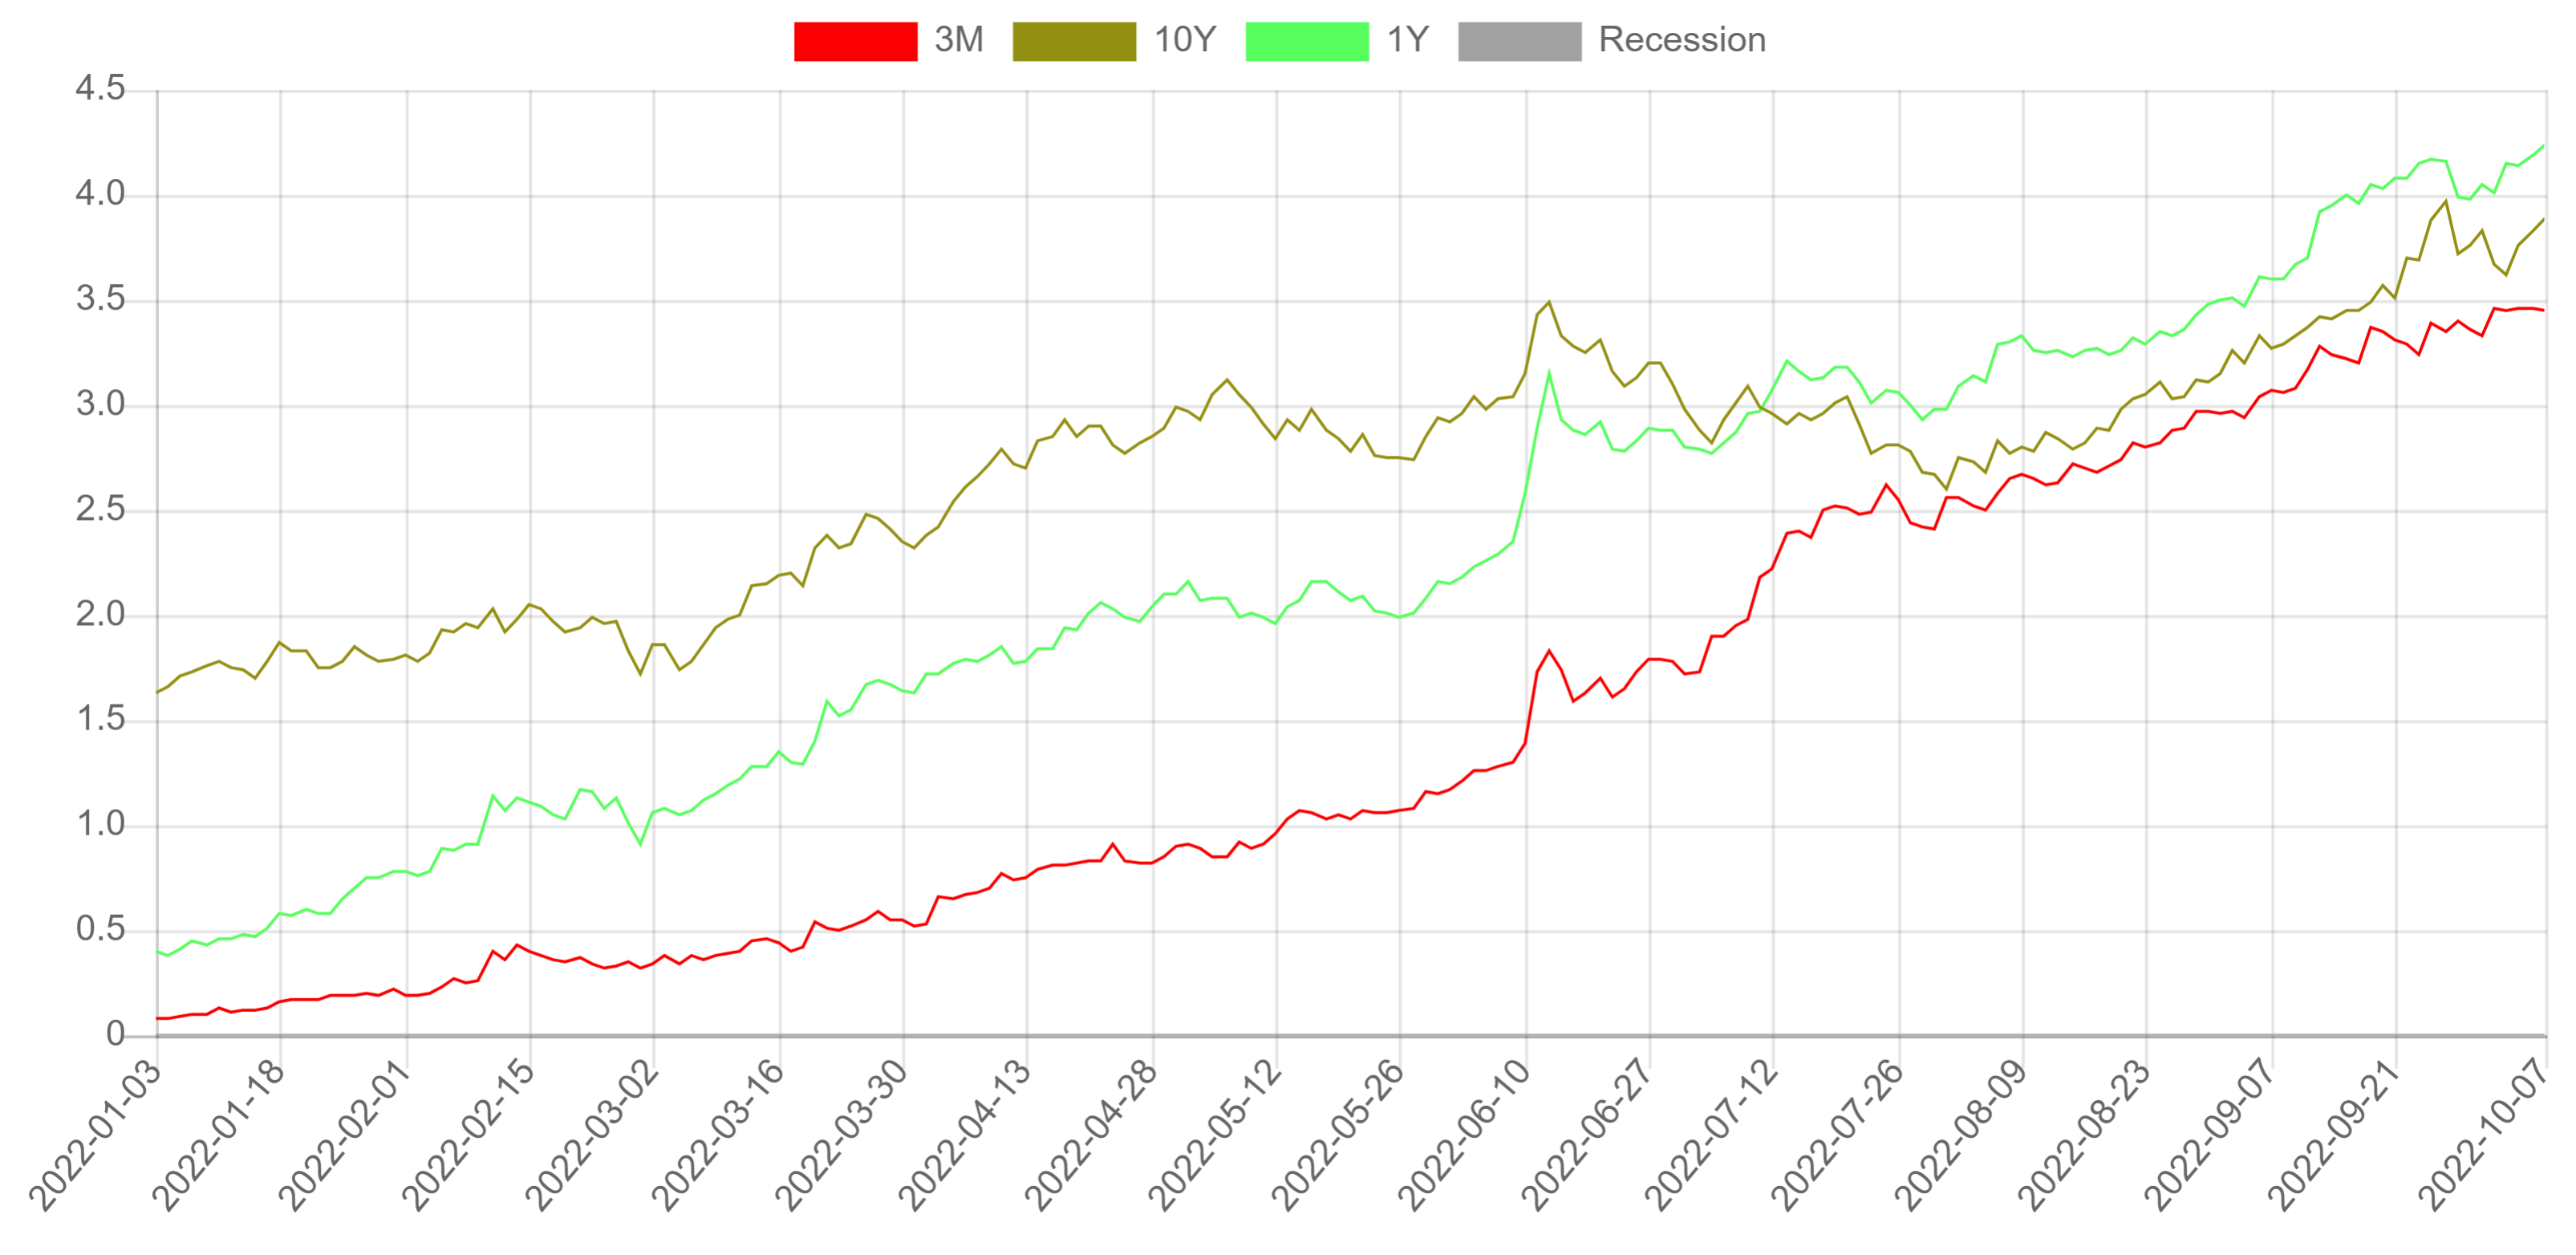
In this article, I’ll take a deeper dive into how interest rates affect Ally. I’ll then re-value the business based on where we stand today. For more details on why I believe ALLY is an attractive investment, I recommend reading my first article.
How do interest rates affect ALLY’s deposits?
The most obvious piece I got wrong was how increasing interest rates would affect ALLY’s cost of funding. Partly this was fueled by management’s discussion. During the Q4 2021 call the ALLY CFO argued that the value ALLY is providing to its deposit customers would allow it to raise interest rates on their deposits more slowly.
“When you look at the value we’re providing to our customers based on products, our digital platforms … specifically around deposit pricing, that overall rate paid will be lower in this next rising rate cycle.”
But I should have known better, I know firsthand that ALLY customers care about the interest rates on their savings accounts. While I don’t think they’ll move their money to chase an extra 10 basis points. If ALLY lags other trusted online competitors by 100 basis points, I believe people would likely move money. During the first half of the year, ALLY trailed some of its online peers in raising its interest rates by large amounts.
Concerningly ALLY lost deposits during Q2 2022. Management blamed this on outsized outflows for taxes. Total deposits in US banks dropped overall during Q2 so it was not all ALLY’s fault. But, I’m skeptical that all of the outflows were due to taxes. Management claimed that deposit inflows picked up in June and they still expected YoY deposit growth by the end of the year. June also seemed to be the time when ALLY shifted its strategy to keep up with online peers in terms of interest rates. Since then they have kept their savings interest rate close to online competitors.
But it’s not all bad news when it comes to raising rates. During periods of higher interest rates ALLY has grown its overall market share of the US deposit base. While during low-interest rate periods they have lost market share. I suspect this is because during higher interest rate periods ALLY raises its savings account rates while over the past 10 years traditional banks have always left them near 0. I’ve plotted ALLY’s start-of-year interest rate on its savings account vs its deposit market share at the end of the year over the past 10 years.
ALLY interest rate vs deposit market share (Author’s work)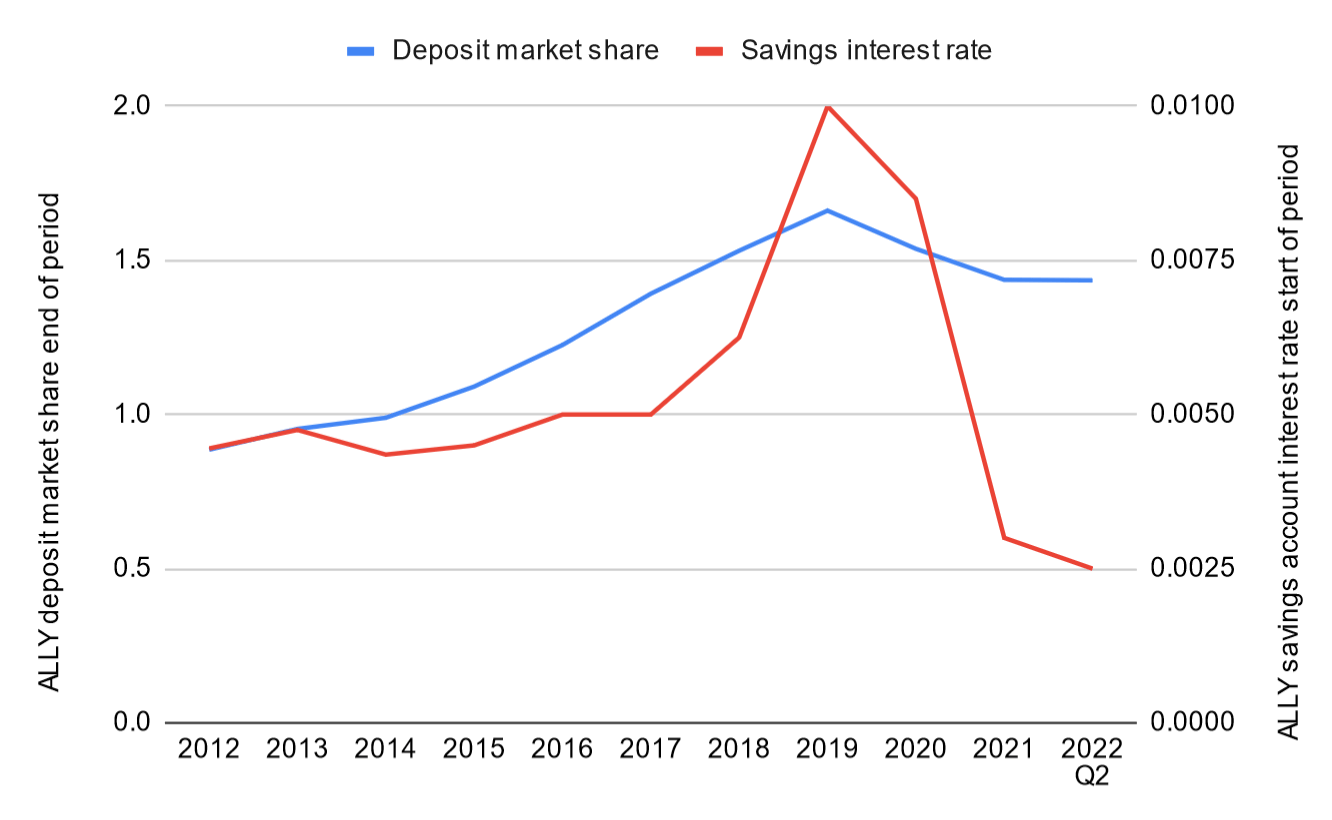
I’ve also created a scatter plot showing the relationship between the start of the year ALLY savings interest rate and the change in ALLY deposit market share. If we run a Pearson’s product correlation against this relationship we get .51 implying a moderate correlation.
ALLY savings interest rate vs change in deposit market share (Author’s work)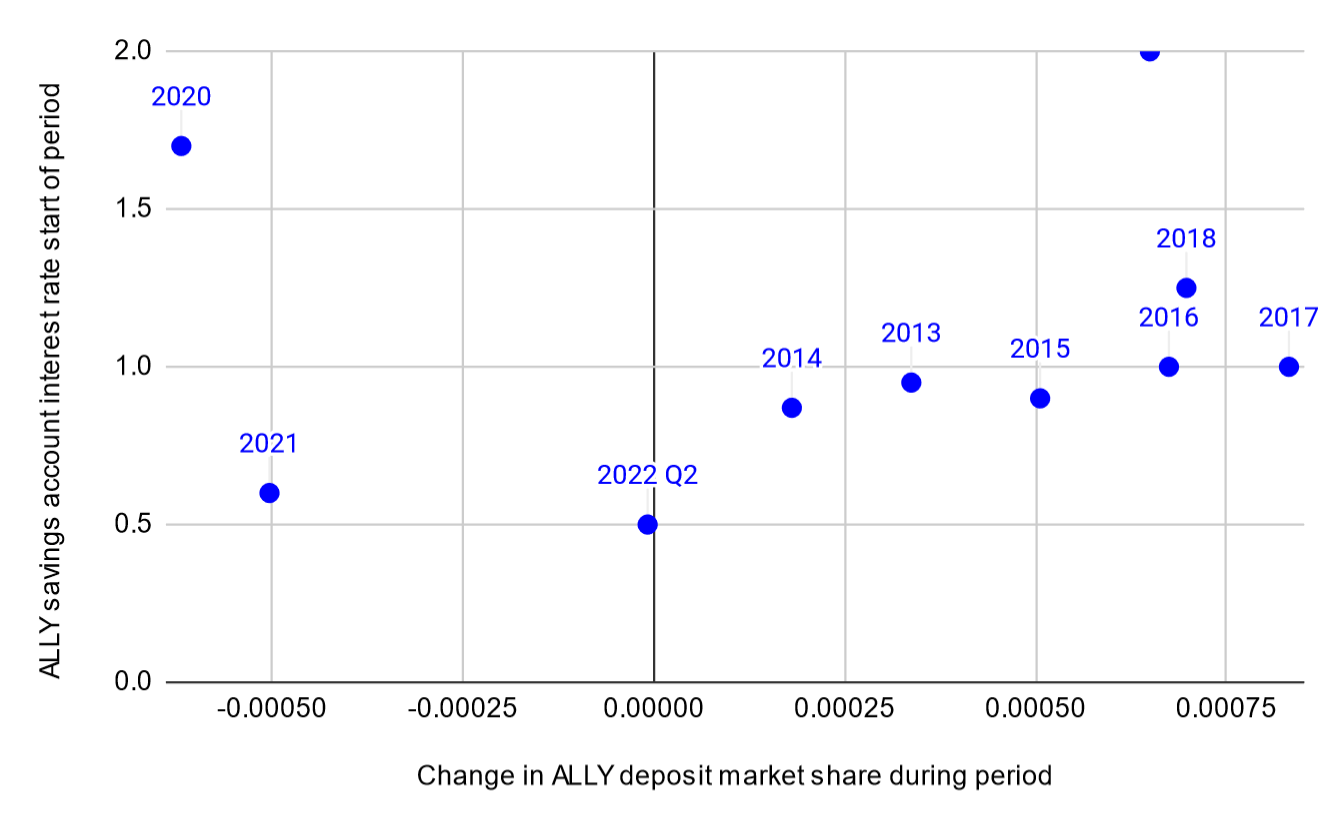
The most significant outliers are 2019 and 2020 which are years in which the Fed cut the target funds rate. ALLY’s HYSA interest rate changes more than once a year so doing something like the average savings rate for the year might be more accurate but I can’t find a real source for that data. Skeptics will also point out that the three time periods in which ALLY lost market share are the most recent periods affected by COVID and government stimulus which caused a large increase in overall US deposits.
ALLY’s deposit market share will be something I’ll be monitoring closely going forward. I’ll also be watching if ALLY matches the size of their deposit base to the size of their loan portfolio. ALLY has benefited from having a deposit base that is similar in size to its loan portfolio. I wonder if they will continue to enjoy this balance.
How do interest rates affect ALLY’s tangible equity?
ALLY holds about 35 Billion in investment securities. These investment securities are marked to market each quarter. The majority of these held-for-sale investments are mortgage-backed securities. Since these are fixed rate obligations as interest rates rise their fair value falls. Over the first 6 months of 2022, the change in fair value of their held for investment securities has resulted in $3.7B of unrealized losses. This has been the main cause of the tangible book value of the company itself falling by $3B.
Q3 saw further increases in interest rate expectations. Based on declines in S&Ps mortgage-backed securities index during Q3 I expect ALLY will report around an additional $3B in unrealized losses. This translates to a tangible book value per share of $28.25, with the share count the same as the end of Q2.
How do interest rates affect ALLY’s net interest margin?
Net interest margins are a critical component of how a bank makes money. Increases in interest rates throughout the economy can put pressure on a bank’s NIM. Since ALLY’s deposits are interest sensitive the interest rate ALLY must pay to keep them has increased rapidly. While new loans that ALLY underwrites will be at a higher interest rate they’ll need to wait for old loans to roll off their book to fully realize this benefit. As long as ALLY holds loans written at lower interest rates its NIM will be hurt.
The good news here is that ALLY does have some offsets. On the Q2 earnings, call ALLY revealed that they have interest rate hedges that flip 25% of their Auto loan portfolio to a floating rate. Their corporate, floor plan, and credit card lending are also floating rate. Overall 28% of their earning assets are floating rate or hedged to make them floating rate.
As covered in the section on ALLY’s tangible equity their investment securities are marked to market. This means that as interest rates rise, the book value of their investment securities will fall. However, the actual interest collected on their investment securities won’t change. Since their value falls and interest earned stays the same these investments are effectively floating rate when calculating NIM.
Based on Q2 average assets and liabilities
| Asset | Balance | Yield | Floating rate | Average Payback |
| Retail Auto Loan | 79695 | 6.82 | 75% No /25% Yes | 2.1 |
| Auto Lease | 10615 | 6.66 | No | 2.1 |
| Commercial Auto | 16211 | 3.65 | Yes | |
| Corporate finance | 8351 | 5.02 | Yes | |
| Mortgage | 18980 | 3.01 | No | 30 |
| Consumer Lending | 1346 | 11.94 | No | 3 |
| Credit Card | 1093 | 19.71 | Yes | |
| Cash and Equivalents | 3761 | .61 | Yes | |
| Investment securities | 35050 | 2.35 | Yes (Mark to market) |
The average payback on their current automotive book can be calculated if we assume current loans look like past loans. The others I’m taking educated guesses on.
| Liability | Balance | Interest rate | Floating rate | Average Remaining term |
| Deposits | 139814 | .76 | Yes | |
| Unsecured debt | 9674 | 5.04 | No | 2.4 |
| Secured debt | 1154 | 6.61 | No | 2.4 |
| Other borrowing | 11966 | 1.75 | Yes |
On the liabilities side, I simplified the debt structure by calculating the average remaining term and assuming debt would roll off evenly. I could have gone into more detail here but I don’t think the difference is material.
Using the above I calculated the effect of changes in the prevailing interest rates on NIM. The following graph shows the instant impact on NIM for rate changes along with the impact after 1,2 and 3 years after the interest rate increase.
Author’s work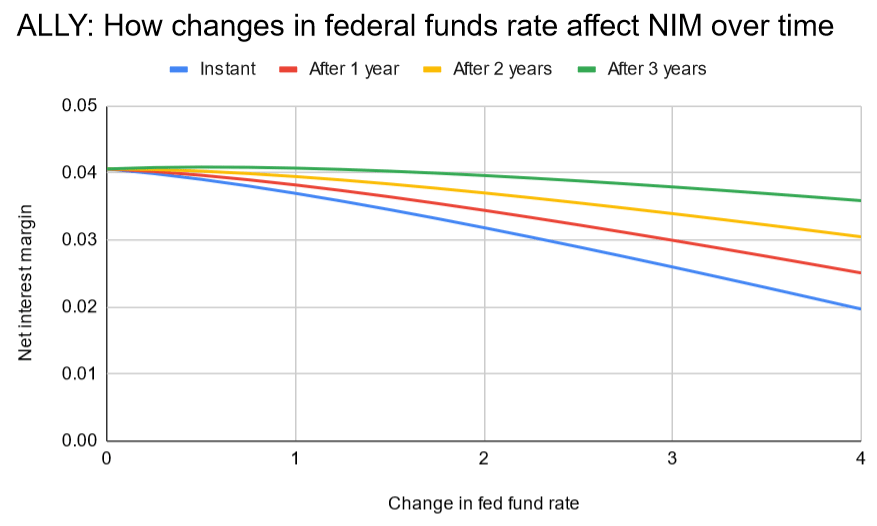
The above is an oversimplification. It doesn’t include several important factors. Changes in the composition of the size of their assets and liabilities over time. I assume that they will continue to have the same size of earning assets and liabilities as their average during Q2. How quickly floating-rate balance sheet items re-rate to the prevailing interest rates. I assume all floating rate debt and loans re-rate immediately and all new loans are written with an increase in interest rate equal to the fed fund rate. Changes in the payback habits of consumers. I assume that consumers will continue to pay off loans at the same rate as in the past. I made educated guesses about some of the smaller liabilities and asset types. Since ALLY doesn’t provide as much detail on them.
However, I do think the graph is directionally correct. The exercise left me with some key takeaways. It’s hard to understate how beneficial it is for ALLY that they are majority deposit funded and that the rate they pay on savings accounts has been able to trail changes in prevailing interest rates.
Rapidly rising interest rates are going to be hard on ALLY for the next 1-2 years. I do think management’s guide for mid-term NIM in the mid to high 3% range is reasonable. Although it may be a bumpy ride to get there. Not all banks are created equal. Banks that will benefit in a rising rate environment have low-cost sticky deposits and assets that will re-rate to higher interest rates quickly. ALLY is not one of these banks.
How interest rates affect ALLY’s earning power moving forward
When I started this investigation I was expecting that ALLY’s returns on tangible common equity would come under pressure. However, the bigger factor was a decrease in the tangible equity itself.
I expect tangible common equity to be around 8 Billion at the end of Q3. This is a huge decrease from the 13.1 Billion in common equity that ALLY had at the start of 2022.
Regardless the result is the same. I expect ALLY to earn about 1.1 Billion as a company over the next 12 months. When I wrote my original article I expected ALLY to earn about 2.2 billion in 2022. They have earned slightly over 1 Billion dollars in the first 6 months. So my projection for 2022 doesn’t look too bad. However, their medium-term outlook has deteriorated.
The risk of more interest rate increases
The US Fed has been clear in its intent to defeat inflation at any cost. ALLY doesn’t need interest rates to drop back to 0%, but they would benefit from a pause in rate increases. The 10-year treasury more than doubled from about 1.6% at the beginning of the year to 4% currently. An equivalent increase in interest rates would see the 10-year treasury increase to about 10%. While this seems unlikely, it could happen if inflation gets further out of control. If interest rates continue to increase at such a rapid rate. ALLY would likely begin needing to retain more earnings to boost its regulatory capital. At the same time, ALLY’s earnings would come under pressure from further NIM compression. I believe ALLY would be able to survive without more capital raises in this situation. But I’d expect the buyback and dividend to be stopped.
The risk of a recession
This might sound strange but a mild recession might be beneficial to ALLY. As long as auto default rates don’t spike too high. I covered this in more detail in my first article but I still believe that ALLY’s loan book is defensive. Their focus on the intersection of Auto loans and low-end prime/near-prime credit customers is critical.
If the mild recession comes with either a pause in interest rate increases or a decrease in interest rates. I’d expect ALLY to benefit as it can quickly drop the interest rate on its cost-sensitive deposits.
Valuing ALLY
I’m going to Value ALLY on a look-ahead basis from the end of Q3. I’m using the interest curve from the FED dot plot for future interest rate projections. This is a risky assumption. As we’ve shown ALLY’s earning power is strongly affected by interest rates. However, I don’t think there is a better way to do the assessment, since I’m no good at projecting macro trends. If the US enters a period of stagflation or a serious recession these projections will be way off. However, I still think looking at what normalized earnings look like is useful. As with all my DCFs, this is more a rough view of the current state of the world, rather than a prediction.
I’m assuming that ALLY’s tangible equity will be around $8B at the end of Q3 and that they will have reduced their share count by about 12 million during the quarter.
ALLY DCF (Author’s work)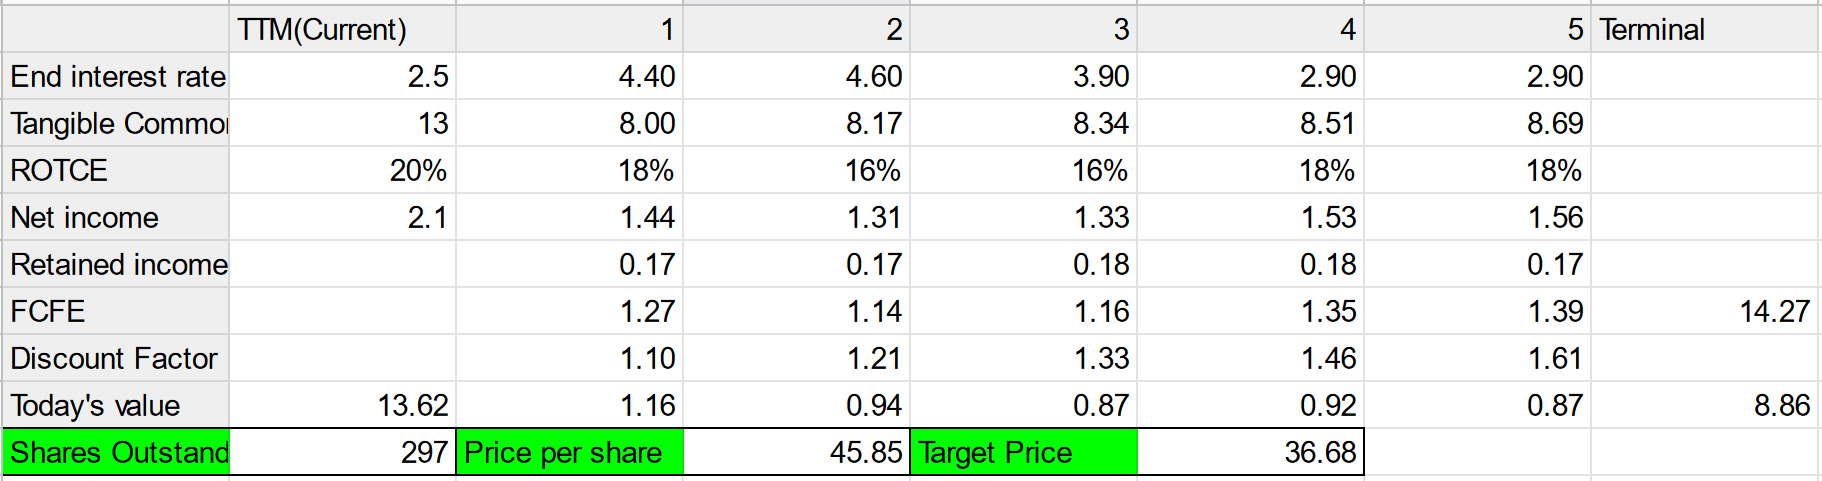
My new analysis finds a fair price per share of $45. This is a 25% decrease in fair value from the start of the year.
Final thoughts
While the current macro environment is not favorable to ALLY, I continue to believe in the core investment thesis. Of course, things may get worse, but I believe ALLY can survive. Once the dark storm clouds pass I believe ALLY should benefit from their share repurchases during these turbulent times.
I continue to own ALLY and may add more in the future. As we move forward I’ll be watching the following things closely. ALLY’s tangible common equity. ALLY’s market share of US deposits and if they can continue trailing the fed fund rate with their HYSA yield. How quickly the yield on their auto loan portfolio adjusts upward.
Be the first to comment