

Sean Pavone
Boston Properties, Inc. (NYSE:BXP) is a real estate investment trust (“REIT”) and S&P 500 component that is one of the largest publicly traded office REITs with an interest in about 200 primarily Class A properties concentrated in six markets: Boston; Los Angeles; New York; San Francisco; Seattle; and Washington D.C.
Prior to 2016, BXP had an impressive streak of outperformance against both the broader S&P 500 and related peers, such as Vornado Realty Trust (VNO), SL Green (SLG), and Alexandria Real Estate (ARE). Since then, however, shares have trailed the broader market, though they have generally fared better than both VNO and SLG, whose operations are concentrated to a single market, New York City.
The gap to the broader index has widened significantly since the start of the COVID-19 pandemic as the rise of remote/hybrid working arrangements increasingly calls into question the future of office space. The declines suffered during this period has resulted in an annualized 10-YR return of effectively 0%. For most investors, the dismal performance along with the uncertain outlook is enough to remain clear of the stock.
YCharts – Annualized 10-YR Returns of BXP Compared to Competitors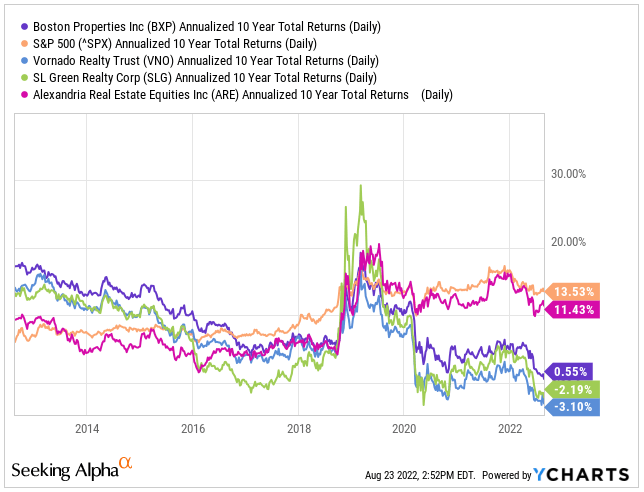
Shares, however, appear to be hovering just above oversold territory, as indicated by the relative strength indicator (“RSI”) of 33.7.
YCharts – Current RSI of BXP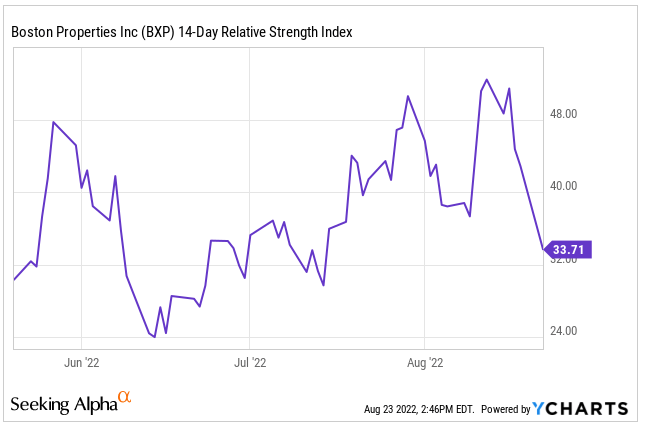
YTD, shares are now down over 30% and are trading just above their 52-week lows with a forward valuation of just 11x funds from operations (“FFO”). In comparison, shares were trading at nearly 20x at the end of 2019 and 15x at the end of 2020, a year that should have been the worst ever for the office sector, given the total shutdowns. Yet, the stock is currently trading at an even worse valuation now, despite the significantly improved operating environment.
While the overall sector certainly has its challenges, the risk/reward clearly favors an upside turn. Though the current dividend yield of 4.7% may not sound appealing to some, there is an attractive opportunity for material share price appreciation that could exceed 30%. As one of the largest office-focused landlords in the country, BXP is a sensible investment for long-term focused investors seeking a market leader for their diversified portfolios.
A Diversified Office Portfolio In Top U.S. Markets
BXP is primarily an office-focused REIT with operations concentrated on the East Coast of the U.S, with Boston and New York accounting for nearly 60% of their total rentable square footage and the only two locations to account for over 10M square feet (“sqft”) of rentable space. In addition to office exposure, BXP also has interests in retail, residential, and hotel properties, though these represent an aggregate of just 10% of rentable space.
Q2FY22 Investor Supplement – Rentable Square Feet by Geographic Market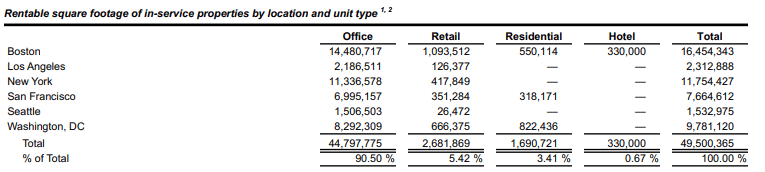
BXP’s portfolio is also more heavily weighted towards the central business district (“CBD”) of each region, except for in Washington, D.C., where the suburbs primarily drive net operating income (“NOI”).
Q2FY22 Investor Supplement – Summary of Each Market’s Share of NOI As Of Q2FY22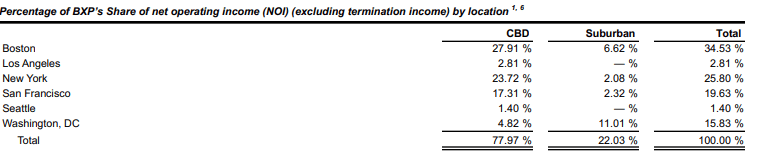
Compared to their peers, who tend to be concentrated in one major market, such as SLG’s and VNO’s presence in NYC, BXP is much more geographically diversified. This in-turn enables a greater level of industry diversification, with more exposure to Financial Services on the East Coast and the Technology names on the West Coast. This acts as a hedge to offset weaknesses in certain sectors.
BXP also has a diversified tenant base where no single tenant accounts for over 5% of annualized rental obligations (“ARO”). At 3.5%, Salesforce (CRM) is their largest tenant, followed by Alphabet (GOOG) at just under 3%.
Collectively, their top tenants accounted for approximately 12.5% of ARO at the end of June 30, 2022. The weighted average remaining lease term (“WALT”) for all but one of these tenants was also above 5 years, providing BXP with a long runway of incoming cash flows.
Q2FY22 Investor Supplement – Summary of Top Five Tenants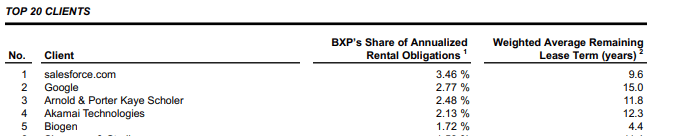
Rising Occupancy Levels With Long Weighted Average Lease Terms
At period end, overall portfolio occupancy stood at 89.5%, with the CBD carrying the weight of the lagging suburban districts. Though an improvement from prior quarters, it is worth noting that total occupancy was 90.1% at the end of 2020. The resulting declines since then were due to a combination of expirations and an overall increase in the signed but not yet commenced pipeline, which tends to create a timing differential in the occupancy data.
More importantly, current occupancy levels have displayed gains of 90 basis points (“bps”) over the last four quarters. While it is expected to decline in the coming quarters due to the pending commencement of approximately 975k/sqft of signed leases in vacant space, it is eventually expected to settle at a stabilized level of between 93-94% over the next two years.
Q2FY22 Investor Supplement – Occupancy Summary by Market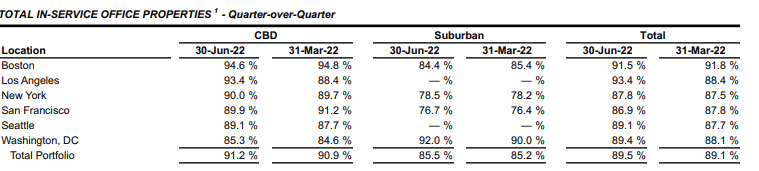
In addition to improving occupancy levels, BXP’s portfolio also will benefit from long lease terms that are currently averaging 8 years. With limited expirations for the remainder of the year and less than 5% of their total in-service square footage expiring in 2023, they face limited risks relating to increased vacancies.
While longer lease terms can be disadvantageous for some sectors due the inability to reset rates to market levels, it is of benefit to the office sector, which faces a heightened level of secular risk due to the increased adoption of remote/hybrid working arrangements. As such, tenants are more likely to demand concessions and/or discounts upon renewal. With the longer lease term locked in, however, BXP has time on their side to ride out current uncertainties at current market rates, which very well could be higher than market rates one year from now.
The Results Counter The Endangered Assets Theory
Any existential threat to the industry is not yet apparent in BXP’s quarterly results, which exhibited growth in revenues and FFO of 10% and 13%, respectively, surpassing expectations and the midpoint of management’s guidance.
In addition, BXP signed nearly 2M/sqft of new and renewal leases, their strongest leasing quarter since the third quarter of 2019. Furthermore, these signings have an average lease term of 10.9 years with gross and net spreads of 9.6% and 14.7%, respectively.
All total, BXP has signed over 6M/sqft in leases over the past 12 months. If offices were truly an endangered asset class, these tenants wouldn’t be committing themselves to the long-term use of this space at higher renewal rates. This is a further testament to the durability and quality of BXP’s Class A properties.
Q2FY22 Financial Supplement – Summary of Leasing Activity by Market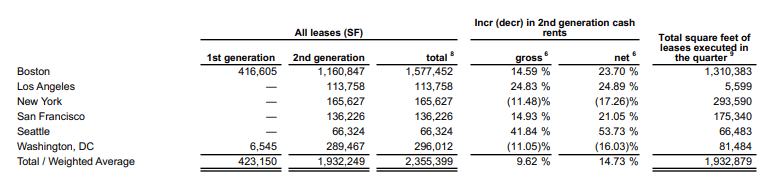
BXP also has an active development pipeline that includes 12 properties that, when completed, will have over 4M/sqft of net rentable space. At a 50% leased rate, there is ample lease-up opportunities as these properties began to reach stabilization in 2024/2025.
Additionally, there is approximately 975k/sqft of signed leases that are expected to commence through the remainder of the year and into 2023. While the effects of these commencements are expected to create a short-term drag on occupancy, they will, nevertheless, produce strong incremental revenue gains in subsequent periods.
Given the strong leasing activity and prospects, guidance was revised upwards, with full-year FFO now expected to be $0.06/share higher at the midpoint from last quarter’s guidance, which would translate to over 14% growth for the year. This was also accompanied with revisions upwards in NOI, as well as in expenses to account for higher projected interest costs.
Manageable Debt Load And Adequately Covered Dividend Payout
Though interest costs are expected to be meaningfully higher over the remainder of 2022 and into 2023, BXP’s debt load is still manageable, accounting for approximately 47% of their total market cap. As a multiple of adjusted EBITDAre, net debt stood at 7.46x. While this seems high, it’s in-line with peers, such as VNO and SLG.
BXP does stand out from peers, however, from their greater holdings of fixed-rate debt, at nearly 90% of their total load. This insulates them against the worst effects of a rising rate environment. In addition, their debt ladder is skewed towards later years.
While there are maturities in 2023, existing liquidity stands at over +$1.5B. Additional funds are also expected to be raised through asset dispositions. In addition to refinancing activities, this will be more than enough to satisfy their upcoming obligations.
Q2FY22 Financial Supplement – Debt Maturity Schedule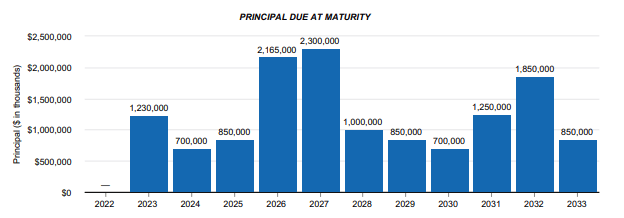
For income investors, BXP offers a quarterly payout of $0.98/share, which represents a current yield of over 4.5% at a payout ratio of approximately 77% of adjusted FFO and 55% of operating cash flows.
While the payout hasn’t been increased over the last three years, it is up from $0.80/share at the beginning of 2018. And it remained stable even through the worst months of the COVID-19 pandemic. Greater resources devoted to debt servicing costs will likely weigh on future increases, but a smaller hike can’t be ruled out, given their strong operating performance and adequate coverage ratios.
A Beaten Down S&P 500 Component With Material Upside Potential
BXP is one of the largest publicly traded office REITs that owns a portfolio of Class A properties in some of the most time-tested markets in the country. Their portfolio benefits from a greater level of geographic diversification than some of their peers, such as VNO and SLG, who operate almost exclusively in the NYC market. In addition, they also have increasing exposure to sectors poised to drive future growth, such as the Life Sciences industry.
Contrary to abundant concerns regarding the future of work, BXP continues to report strong results that are accompanied with record-setting leasing volumes. In the current quarter, for example, they completed nearly 2M/sqft of leasing activities, which was more than 160% of their first quarter leasing volumes and 140% of their long-term average leasing activity for the second quarter.
At 11x forward FFO, shares are currently trading at a lower multiple than they were over the past three years, which includes 2020, a year when their operations were effectively shut down. In 2019, shares traded at a multiple of 20x. Even if one were to discount that to 15x, which is slightly lower than what the stock fetched at the end of 2020, BXP would still be undervalued by over 30% at current pricing, excluding the 4.7% yielding dividend.
With much of the downside risk already priced in, the risk/reward clearly favors the upside. For those seeking a heavily beaten down S&P component for their long-term portfolios, BXP provides a compelling investment opportunity.
Be the first to comment