

archigram/E+ via Getty Images
Back in February, I expected Apartment REITs to outperform the REIT average this year. It hasn’t worked out that way. Thanks to inflation and the resulting rotation to high yield, Apartment REITs have taken a beating on share price this year, returning a dismal (-35.40)%, compared to the Equity REIT Index return of (-29.61)%. It has been a bad year for REITs, as they have lagged both the Dow Jones Industrial Average and the Standard & Poor’s, as the chart below shows.
Hoya Capital Income Builder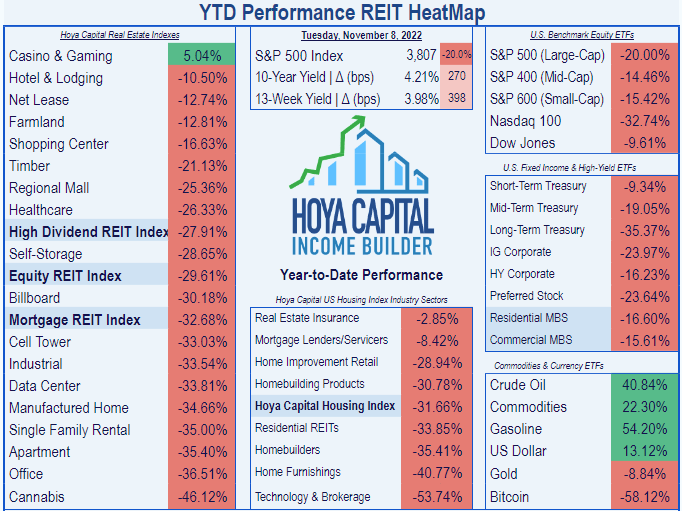
This sell-off has had nothing to do with the operational results of Apartment REITs, which have been stellar. Quarterly results all year have shown robust rent growth, historically high occupancy rates, and record-low turnover, and most Apartment REITs boosted their guidance after H1 2022.
Hoya Capital Income Builder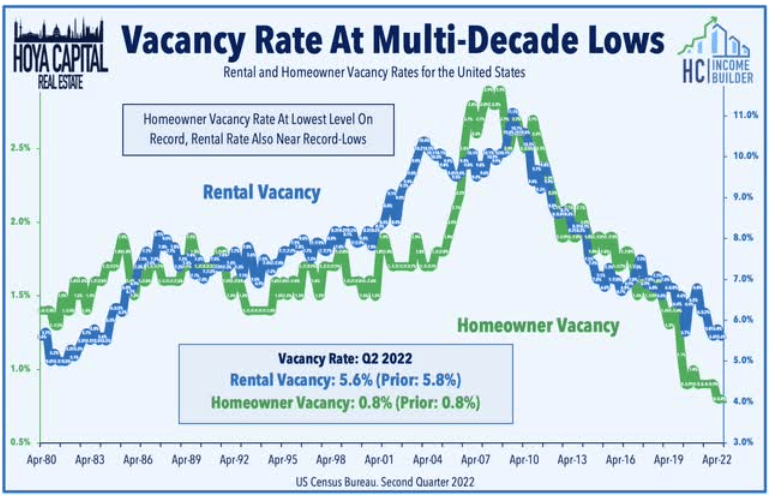
Hoya Capital Income Builder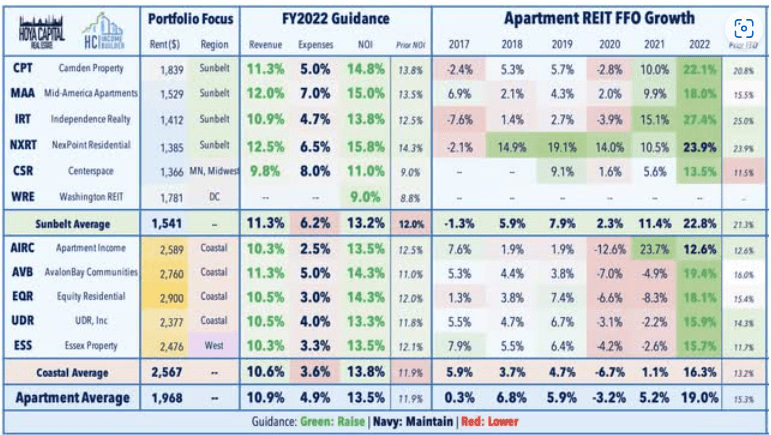
Housing remains in short supply, and the run-up in home prices in the first half of this year has priced millions of prospective buyers out of the market and into rentals, including apartments. This has spurred multifamily starts and units-under-construction to multi-decade highs, but the supply still has not caught up with demand.
Hoya Capital Income Builder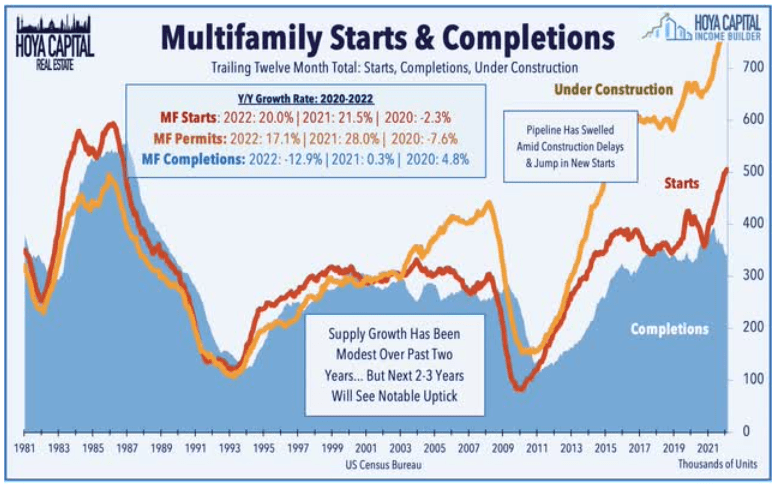
Hoya Capital Income Builder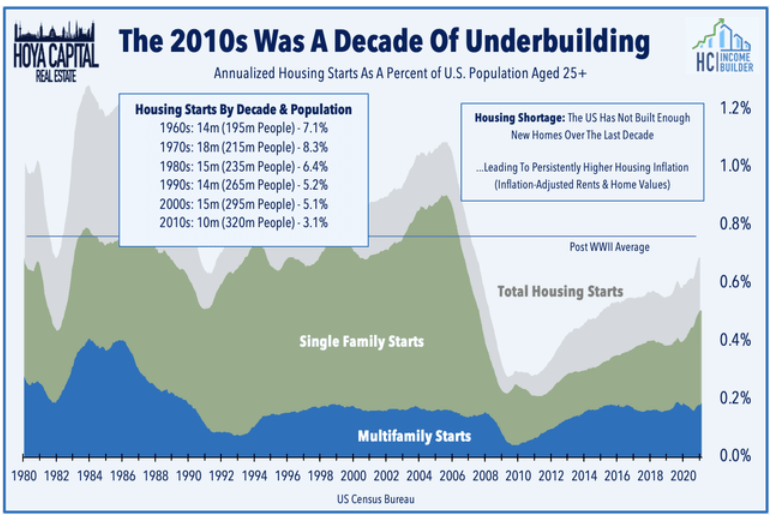
Meanwhile, household formation continues to climb, with people 25 – 34 years of age (the prime renters’ cohort) increasing in number.
Hoya Capital Income Builder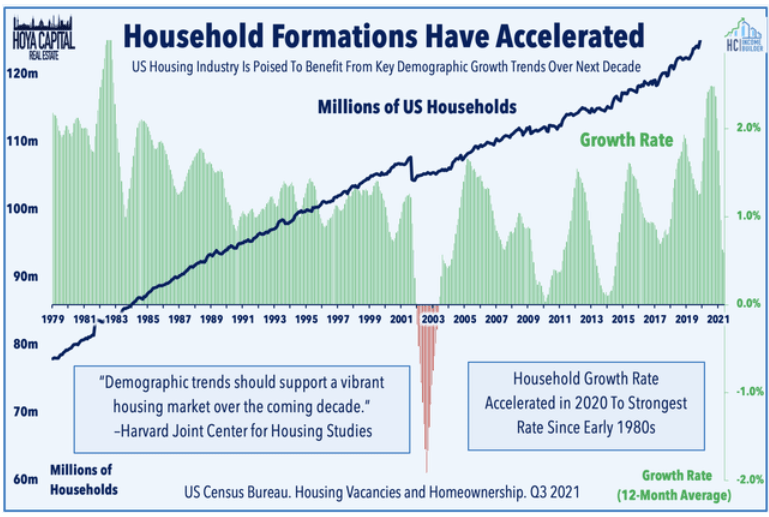
Meanwhile, the Apartment REIT sector trades at historically cheap valuations, currently averaging just 16.7x FFO for this year.
So is it time to buy Apartment REITs? If you’re leaning in that direction, here are three of the best bargains in Apartment REITs today. All three are trading at deep discounts to NAV, and all three just reported strong quarterly results.
Camden Property Trust
Camden Property Trust
Camden Property Trust (NYSE:CPT) is headquartered in Houston, and has been in operation since 1981. At latest count, CPT owned and operated 171 installations in 9 states, totaling over 58,000 units, enjoying 97% occupancy.
Company investor presentation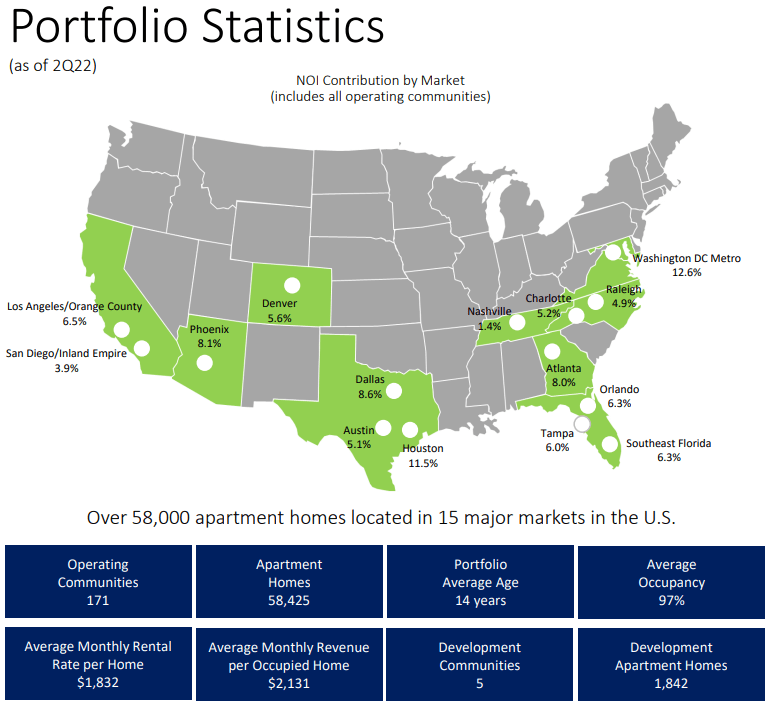
The average rent per apartment is $1832 per month, or just under $22K per year. The average tenant’s household income is approximately $106K, so these are people that could afford to buy if they wanted to.
Camden focuses on markets that are growing rapidly in population, employment, and in-migration. The chart below shows how effectively they are executing on that strategy, with over 90% of Camden’s NOI coming from the shaded markets.
Company investor presentation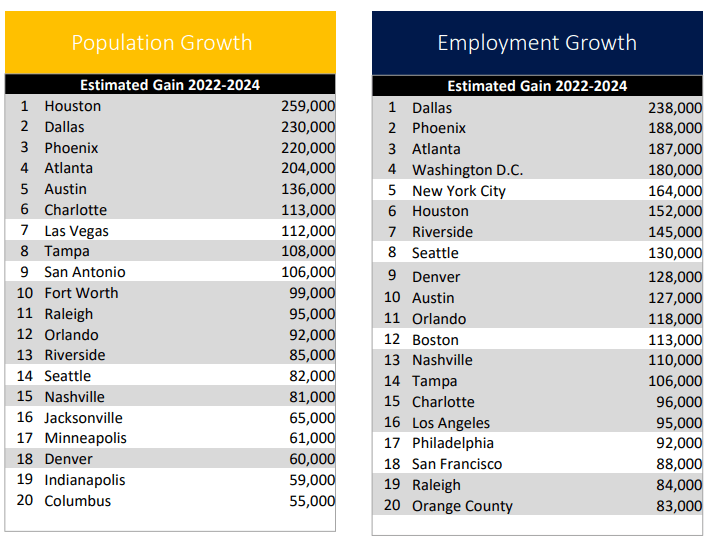
After posting steady results in pandemic-blighted 2020 and healthy numbers in 2021, Camden’s growth in FFO (funds from operations) and TCFO (total cash from operations) exploded this year, resulting in double-digit 3-year CAGR’s across the board (rounded to the nearest percent).
| Metric | 2019 | 2020 | 2021 | 2022* | 3-year CAGR |
| FFO (millions) | $505 | $496 | $522 | $704 | — |
| FFO Growth % | — | (-1.8) | 5.2 | 34.9 |
11.8 |
| FFO per share | $5.04 | $4.90 | $5.39 | $6.63 | — |
| FFO per share Growth % | — | (-2.8) | 10.0 | 23.0 | 9.6 |
| TCFO (millions) | $556 | $519 | $577 | $769 | — |
| TCFO Growth % | — | (-6.7) | 11.1 | 33.3 | 11.5 |
Source: TD Ameritrade, Hoya Capital Income Builder, and author calculations
* Projected, based on results through Q3 2022.
CPT’s balance sheet is pure steel, bond rated at A-, with excellent liquidity, and very low debt ratio and debt/EBITDA.
| Company | Liquidity Ratio | Debt Ratio | Debt/EBITDA | Bond Rating |
| CPT | 2.15 | 15% | 4.6 | A- |
Source: Hoya Capital Income Builder, TD Ameritrade, and author calculation
Camden’s Yield is low, even for an Apartment REIT, and its dividend is too safe at a grade of A, but lots of cash plus depressed valuation is a formula for dividend increases. CPT has raised its dividend by 13% this year alone, and further increases seem likely.
| Company | Div. Yield | 3-yr Div. Growth | Div. Score | Payout | Div. Safety |
| CPT | 3.42% | 5.5% | 4.02 | 60% | A |
Source: Hoya Capital Income Builder, TD Ameritrade, Seeking Alpha Premium
Dividend Score projects the Yield three years from now, assuming no change in the dividend growth rate.
Camden’s Price/FFO ’22 is dead average at 16.7, but it trades at a steep (-26.4)% discount to NAV (Net Asset Value).
| Company | Div. Score | Price/FFO ’22 | Premium to NAV |
| CPT | 4.02 | 16.7 | (-26.4)% |
Source: Hoya Capital Income Builder and Seeking Alpha Premium
The company recently reported Q3 2022 results, showing a sparkling 25% increase in FFO in the third quarter and YTD, and a 16% increase in same-property NOI (Net Operating Income) for Q3 and YTD, compared to the same periods last year. Lease spreads came in at a healthy 8.0% for renewals, 11.3% for new leases, and 9.7% blended, and the company raised its guidance for both FFO and earnings per share. According to TipRanks, Camden has realized an 18% return on equity over the past 12 months, while growing its assets by 22%.
Camden offers sensational growth, a rock-solid balance sheet, and an attractive price.
Apartment Income REIT
Apartment Income REIT
Headquartered in Denver, mid-cap Apartment Income REIT (NYSE:AIRC) separated from parent company Aimco (AIV) in September of 2020, and owns 80 properties totaling over 23,000 units, across 8 primary high-demand U.S. markets:
- Boston
- Philadelphia
- Washington, D.C.
- South Florida
- San Francisco
- Los Angeles
- San Diego
- Denver
Their largest concentration by NOI (net operating income) is in Los Angeles, with 20%, and the smallest concentration is in Denver, at 7.8%.
Company investor presentation
The company’s growth in revenue and cash flows has been in double digits each of the past three years, including pandemic-stricken 2020.
| Metric | 2020 | 2021 | 2022* | 2-year CAGR |
| FFO (millions) | $193 | $171 | $332 | — |
| FFO Growth % | — | (-11.4) | 94.2 | 31.16% |
| FFO per share | $1.73 | $2.14 | $2.37 | — |
| FFO per share growth % | — | 23.4 | 10.7 | 17.4% |
| TCFO (millions) | $283 | $333 | $402 | — |
| TCFO Growth % | — | 17.7 | 20.7 | 19.2% |
Source: TD Ameritrade, CompaniesMarketCap.com, and author calculations
*Projected, based on H1 2022 results
The company’s balance sheet is solid. Although there is caution in the slightly low Liquidity Ratio of 1.58 and slightly above-average Debt Ratio of 30%, EBITDA is healthy enough to address the debt effectively, and the balance sheet is bond rated at BBB.
| Company | Liquidity Ratio | Debt Ratio | Debt/EBITDA | Bond Rating |
| AIRC | 1.58 | 30% | 5.3 | BBB |
Source: Hoya Capital Income Builder, TD Ameritrade, and author calculations
Although Apartment REITs typically pay current Yields a bit below the REIT average, AIRC pays considerably higher than the REIT average, at 4.92%.
| Company | Div. Yield | 3-yr Div. Growth | Div. Score | Payout | Div. Safety |
| AIRC | 4.92% | 3.4% | 5.44 | 80% | D |
Source: Hoya Capital Income Builder, TD Ameritrade, Seeking Alpha Premium
Apartment Income REIT really stands out when it comes to value. Despite its FROG-like growth and its sterling dividend score, AIRC trades at a significant discount to both the REIT average Price/FFO ’22 and its own NAV (Net Asset Value).
| Company | Div. Score | Price/FFO ’22 | Premium to NAV |
| AIRC | 5.44 | 15.3 | (-23.8)% |
Source: Hoya Capital Income Builder, TD Ameritrade, and author calculations
AIRC recently reported Q3 2022 same-property revenue up 9.6% and same-property NOI up 13.3%. FFO for the quarter was up 12.8% YoY, and for the year thus far FFO was up 30.3%. The company is guiding for continued sizzling growth of 12.6% in FFO for the full year 2022. TipRanks shows that insiders have bought almost $20,000 worth of shares in the last 3 months, the company has realized 53% return on equity, and it has grown its assets by 4.5%
AIRC offers a remarkable combination of rapid growth and high yield, at a below-average price.
Essex Property Trust
Headquartered in San Mateo, California, Essex Property Trust (NYSE:ESS) has been in operation for over 40 years, and a REIT since 1994. ESS owns 253 apartment communities in 8 major West Coast markets, totaling about 62,000 units. The company divides these into three regions:
- Northern California (85 communities)
- Southern California (104 communities), and
- Seattle Metro (59 communities).
Essex deals in high-end apartments (average rent near $2800 per month), and is benefitting from the return to office of high-tech workers displaced by the pandemic. ESS is riding a wave of superior job growth in its West Coast markets, that started in the latter half of 2021, and continues to this day.
Company investor presentation
FFO and cash flow growth figures for ESS have been stable rather than spectacular over the past three years.
| Metric | 2019 | 2020 | 2021 | 2022* | 3-year CAGR |
| FFO (millions) | $936 | $865 | $941 | $877 | — |
| FFO Growth % | — | (-7.6) | 8.8 | (-6.8) | (-2.15)% |
| FFO per share | $13.38 | $12.82 | $12.49 | $14.45 | — |
| FFO per share growth % | — | (-4.2) | (-2.6) | 15.7 | 2.60% |
| TCFO (millions) | $919 | $803 | $905 | $1,020 | — |
| TCFO Growth % | — | (-12.4) | 12.7 | 12.7 | 3.54% |
Source: TD Ameritrade, CompaniesMarketCap.com, and author calculations
*Projected, based on H1 2022 results
ESS has a sturdy balance sheet that is bond rated. The Debt/EBITDA of 6.0x has improved considerably from 6.5 in Q1 2022.
| Company | Liquidity Ratio | Debt Ratio | Debt/EBITDA | Bond Rating |
| ESS | 1.82 | 22% | 6.0 | BBB+ |
Source: Hoya Capital Income Builder, TD Ameritrade, and author calculations
The weighted average interest rate on Essex’s $6 billion debt is nice and low, at 3.2%, and debt maturities are smoothly distributed and pushed back, with just 12% due between now and the end of 2024.
Company investor presentation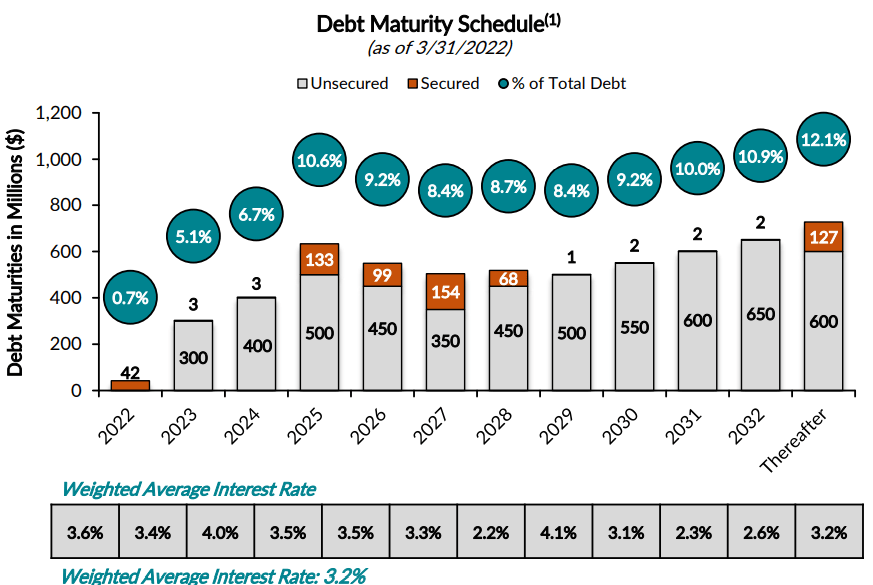
ESS qualifies as a Dividend Aristocrat, thanks to 28 consecutive years of dividend growth. Thanks to this year’s sell-off, and the company’s continued growth in dividends, the Yield for ESS and the Dividend Score now are both slightly above the REIT average, which is unusual for an Apartment REIT.
| Company | Div. Yield | 3-yr Div. Growth | Div. Score | Payout | Div. Safety |
| ESS | 4.20% | 4.1% | 4.88 | 60% | B |
Source: Hoya Capital Income Builder, TD Ameritrade, Seeking Alpha Premium
ESS is bargain priced at just 14.6x FFO ’22, and trades at a whopping (-30.2)% discount to NAV.
| Company | Div. Score | Price/FFO ’22 | Premium to NAV |
| ESS | 4.88 | 14.6 | (-30.2)% |
Source: Hoya Capital Income Builder, TD Ameritrade, and author calculations
Essex recently reported FFO for Q3 2022 is up 3.3% and for the year so far is up 2.7%, compared to the same period last year, but Core FFO up 18.3% for Q3 and 16.3% YTD, compared to last year. Same-property NOI growth for Q3 came in 15.4% higher than Q3 2021. The company raised full-year net income per share guidance from $4.80 to $4.90, and full-year Core FFO guidance to $14.47 per share at the midpoint, up 15.9% from a year ago. ESS has achieved a 12% return on equity over the past 12 months.
If you are looking for stability, with an above-average Yield, selling at a steep discount, ESS is a good candidate.
Investor’s bottom line
There are eight Apartment REITs on sale right now, at strong discounts to fair value. These are not crappy, struggling REITs with shrinking revenues and soaring debts. They are healthy, bustling companies with sturdy to extra-strong balance sheets, that just happen to be selling at great prices. Hoya Capital Income Builder makes it easy to spot them. Camden (CPT), Essex (ESS), and Apartment Income (AIRC) are three of the best.
Be the first to comment