

Dilok Klaisataporn/iStock via Getty Images
In last week’s note, we laid out our case as to why a walk-back might be in the cards – as it relates to the Fed’s ultra-hawkish stance:
As Hawkish As It Gets; Walk-Back On The Way?
This week we made the case in the following media appearances and here are some themes (Show Notes) I covered in the segments:
Seasonal Weakness:
Stock Market: Weakest Month of the Year is September. Weakest week of the year is this week.
S&P 500 down 22% ytd while earnings estimates down only 3%.
Like June Lows: Expectations low into earnings season. +3.2% growth (low bar, expect upside surprise).
Federal Reserve:
Biggest Policy Mistakes of 110yr history of Federal Reserve:
December 2018: His first “Auto-pilot” error caused a 16.5% crash before Christmas. Secretary Mnuchin had to call 6 bank CEOs to provide liquidity to markets before Powell walked back his statement and the market recovered to new highs in a few months.
September 2021:
2022 GDP estimate +3.8%.
PCE Inflation was 4.2%.
Fed funds rate 0.1%.
September 2022:
2022 GDP estimate +0.2%.
PCE Inflation now falling.
Fed funds rate 2023 est 4.6%
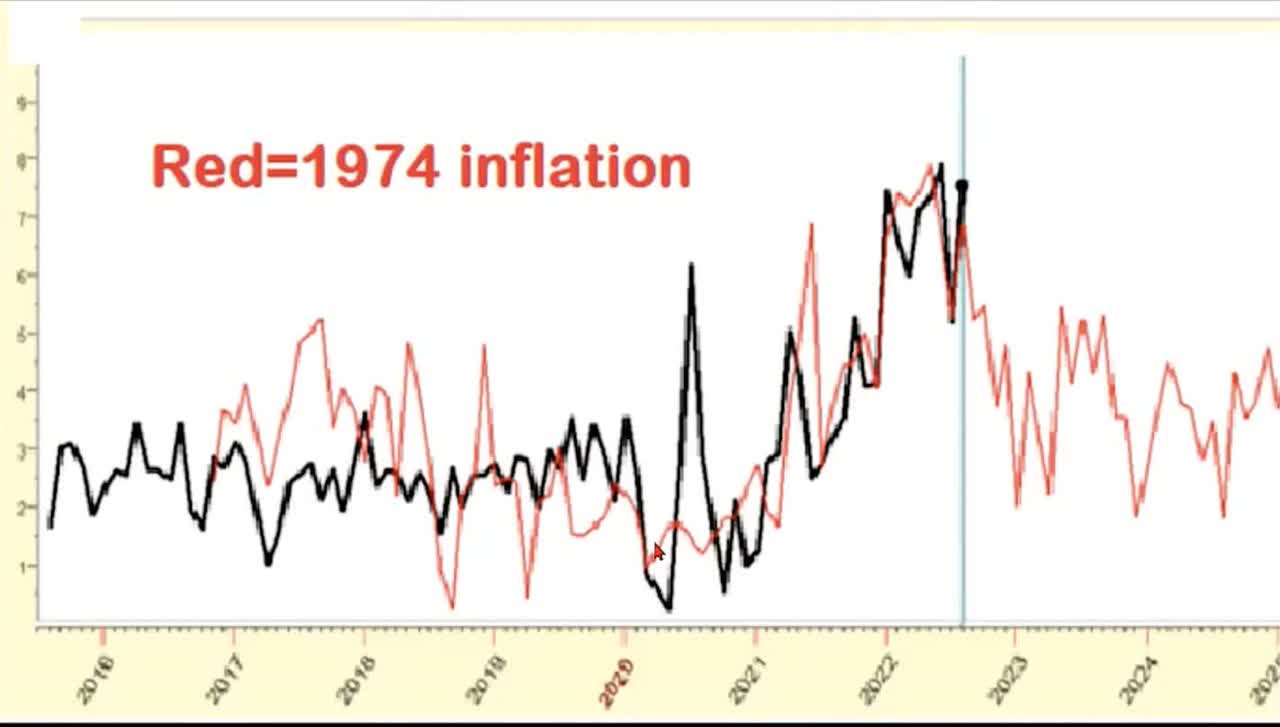
Winston Churchill, “Generals are always prepared to fight the last war.”
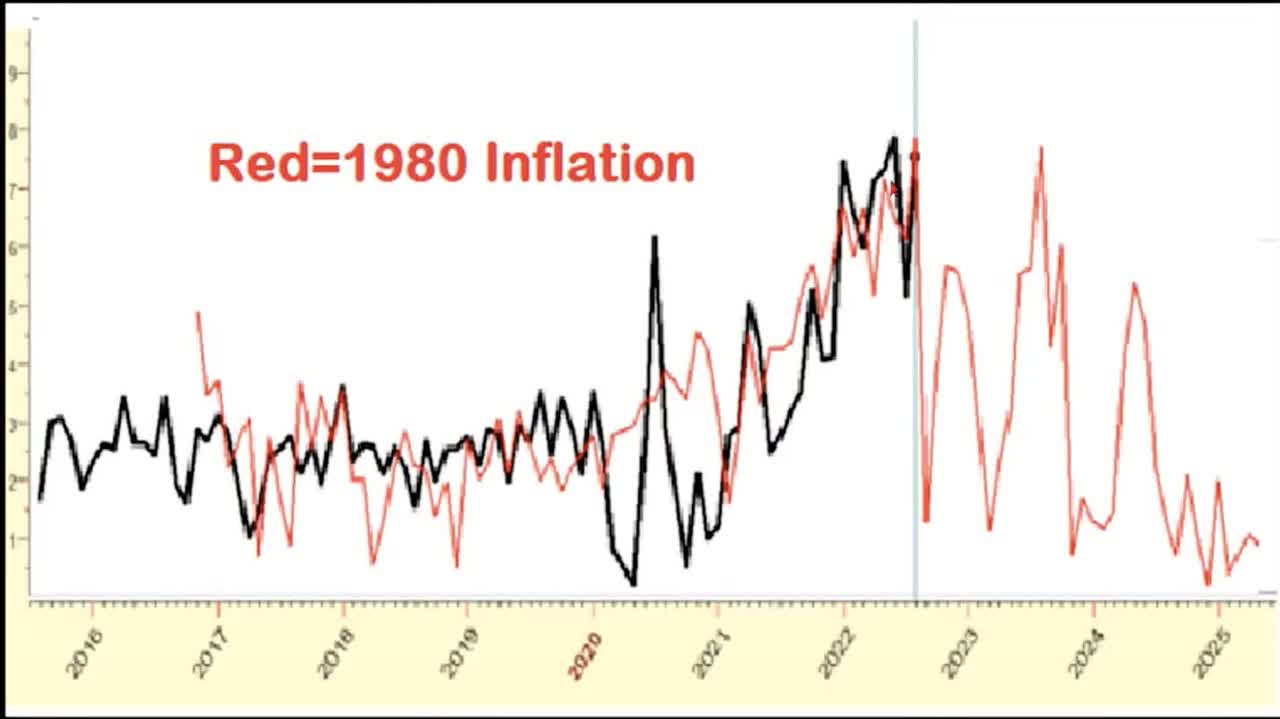
Powell called inflation transitory when it was roaring and now wants to be Volker when it is collapsing.
Powell and Co. will have to walk-back their hawkishness and here is why:
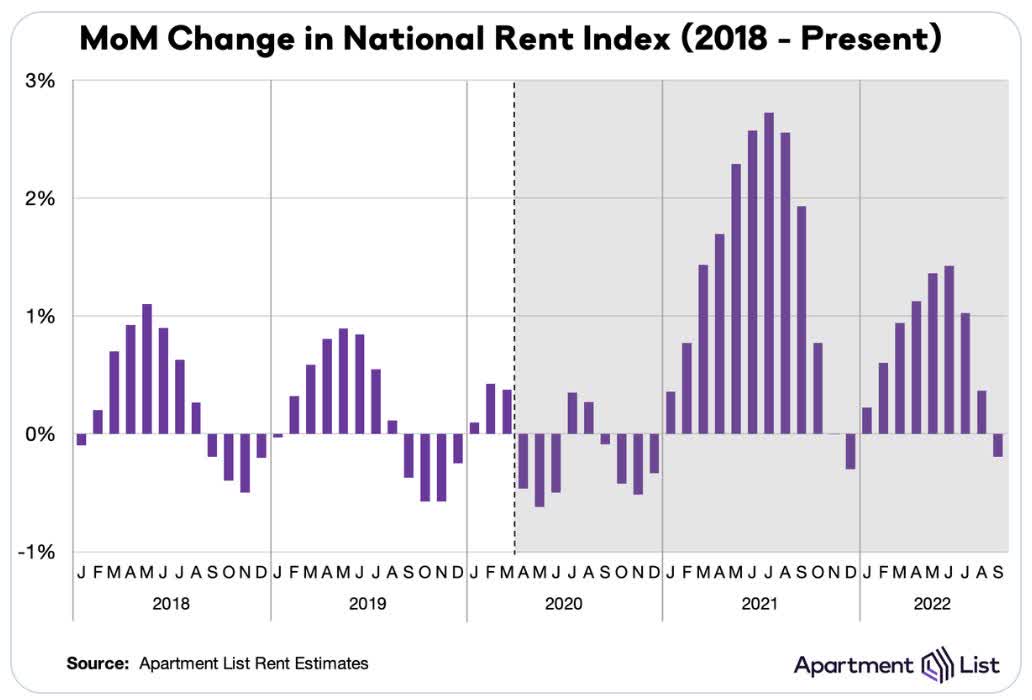
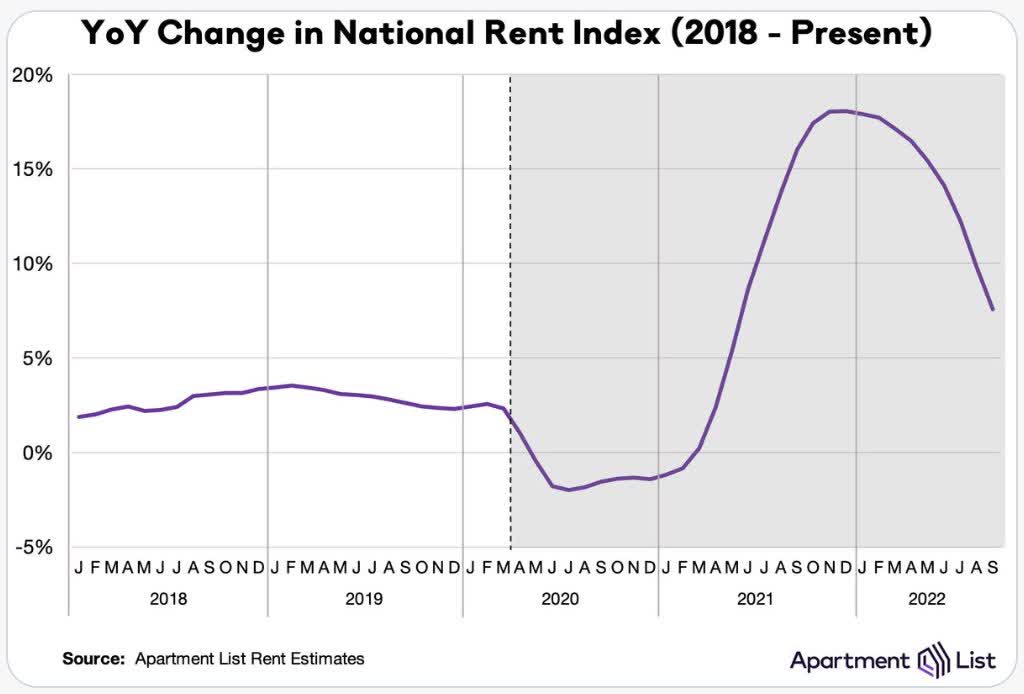
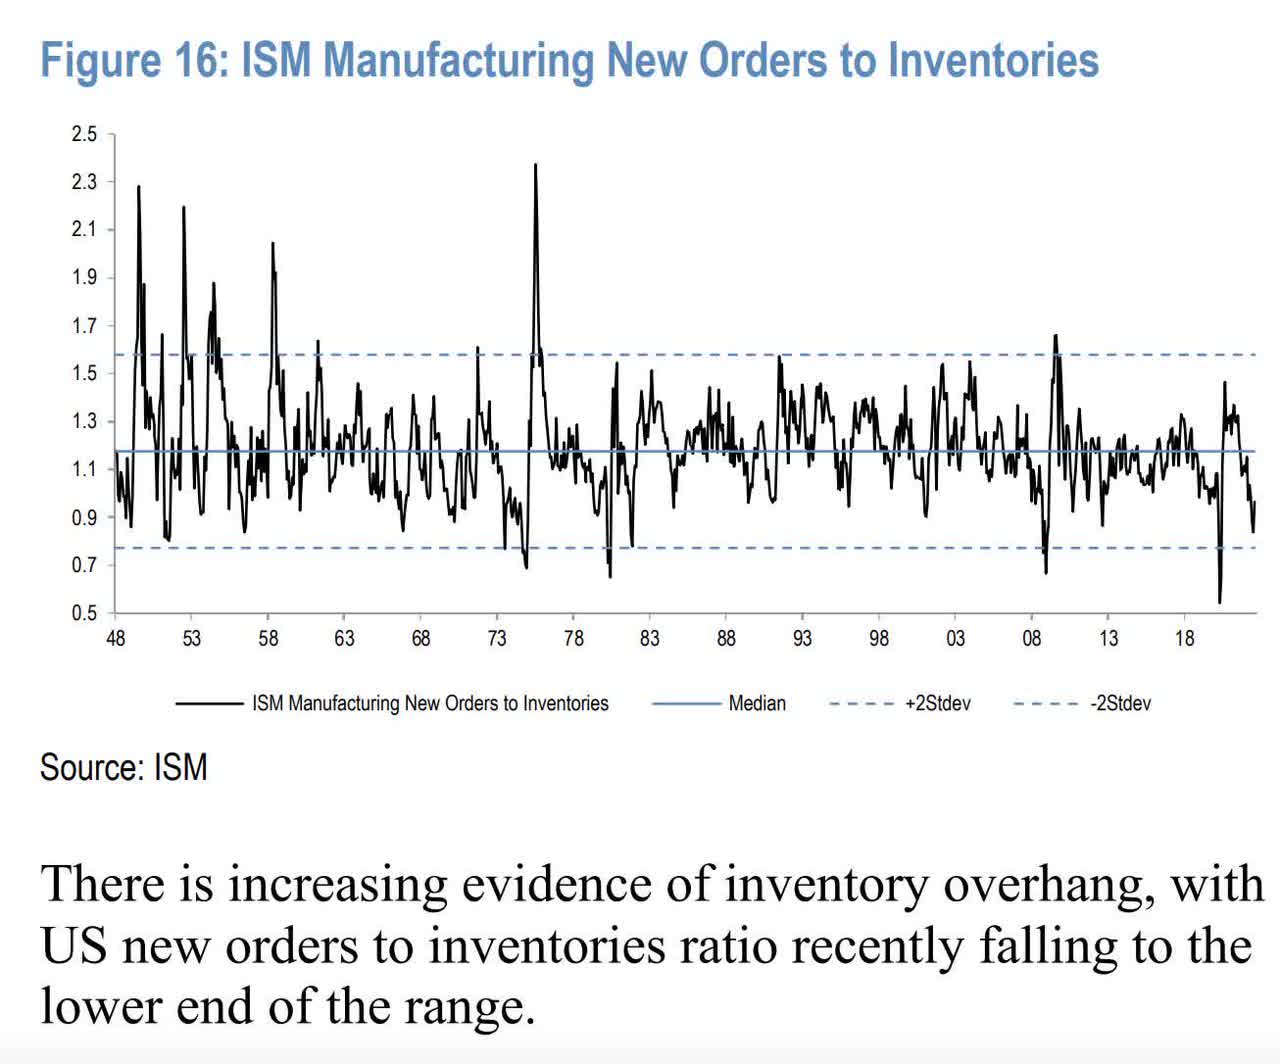
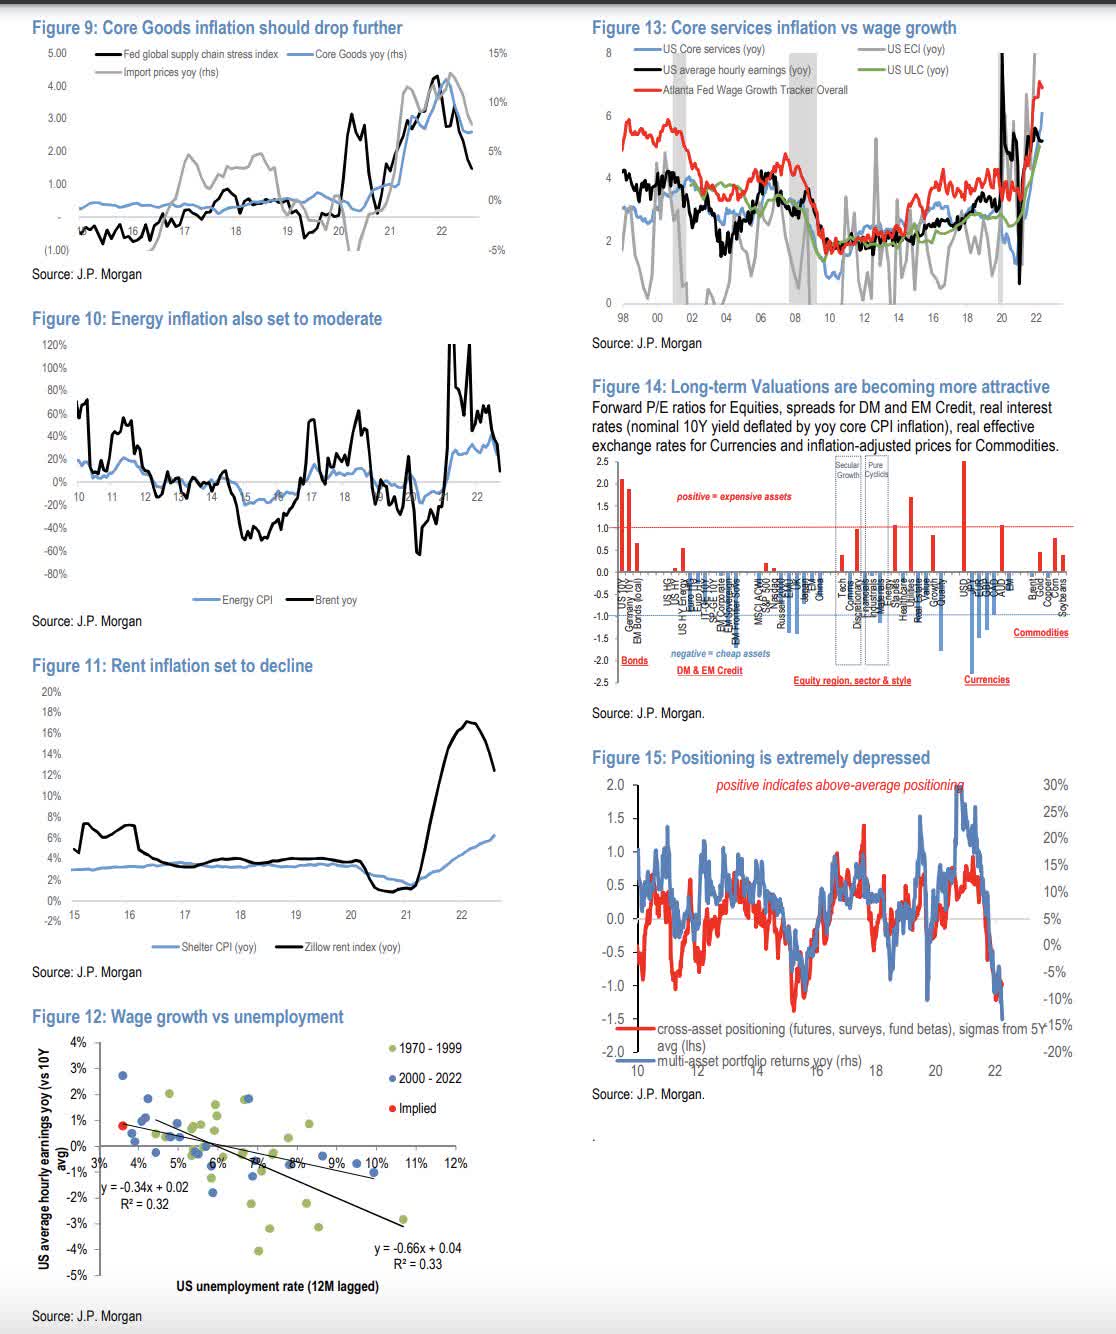
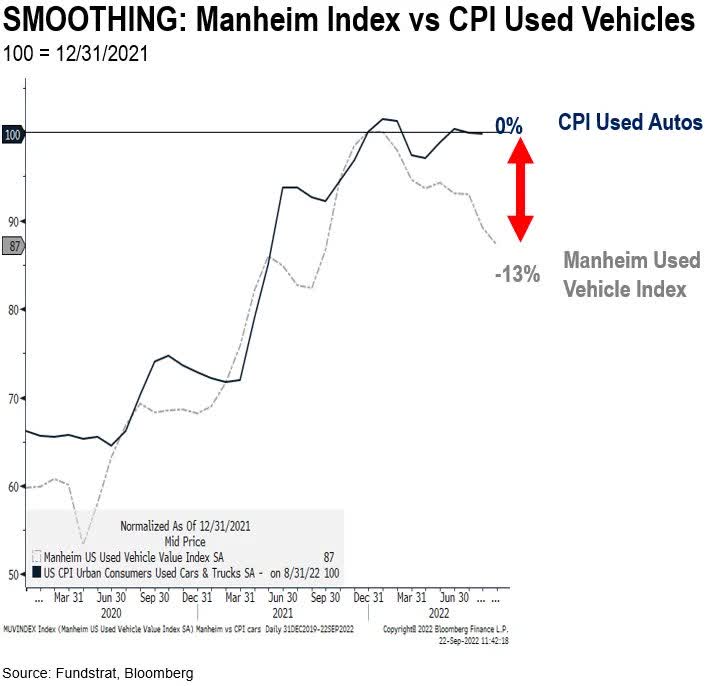
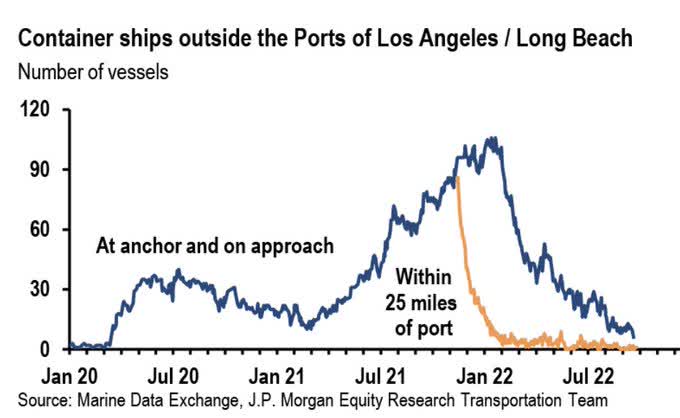
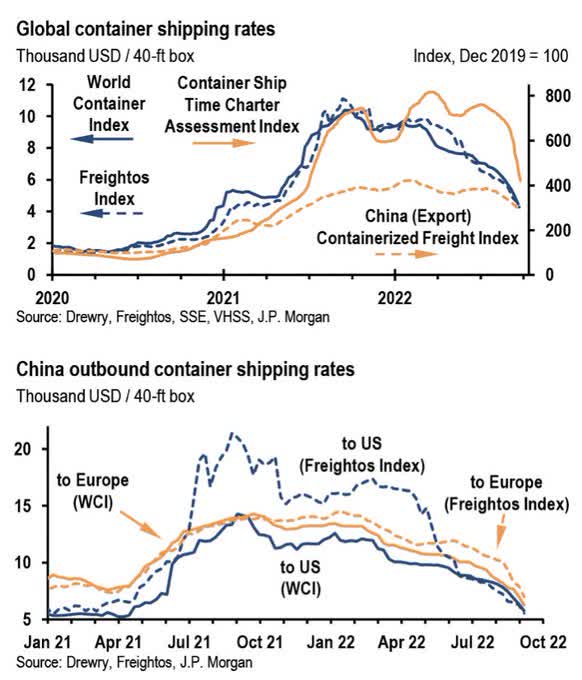
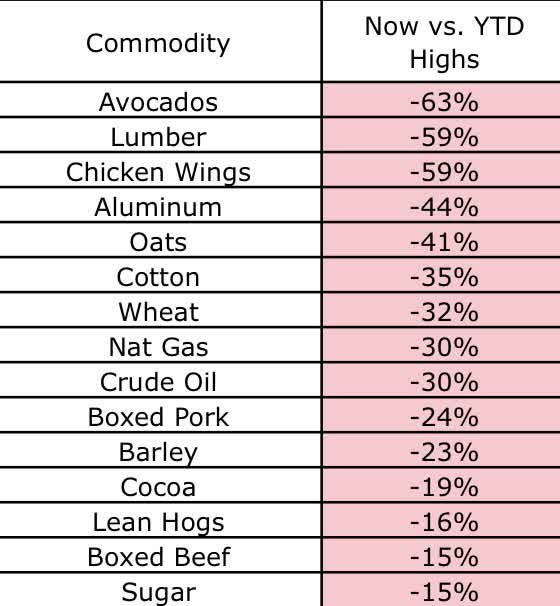
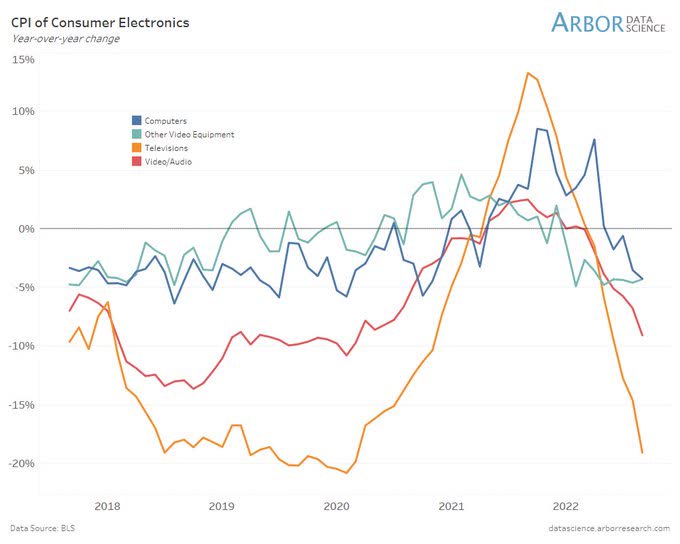
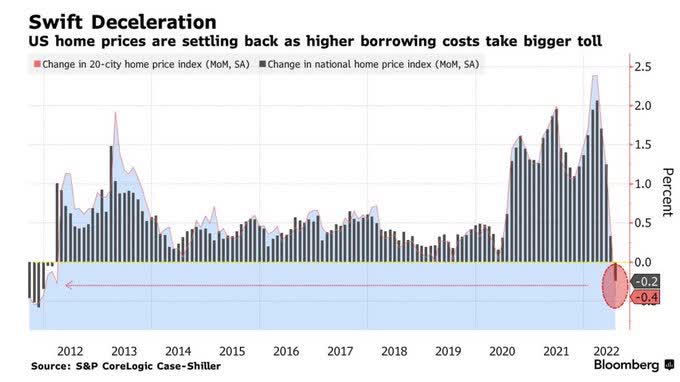
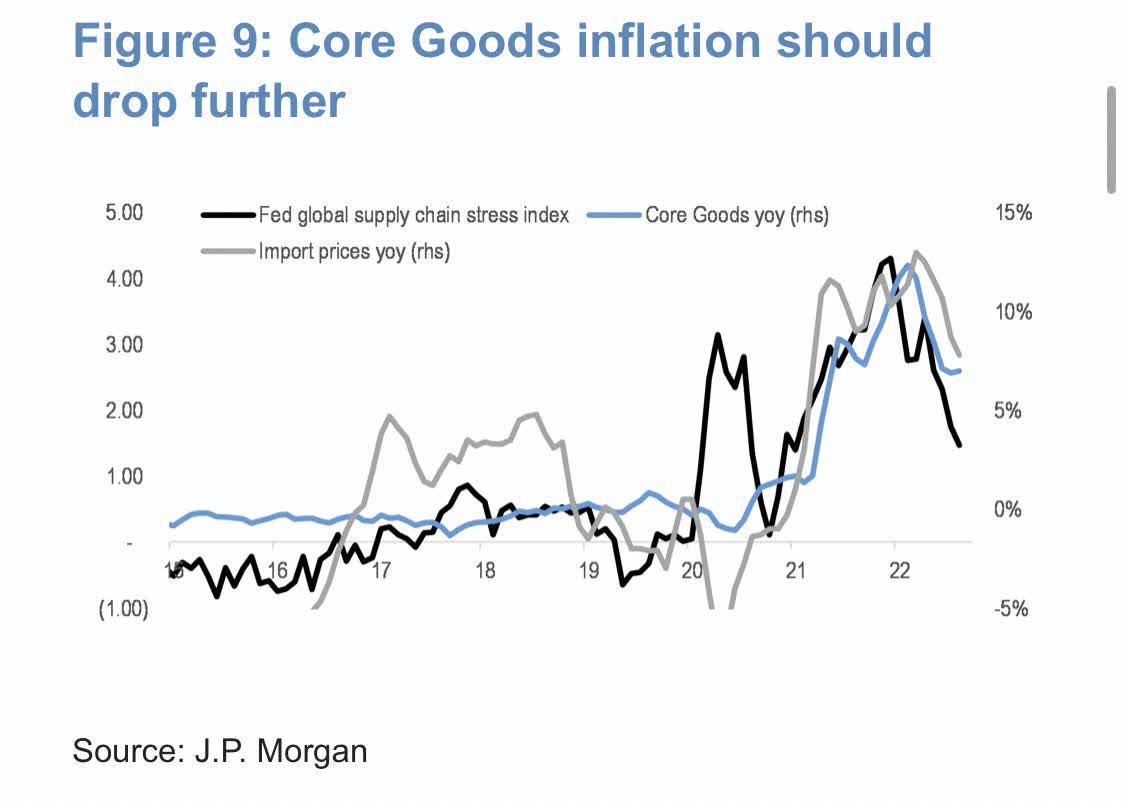
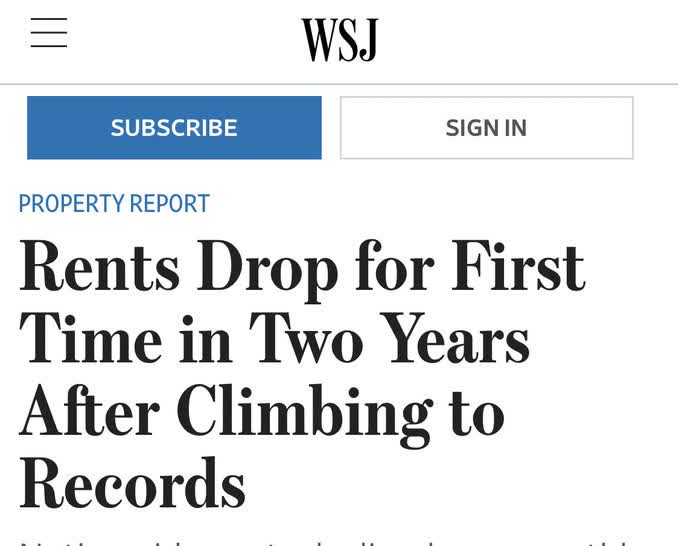
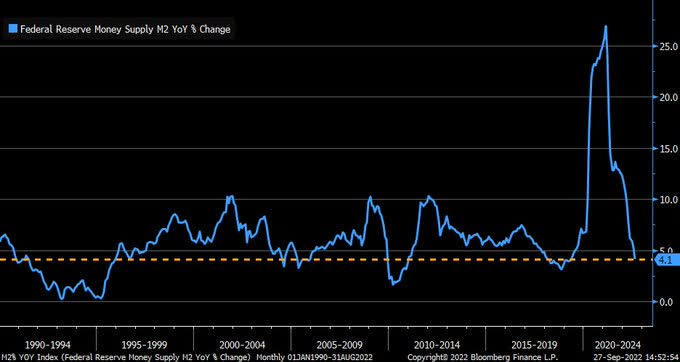
- Inflation is rolling over:
J.P. Morgan Apartment List Apartment List ISM J.P. Morgan Fundstrat Fundstrat Seth Golden + Larry Williams Seth Golden + Larry Williams J.P. Morgan J.P. Morgan Commodities Arbor Data Science Bloomberg J.P. Morgan WSJ BofA Bloomberg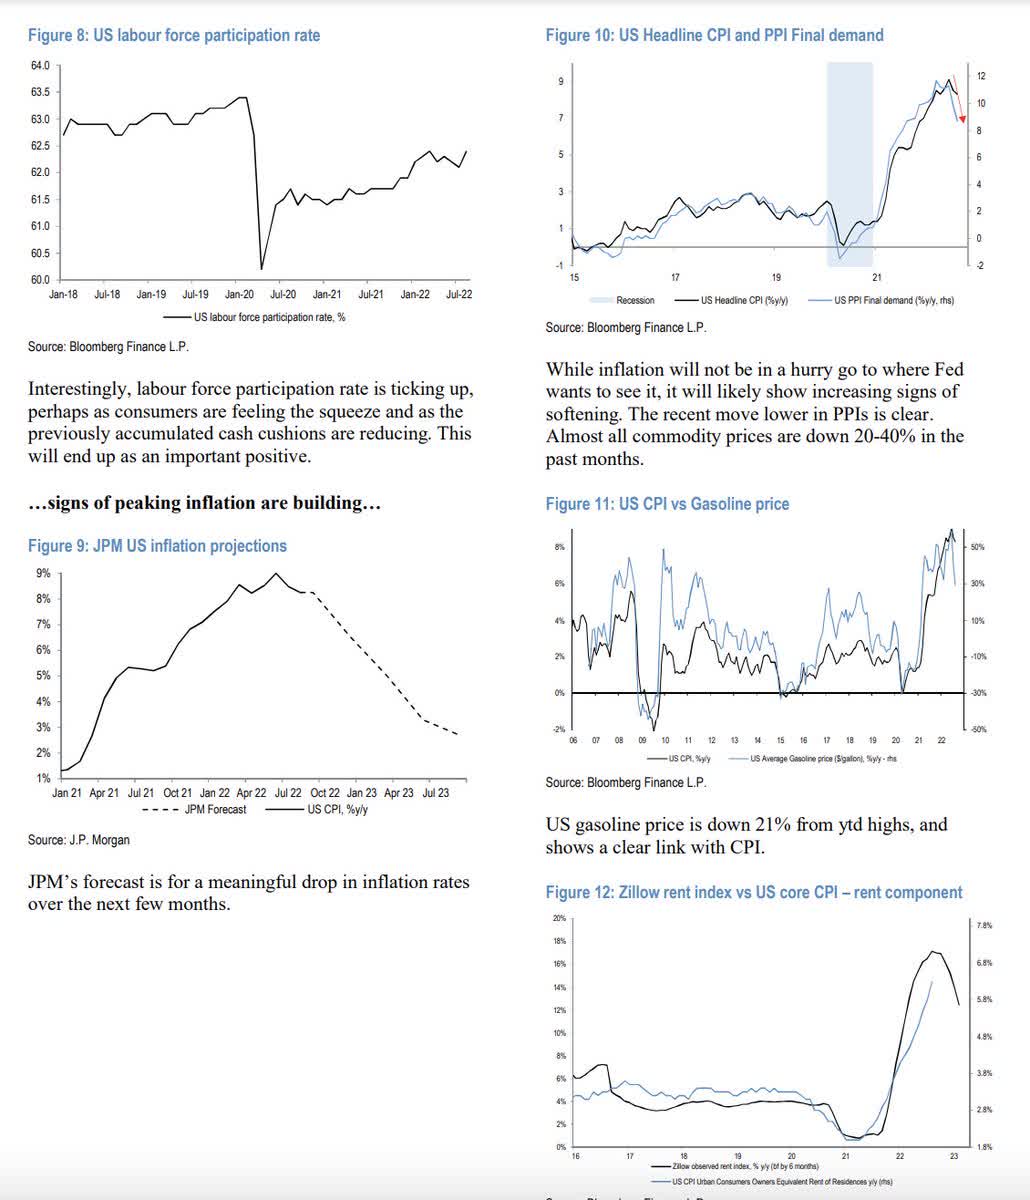
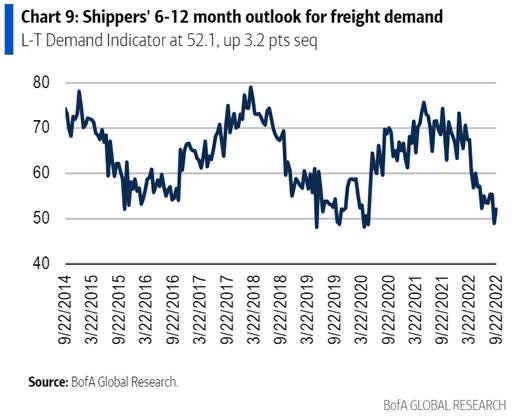
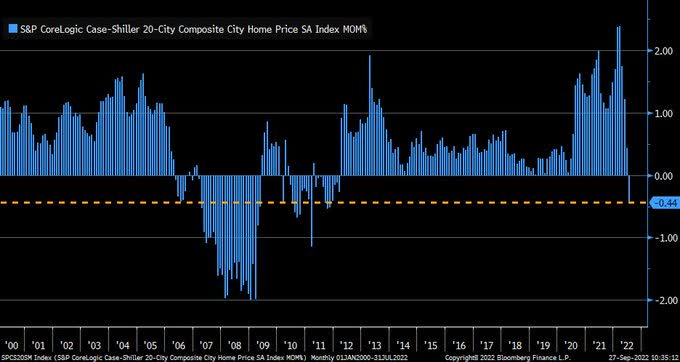
Source: Carl Quintanilla Liz Ann Sonders
- Every 1% hike adds $285B/yr to the deficit in interest expense. Easy to hike rates when debt/gdp was 30% in 1980-1982. At 122%, not so much. They will inflate it away by running inflation above trend 3-5% for a few years just like post WWII.
FRED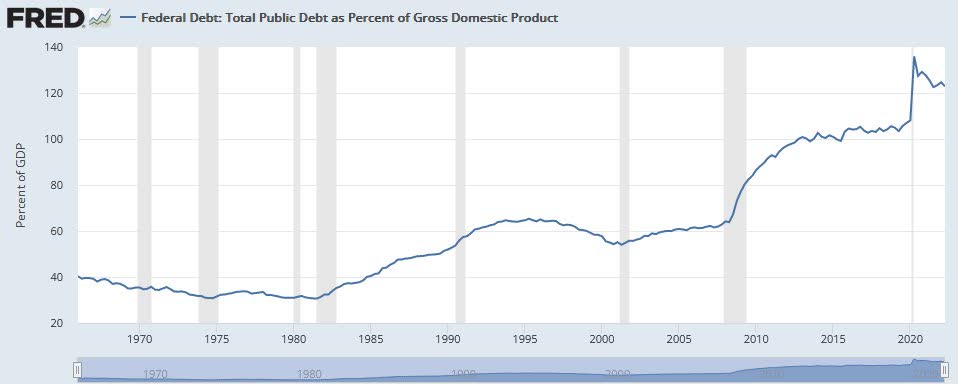
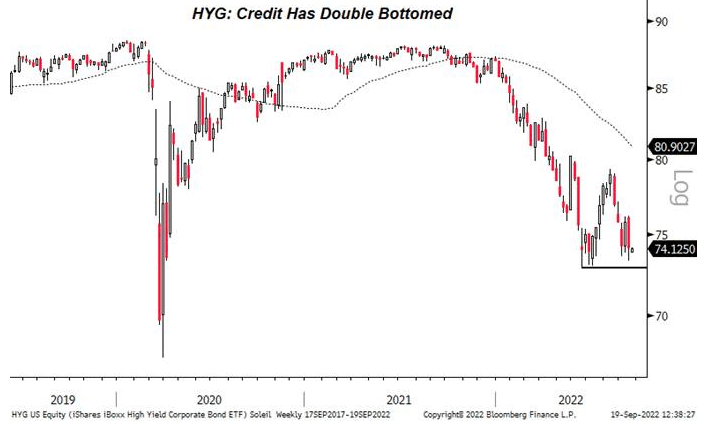
- Credit markets will force their hand when governments, municipalities and companies can’t refinance. It happened in the UK on Tuesday.
Hawkish Talk/Guidance working as 5yr inflation break-evens (proxy for inflation expectations) fell to 2.37% today (15 month low).
FRED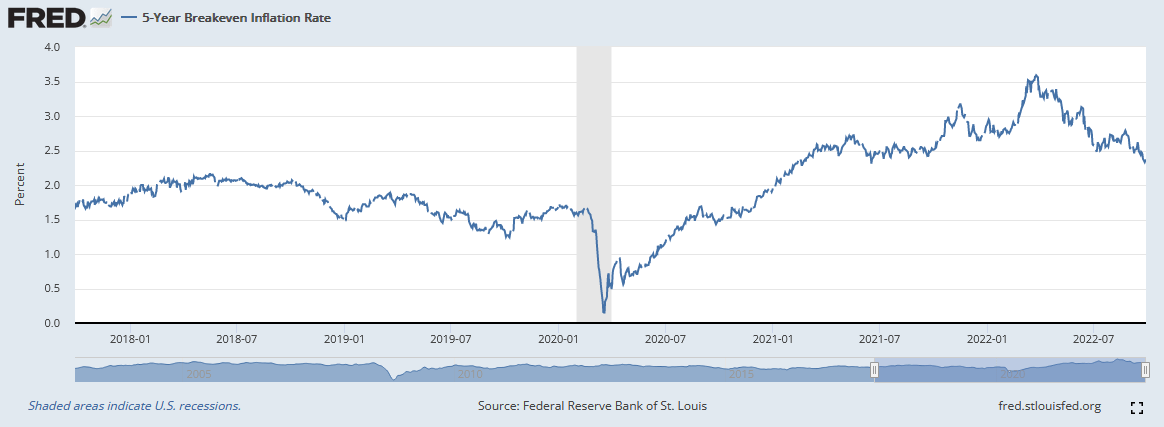
Managers Sentiment/Positioning for the Apocalypse:
Extreme readings such as these usually presage big turnarounds in the market:
–Highest expectations for Recession since Apr 2020 and March 2009 (stock market bottom was in in both cases).
-Lowest Percent of Managers “Overweight Equities” in history (-52%). Lower than 2020 Pandemic and GFC in 2008.
-Allocations to cash highest since 2001 (6.1%). Higher than GFC and Pandemic Lows.
Yardeni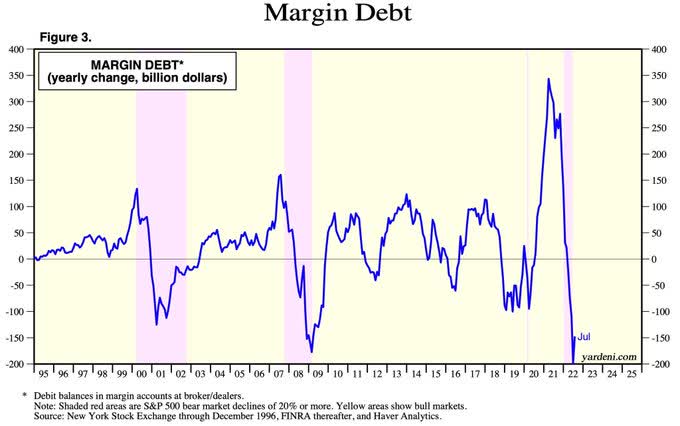
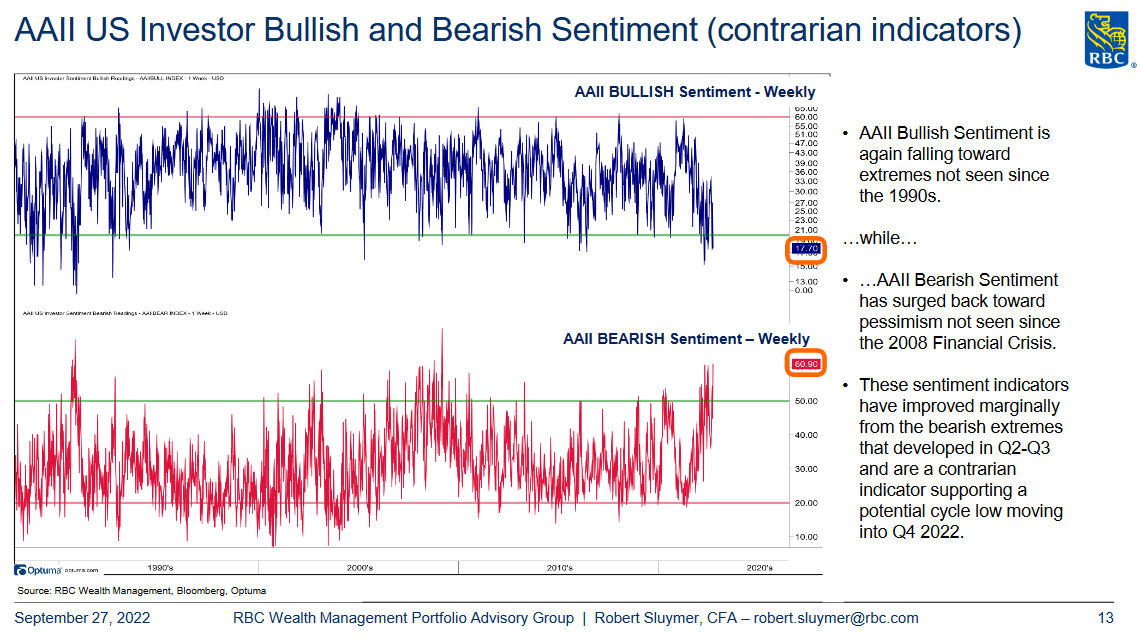
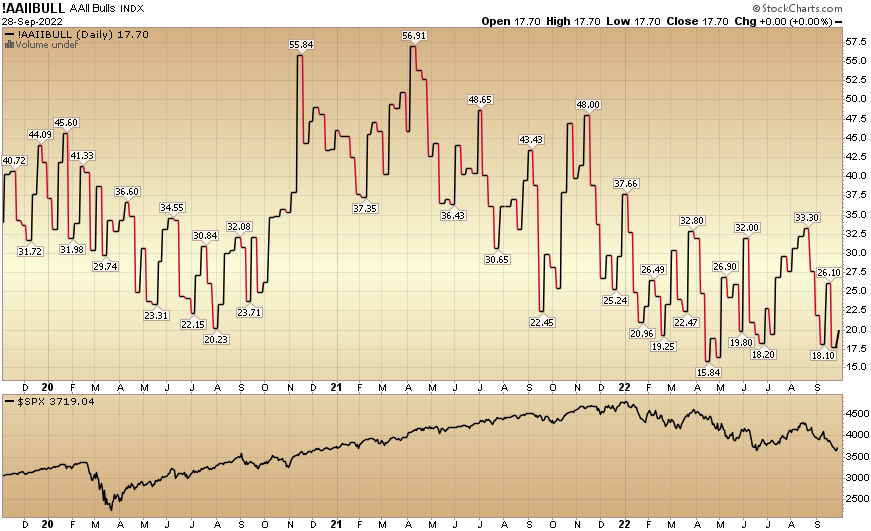
-Current AAII Sentiment Survey: 17.7% bullish. Pandemic Lows 20.23%. GFC lows 18.92%.
-If you can step in at extremes when volatility and fear are high, you will make outsized returns over time.
Take the other side. Looking out a few months, the “pain trade” is UP because no one is positioned for it.
US Mid-term election: Gridlock outcome is bullish for markets – no new taxes/spending/big regulation.
–Short USD: Commercial Hedgers aggressively short (as was the case before peaks in 2020, 2017, 2015, 2013, 2009, 2006).
–Long US Treasuries 10 year note: Commercial Hedgers aggressively long (as was case before rally in bonds 2018, 2014, 2011, 2009)
–Long S&P Futures: Commercial Hedgers aggressively long (as was case before rally in equities 2020, 2016, 2011, 2009)
Which Central Bank Blinks Next?
At the June lows, the ECB blinked and restarted a new QE facility to buy periphery bonds after Italian bond yields hit nine year highs. (Bloomberg)
Yesterday, the Bank of England blinked and restarted Quantitative Easing after yields spiked and their currency plummeted. (CNBC)
The Bank of Japan never even pretended to tighten. They’ve been buying bonds all year and targeting their 10yr yield at 25bps. (JapanTimes)
Authorities in Indonesia, Japan, China and India are stepping in to defend their currencies against the strong USD (Bloomberg)
Is the Fed next? Just yesterday, Chicago Federal Reserve President Charles Evans says he’s feeling apprehensive about the U.S. central bank raising interest rates too quickly in its quest to tackle runaway inflation. (CNBC)
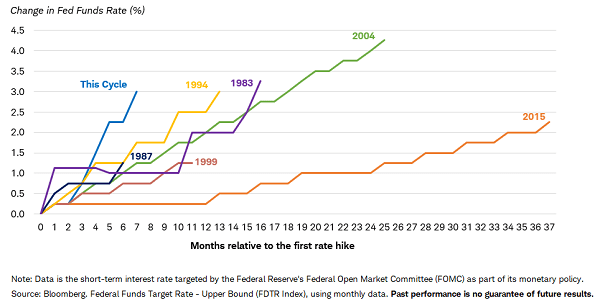
Chartr FOMC Bloomberg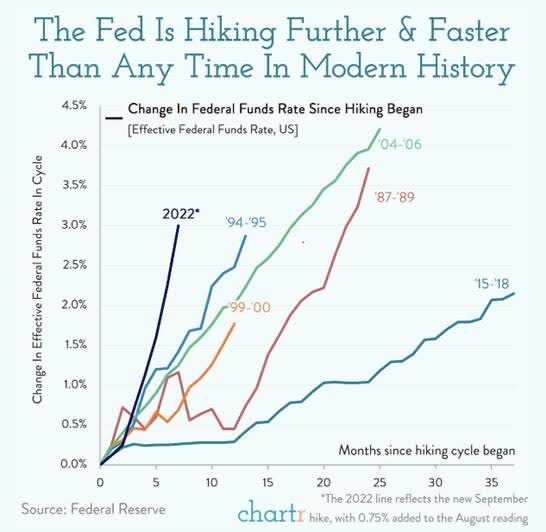
Technical Factors
RBC RBC RBC Bloomberg Bloomberg Bloomberg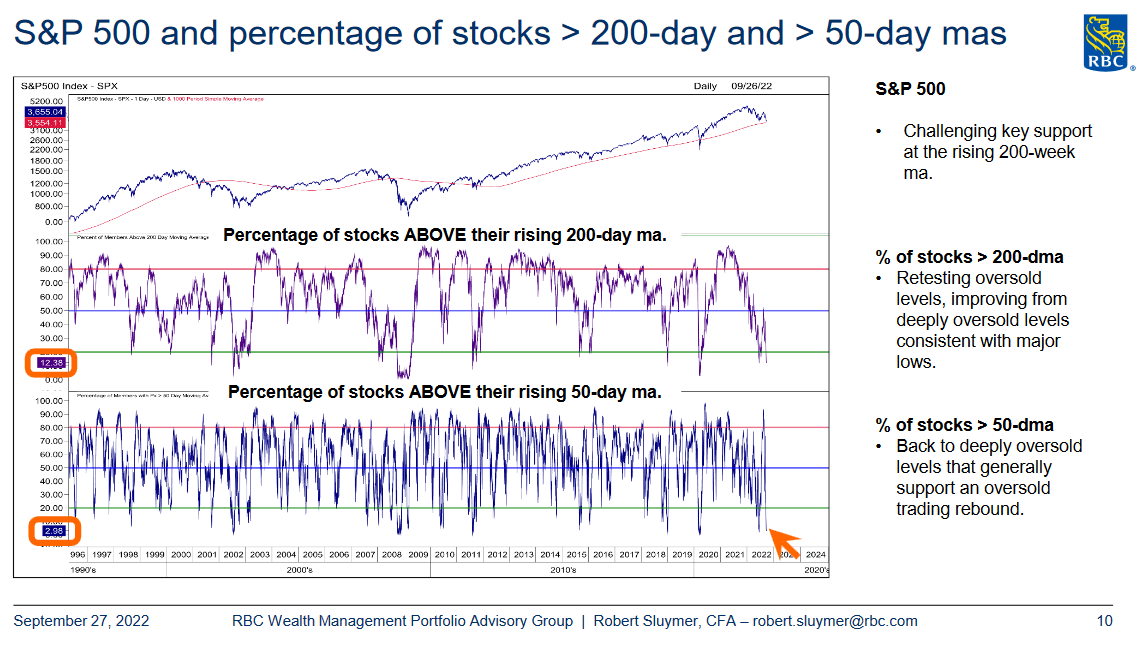
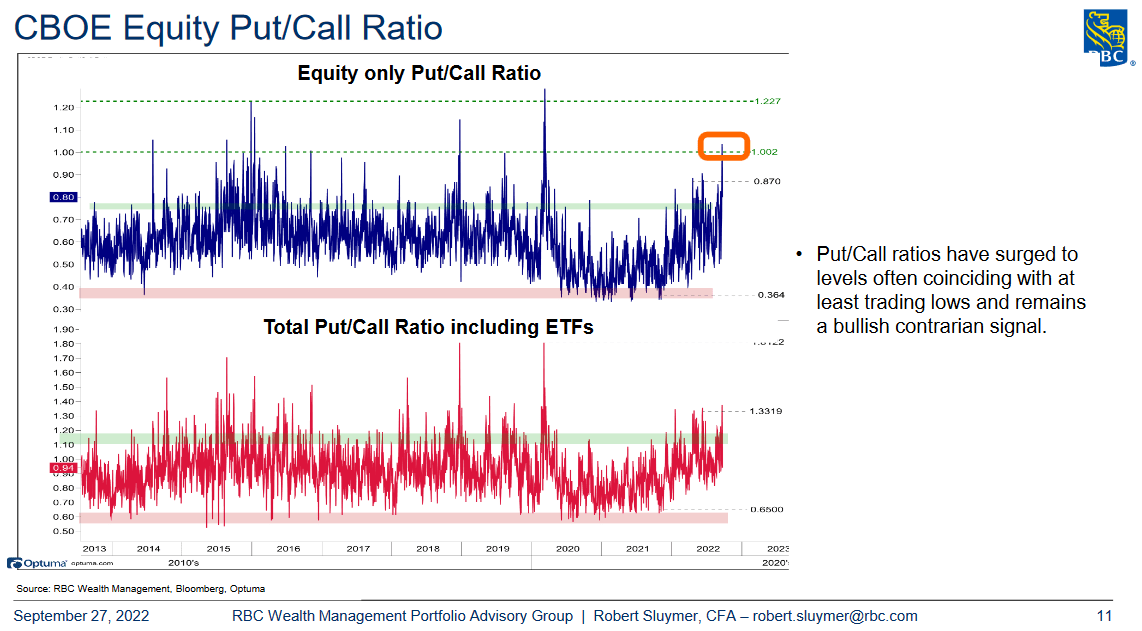
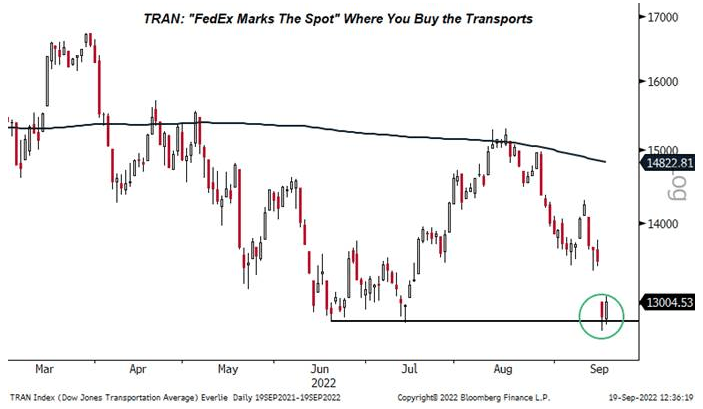
Source: RBC and Evercore ISI
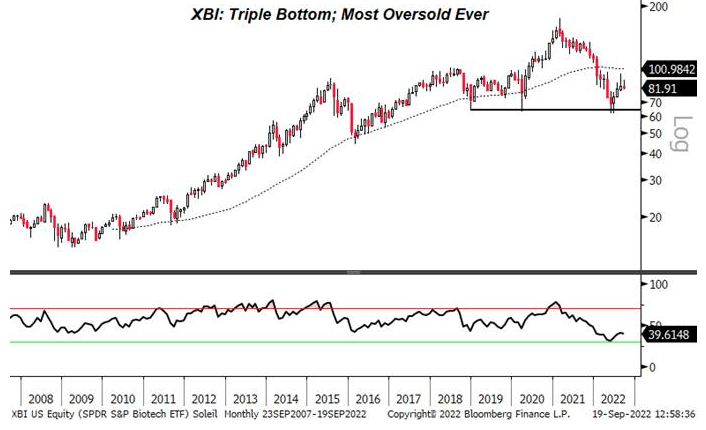
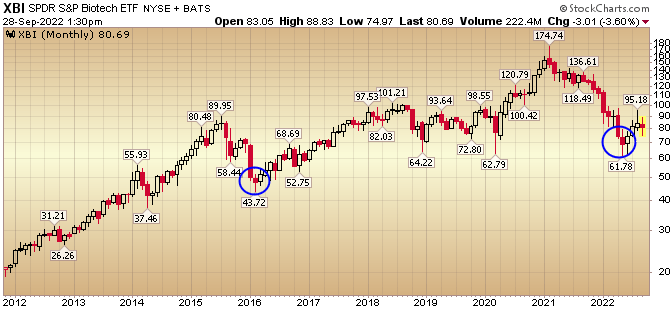
Biotech Update
Stockcharts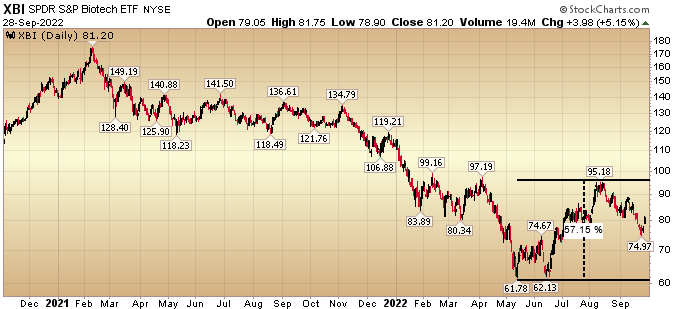
Catalysts playing out:
1) Major Drug Progress
Biogen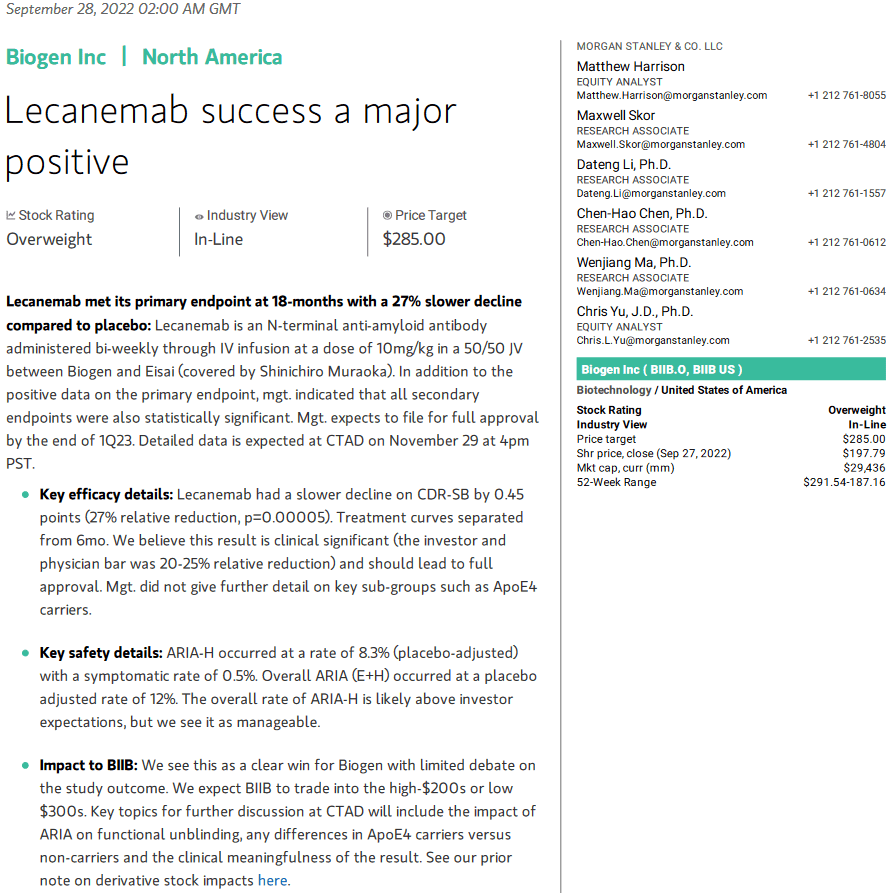
Source: Morgan Stanley
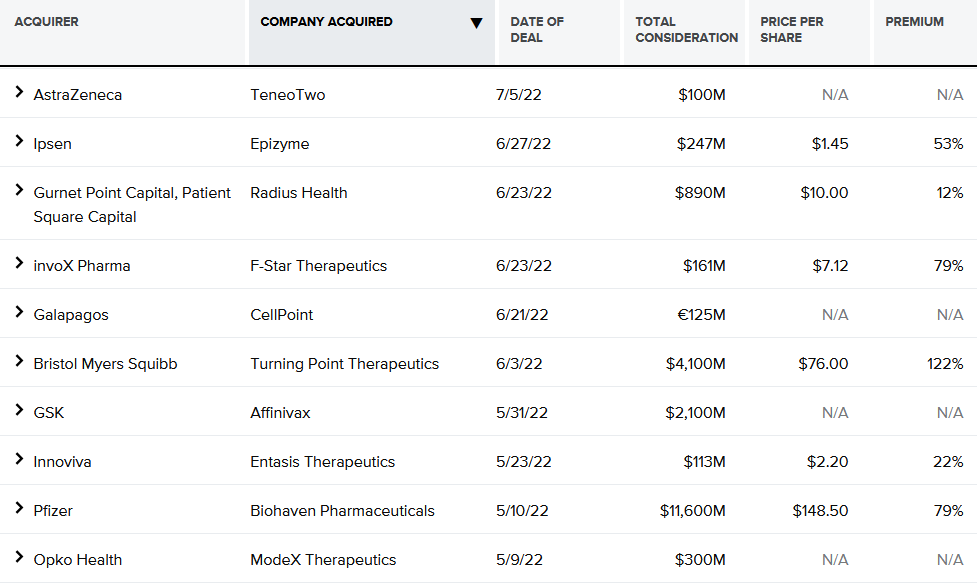
2) Major Deal Progress
FDA FDA Stockcharts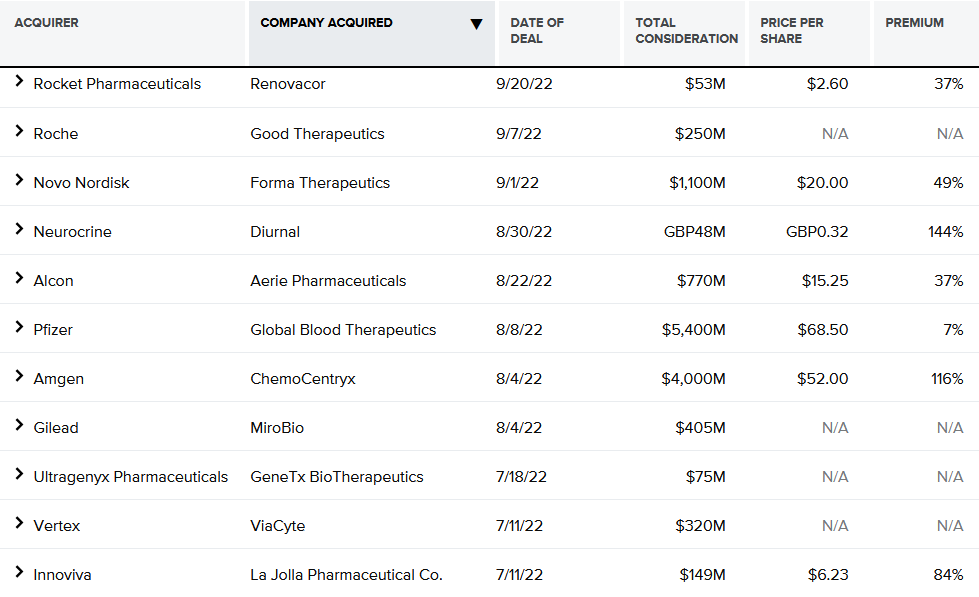
Alibaba (BABA) Update
Doing what it does at every low. Retest low to take out weak hands who don’t understand intrinsic value/sum of the parts analysis.
Stockcharts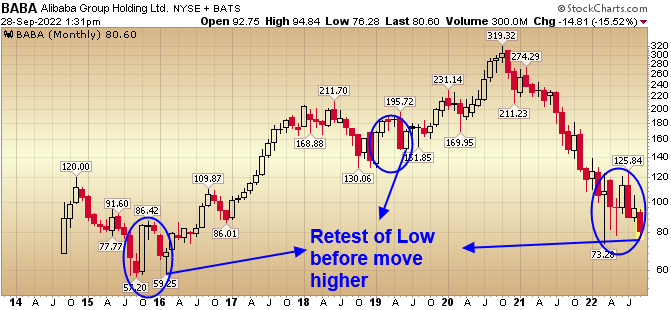
US/China relations thawing (by necessity or desperation)?
News Paper South China Morning Post SCMP
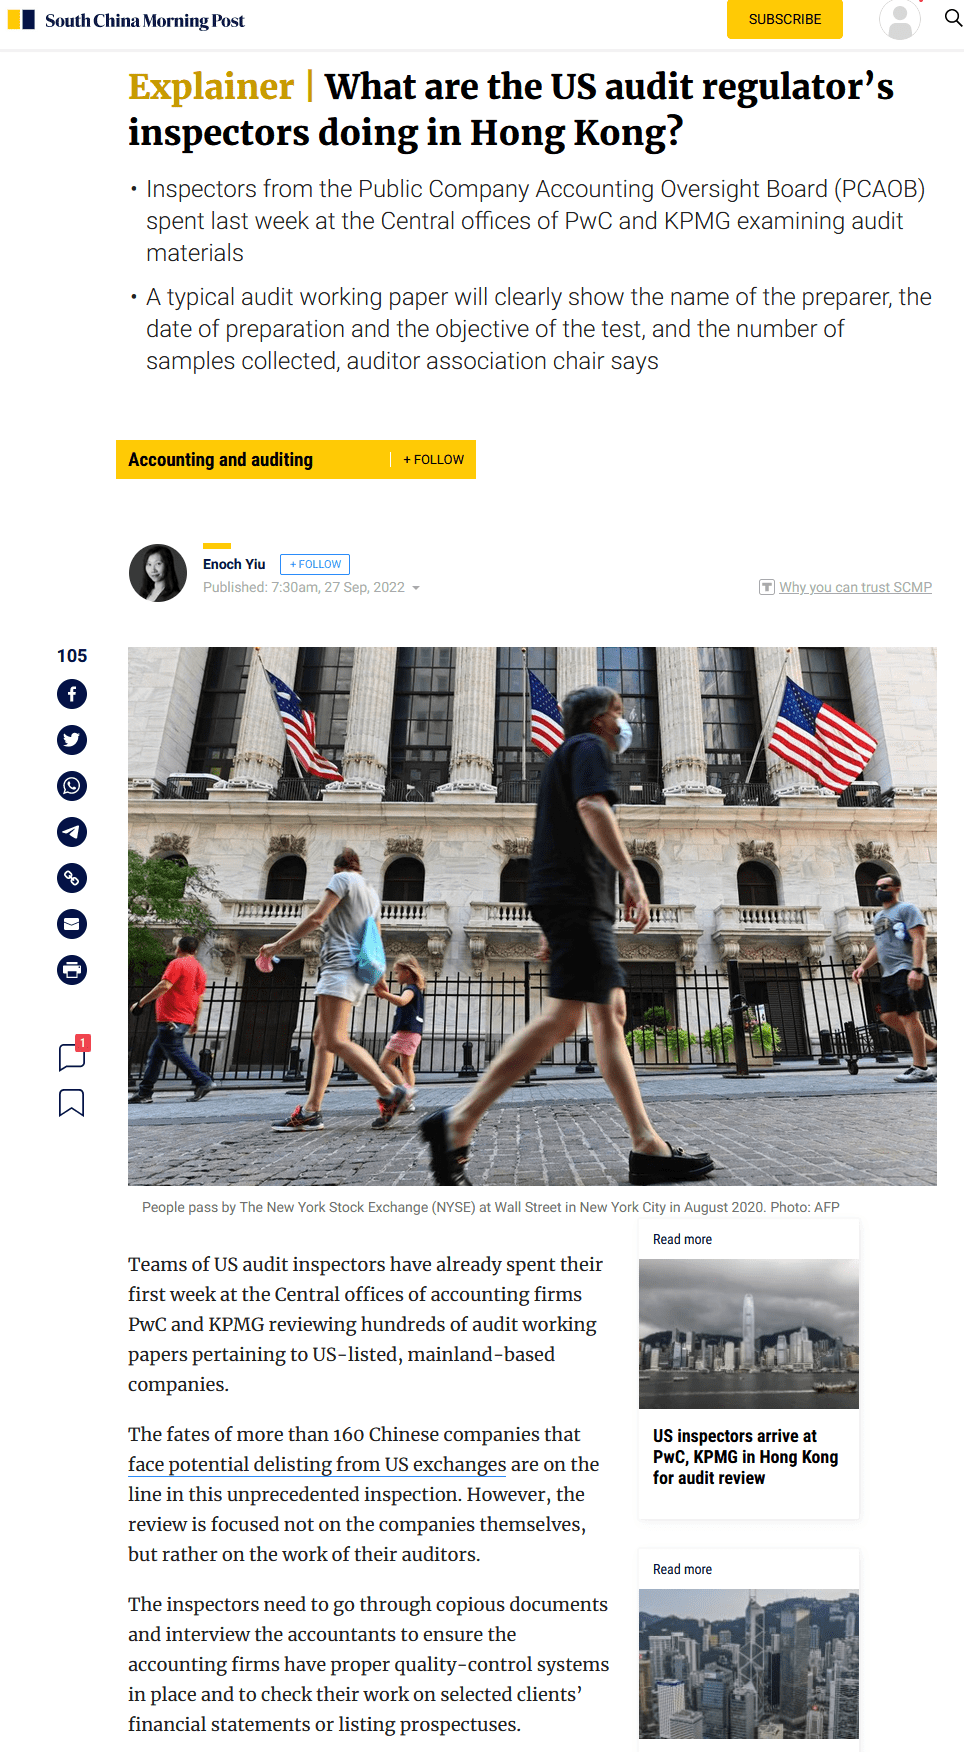
Full Article: (scmp)
CPS Update
Stockcharts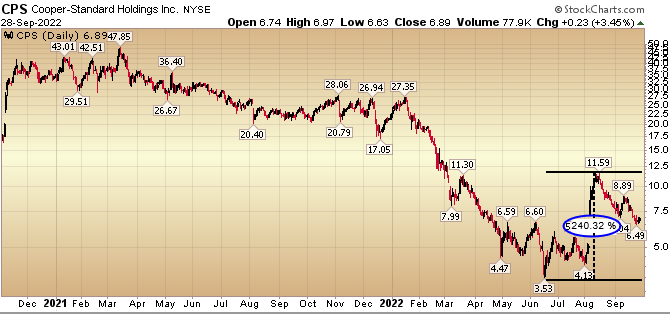
Expect more consolidation before credit markets re-open and refinancing gets done for next catalyst. Semiconductors flowing, OEMs continue to improve deliveries with less hiccups:
Stockcharts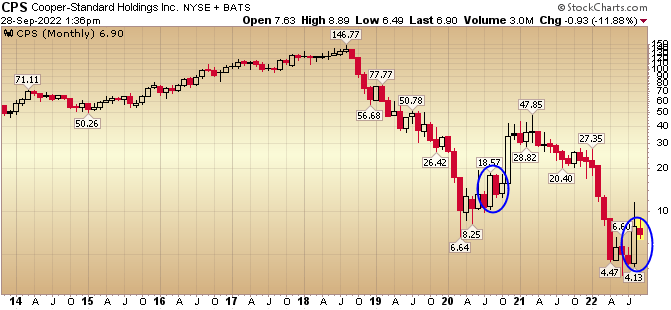
Now onto the shorter term view for the General Market:
In this last week’s AAII Sentiment Survey result, Bullish Percent ticked up to 20.0% from 17.7% the previous week. Bearish Percent ticked down to 60.8% from 60.9%. Retail Sentiment is lower than it was at the pandemic lows (20.23) and near the Great Financial Crisis lows of (18.92).
AAII Stockcharts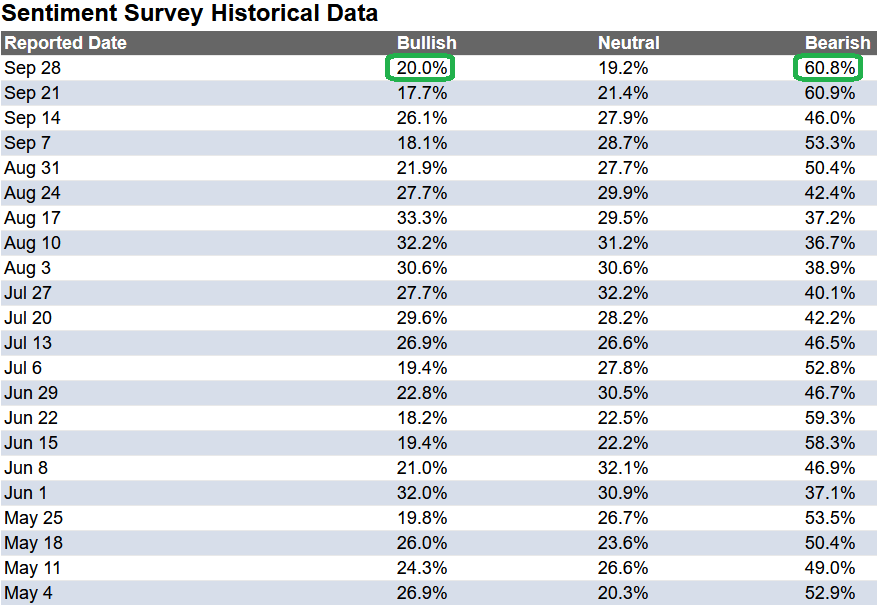
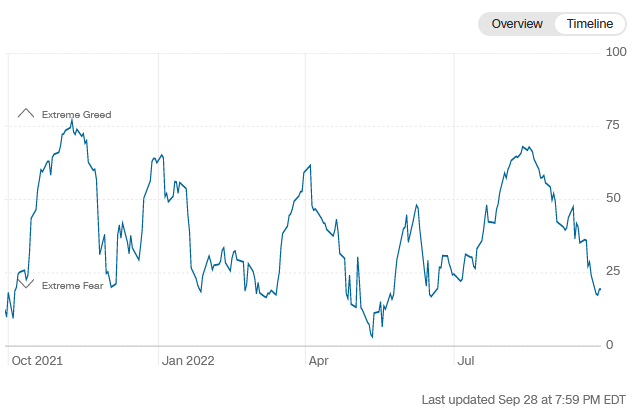
The CNN “Fear and Greed” dropped from 31 last week to 19 this week. Sentiment is extremely fearful.
CNN CNN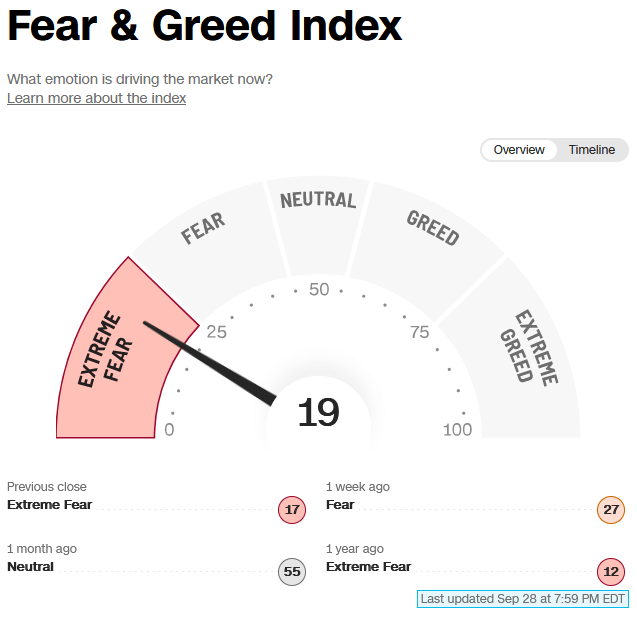
And finally, the NAAIM (National Association of Active Investment Managers Index) dropped to 29.59% this week from 33.86% equity exposure last week. Any further good news and managers will be forced to chase up into year-end:
Stockcharts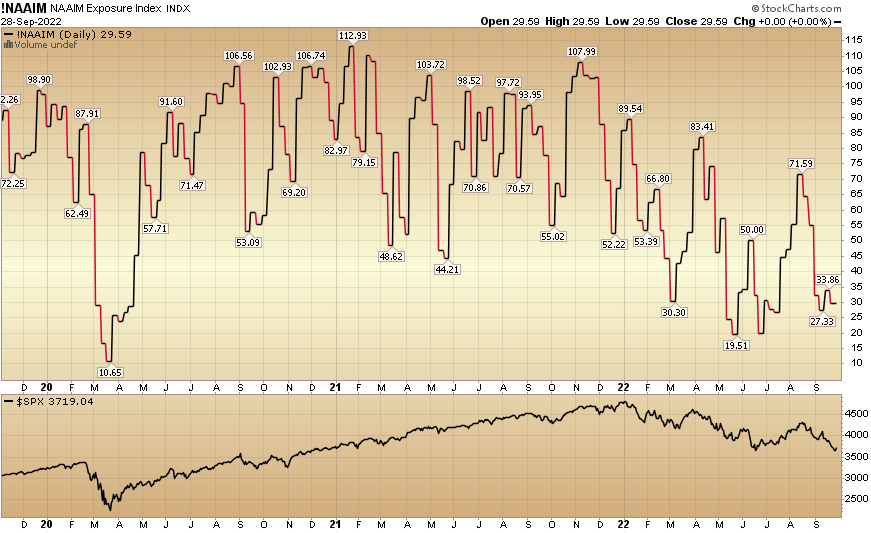
Author and/or clients may have beneficial holdings in any or all investments mentioned above.
Be the first to comment