

Aaron Hawkins/iStock via Getty Images
Investment Thesis
As a dividend growth investor with a long-term investment horizon, I consider Texas Instruments (NASDAQ:TXN) one of the best stocks to own. The company pays a generous dividend and has a shareholder-friendly DNA with a stellar track record of dividend growth and share buybacks.
Texas Instruments has a world-class management team focused on growing free cash flow as the primary driver of long-term value. The company has maintained an annual growth rate in free cash flow per share of 12% since 2004.
The company is disciplined in allocating capital, whether for research and development, new manufacturing capacity, acquisitions, or returning cash to shareholders. Texas Instruments is at the top of its industry (97th percentile) when measured by returns on invested capital.
The semiconductor industry is growing rapidly, especially in the industrial and automotive industries, which are the primary revenue generators for Texas Instruments (62% of total revenue in 2021). The company’s long-term roadmap will result in eight fabrication facilities to meet growing demand.
Financially, the company’s strengths are evident in several areas, including an impressive record of earnings per share growth, strong growth in net income, revenue growth, reasonable debt levels, and expanding profit margins.
TXN is trading about 19% below its 52-week and all-time high of $202.26 per share. The stock is down about 14% year-to-date, compared to the S&P 500’s year-to-date decline of 17%.
TXN is undervalued with a 12-month upside of at least 13%, so I rate the stock a buy.
Company Background
Texas Instruments is a global semiconductor company that designs, manufactures, tests, and sells analog and embedded processing chips for industrial, automotive, personal electronics, communications equipment, and enterprise systems markets. TXN was founded in 1930 and is headquartered in Dallas, Texas.
The company’s world-class management team has shareholders at the center of their focus, as evidenced by dividend growth of 25% CAGR and its share count reduction of 46% since 2004. TXN has a dividend increase streak of 19 years.
Management runs the company with a mindset of being long-term owners and subscribes to the principle that the growth of free cash flow per share is the primary driver of long-term value. The company has maintained an annual growth rate in free cash flow per share of 12% since 2004.
The company’s reportable segments are Analog and Embedded Processing. In 2021, the Analog segment generated $14.05 billion (or about 77%) of revenue, while the Embedded Processing segment generated $3.05 billion (or about 17%) of revenue. The remaining $1.25 billion (or about 6%) of 2021 revenue comes from other business activities, including revenue from DLP products, calculators, and application-specific integrated circuits.
TXN has a diverse product portfolio of approximately 80,000 products and a customer base of over 100,000 customers. More than 40% of revenue comes from customers outside its largest 100. The company’s products are used in many different markets, notably industrial (41% of revenue), automotive (21%), and personal electronics (24%).
The automotive and industrial market segments likely will provide excellent long-term growth opportunities, especially relating to the internet of things [IoT] and autonomous vehicles:
- IoT: An increasing number of devices, industrial equipment, and infrastructure will be connected to the internet to allow for real-time data gathering and analysis.
- Autonomous vehicles: in addition to driverless cars, drones and robots will require substantial data collection capabilities to operate safely in the physical world.
TXN faces several risks, including the impact of the COVID-19 pandemic, macroeconomic conditions, and intense competition in a highly fragmented market.
The COVID-19 pandemic continues to create significant uncertainty and economic disruption, both near-term and potentially long-term. As a global company, Texas Instruments faces significant risk if trade tensions escalate or macroeconomic conditions deteriorate. About 90% of the company’s revenue comes from shipments to locations outside the United States, while shipments of products to China-based customers represent about 25% of revenue.
The semiconductor industry is highly cyclical and sensitive to macroeconomic disruptions. While Texas Instruments is the world’s leader in analog and embedded chips, the company competes in highly fragmented industries with large rivals like Analog Devices (ADI) and Broadcom (AVGO). For TXN, this means intense pricing competition and continuous pressure to innovate and update its product portfolio.
Quality Assessment
I use DVK Quality Snapshots to assess the quality of dividend growth stocks.
DVK Quality Snapshots employs five quality indicators from trusted sources and assigns 0-5 points to each quality indicator for a maximum quality score of 25 points. The sources and quality indicators are:
- Value Line [VL] Safety Rank
- Value Line [VL] Financial Strength ratings
- Morningstar [M*] Economic Moat
- S&P Global [S&P] Credit Ratings
- Simply Safe Dividends [SSD] Dividend Safety Scores
Here are TXN’s quality indicators and quality score:
Created by the author from a personal spreadsheet based on DVK Quality Snapshots
TXN earns 5 points for all but one quality indicator, the S&P Credit Rating (4 points).
Given TXN’s quality score of 24, I rate the stock Excellent.
I routinely update the quality scores of over 700 dividend growth stocks in Dividend Radar, a spreadsheet containing stocks with dividend increase streaks of five years or more. To establish a rank order, I sort Dividend Radar stocks in descending order by quality score and use tie-breaking metrics where necessary.
TXN is ranked 19th of all Dividend Radar stocks.
Aside from the quality score, I weigh the following metrics as indicators of investment quality:
Dividend Safety: While a stock’s Dividend Safety Score is one of the quality indicators of DVK Quality Snapshots, I consider this metric separately. I only want to invest in the safest dividend growth stocks!
- TXN’s dividend is Very Safe, given its Dividend Safety Score of 90.
Growth Prospects: The Chowder Number [C#] sums up a stock’s forward yield and 5-year dividend growth rate. It is a growth-oriented metric measuring the likelihood of delivering annualized returns of 8% or higher.
- TXN has a C# of 22, indicating a high likelihood of annualized returns of at least 8%.
Income Prospects: The 5-year Yield on Cost [YOC] is an income-oriented metric indicating what your YOC would be after buying a stock and holding it for five years, assuming the current 5-year dividend growth rate is maintained.
- TXN’s projected 5-year YOC is 6.6%, well above my desired rate of 4.0%.
Discounted Valuation: I routinely estimate the fair value of dividend growth stocks to identify candidates trading at favorable valuations. If a stock passes all three of my valuation checks, I believe it is an excellent opportunity to open a new position or add to an existing position.
- TXN trades 10% below my fair value estimate.
- TXN trades 14% below my risk-adjusted Buy Below price.
- TXN’s forward yield is 7% above its 5-year average yield.
Past Performance: Past performance is no guarantee of future results, but I find it hard to invest in stocks that routinely underperform the S&P 500 (as measured by SPY).
- TXN has outperformed SPY over the past five years, returning 18.4% annually versus SPY’s 12%.
Dividend Analysis
TXN has a dividend increase streak of 19 years and has paid uninterrupted dividends since 1962.
Below is a chart of TXN’s 10-year dividend history through 2021, courtesy of Portfolio Insight:
Portfolio Insight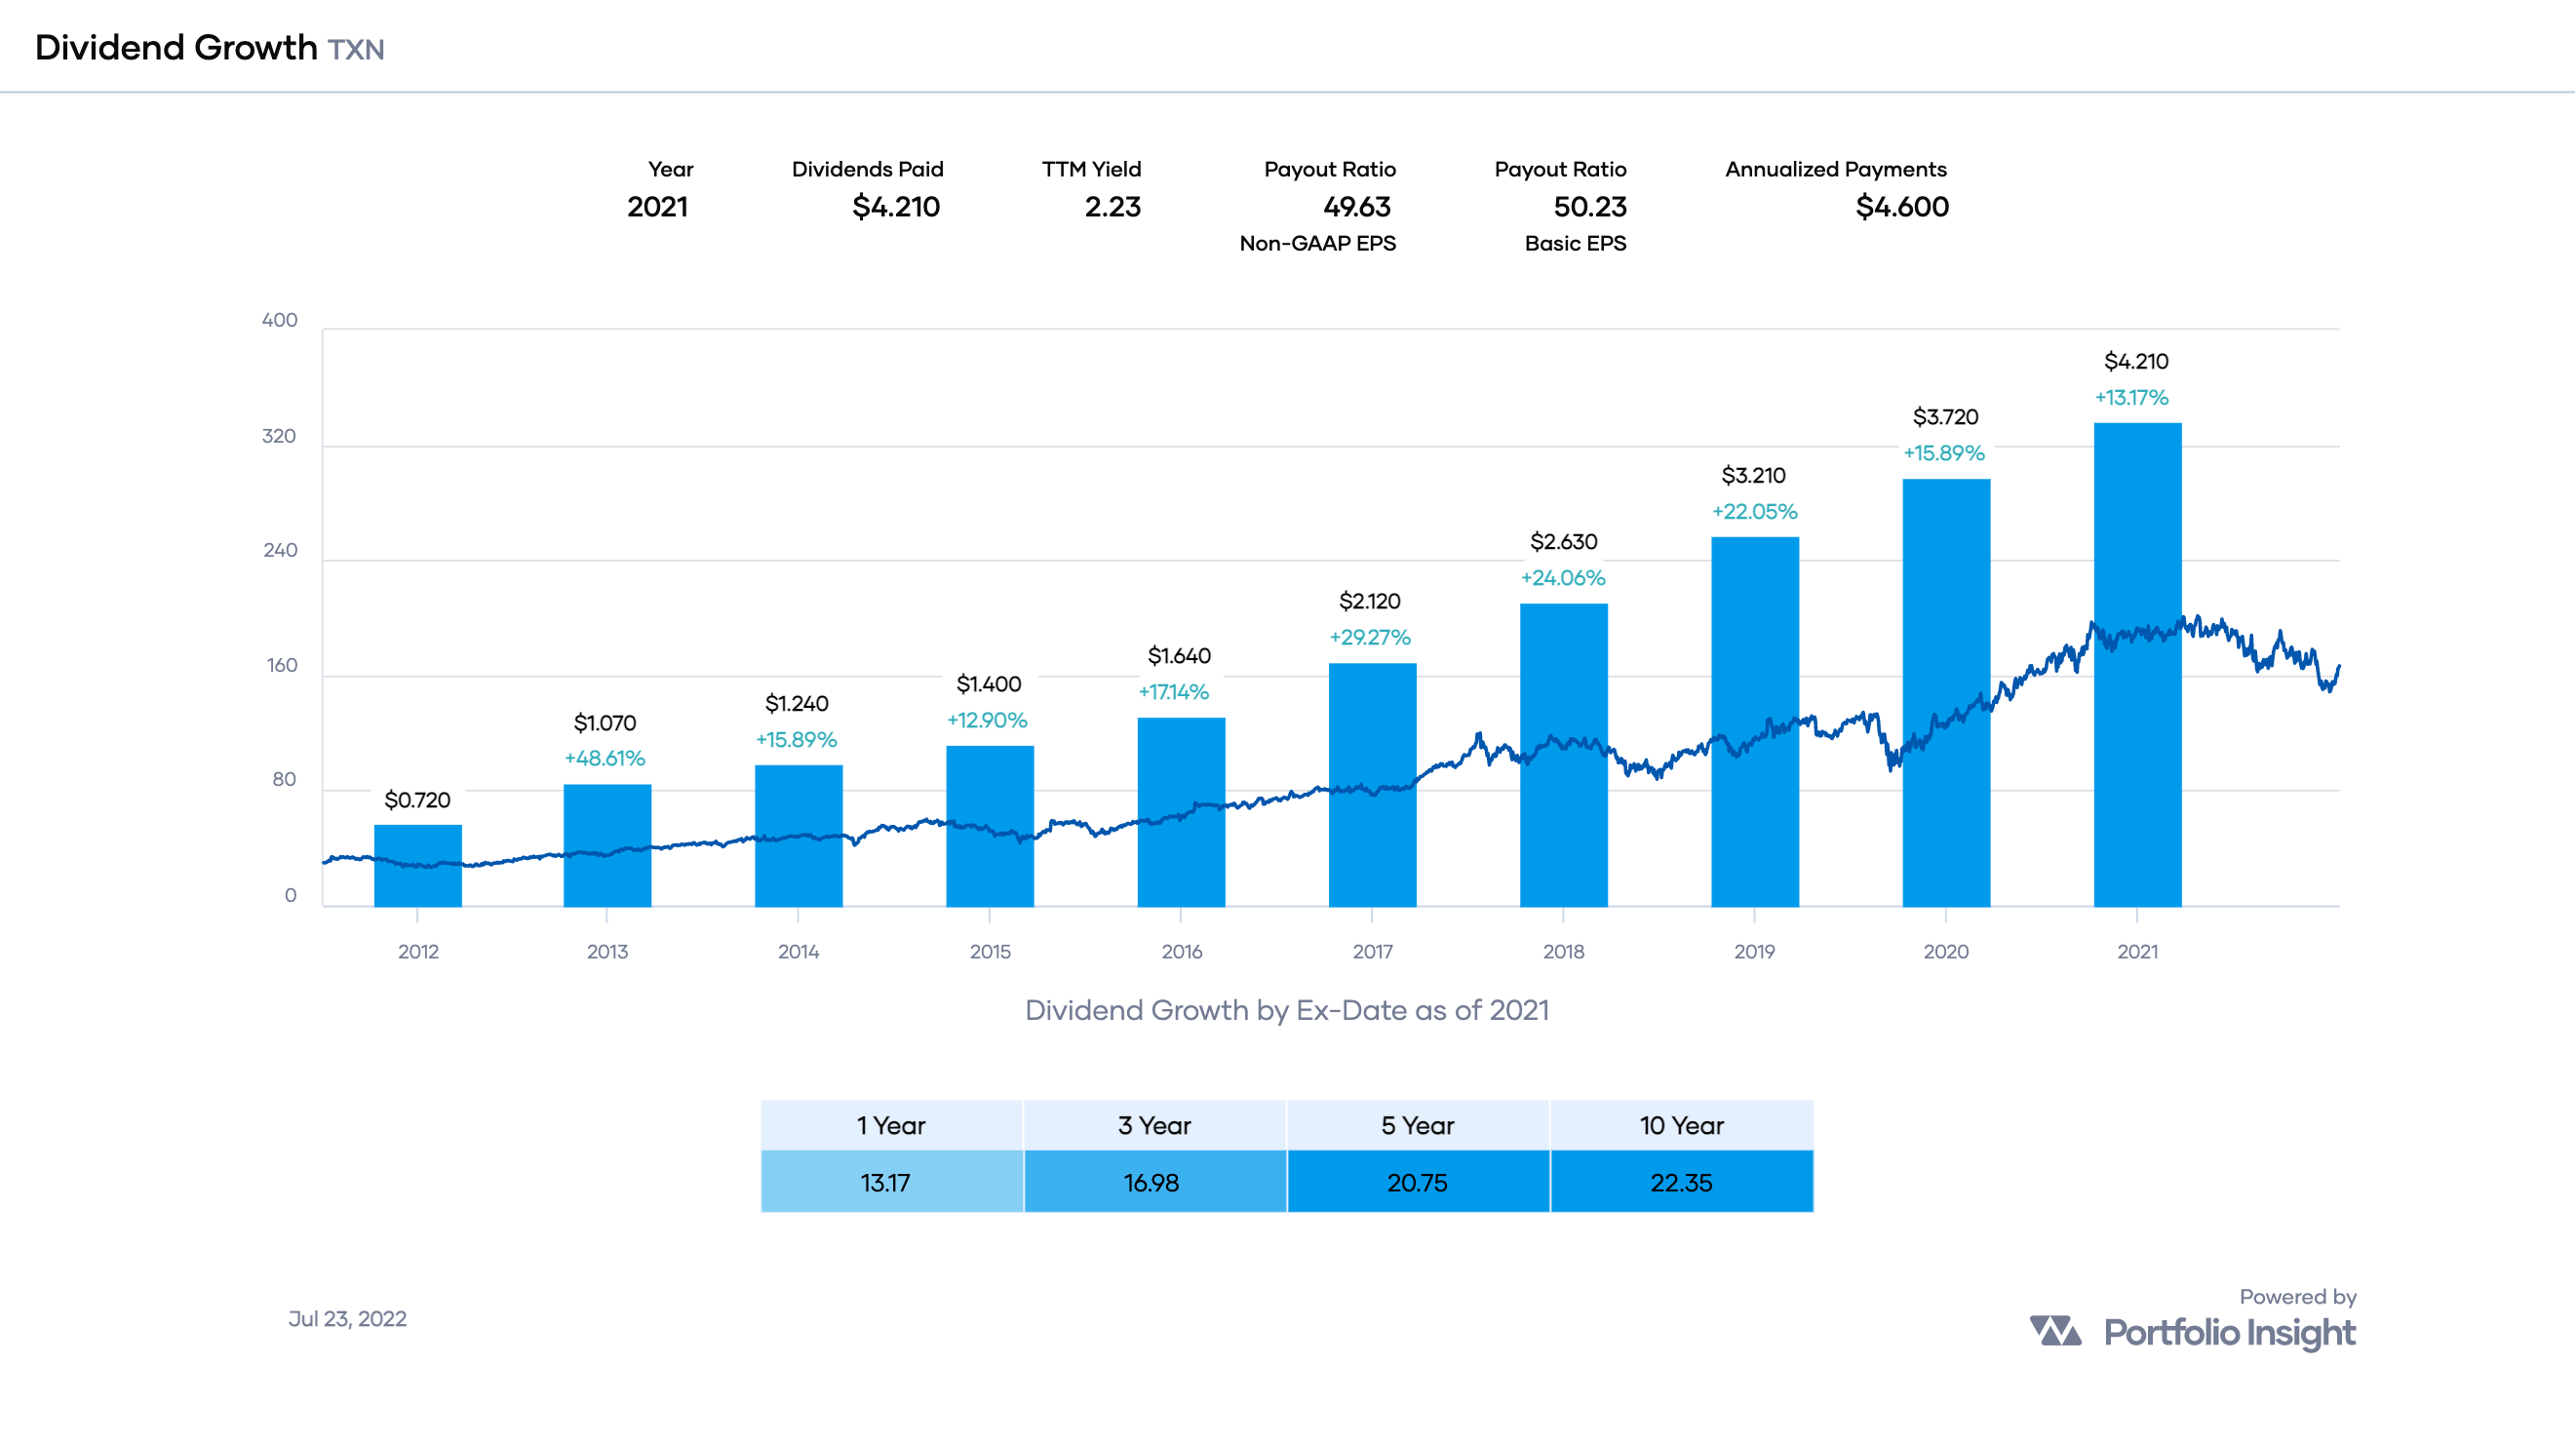
TXN has grown its dividend consistently and at a spectacular rate. However, note that the stock’s dividend growth rate [DGR] is decelerating. We can see this by dividing the 5-year DGR by the 10-year counterpart: 20.75 ÷ 22.35 = 0.93. A ratio below 1.00 indicates a deceleration of the DGR.
Few companies (if any) can maintain such high DGRs, and TXN will likely have more modest increases in the future, probably around 10-12% per year.
A dividend is a share of profits and retained earnings that companies pay shareholders. When a company generates a profit and accumulates retained earnings, the earnings can be either reinvested in the business or paid out to shareholders as a dividend. So, I always look at a company’s earnings growth history to get a sense of dividend sustainability:
Portfolio Insight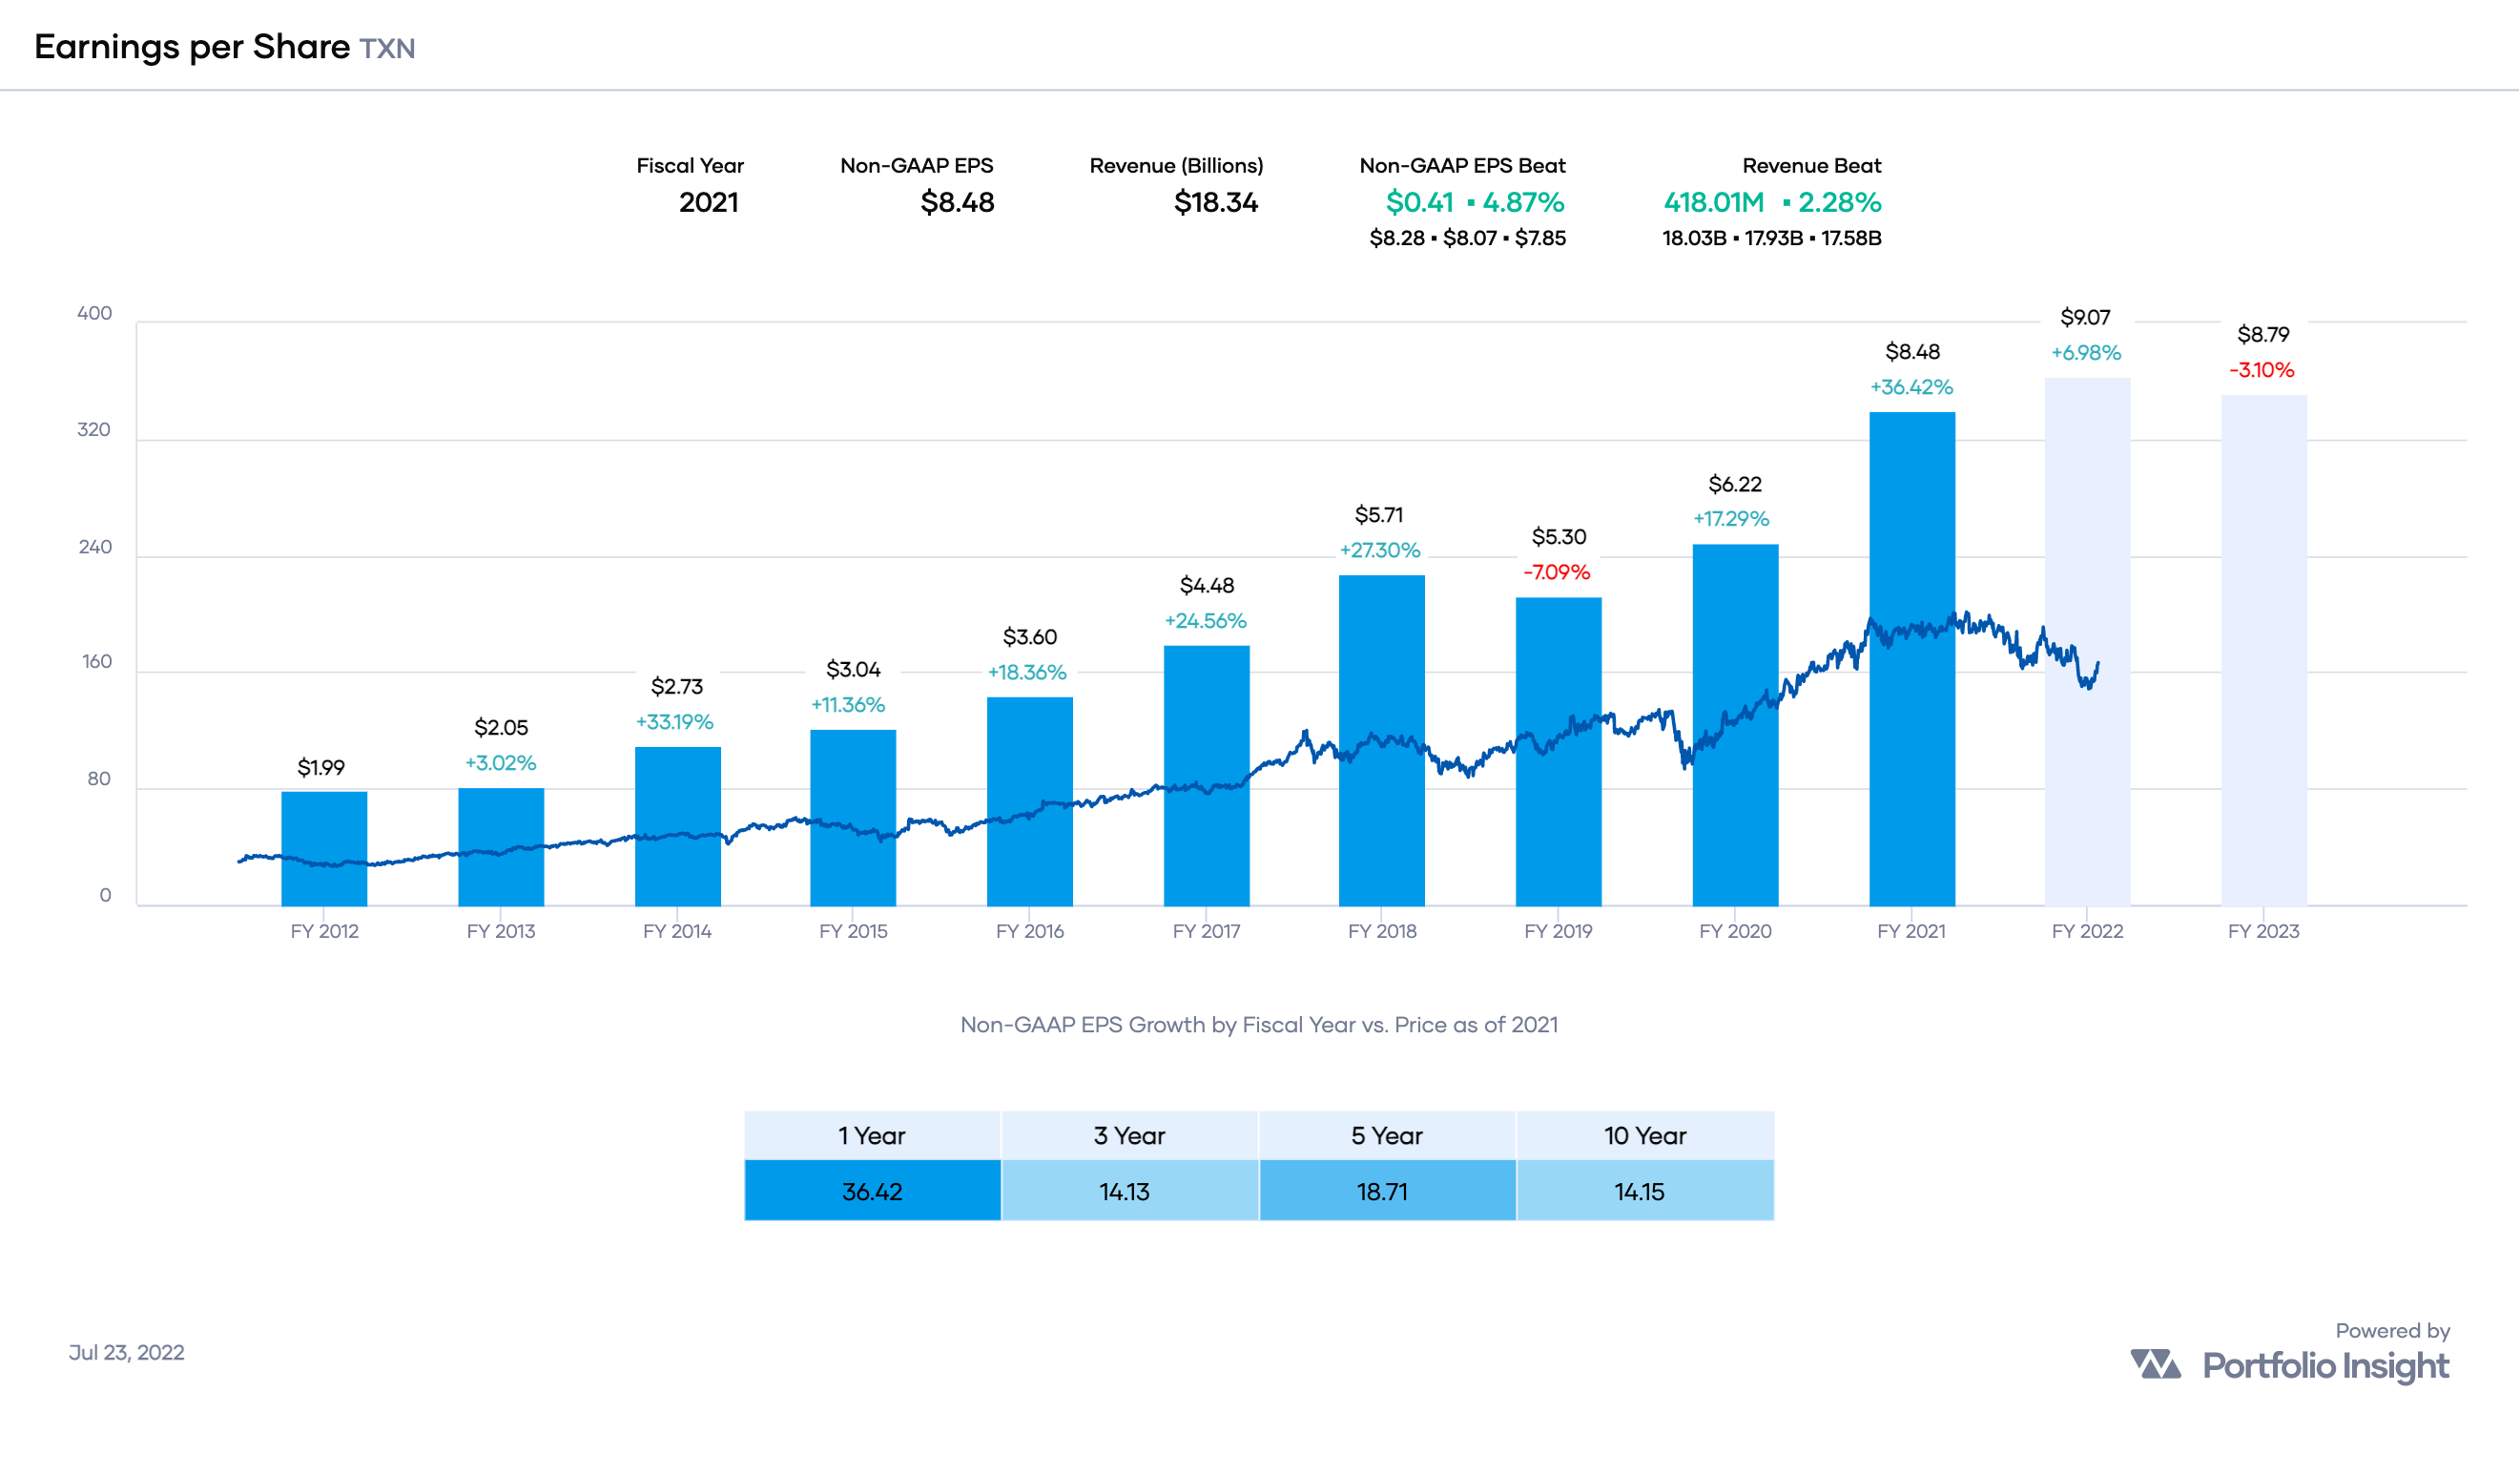
TXN has grown its Non-GAAP earnings impressively, with a 5-year CAGR of 18.7%. If realized, TXN’s EPS estimates for FY 2022 will continue the upward trend, but FY 2023 is projected to be lower than FY 2022.
Likewise, the company’s 10-year history of free cash flow growth is impressive:
Portfolio Insight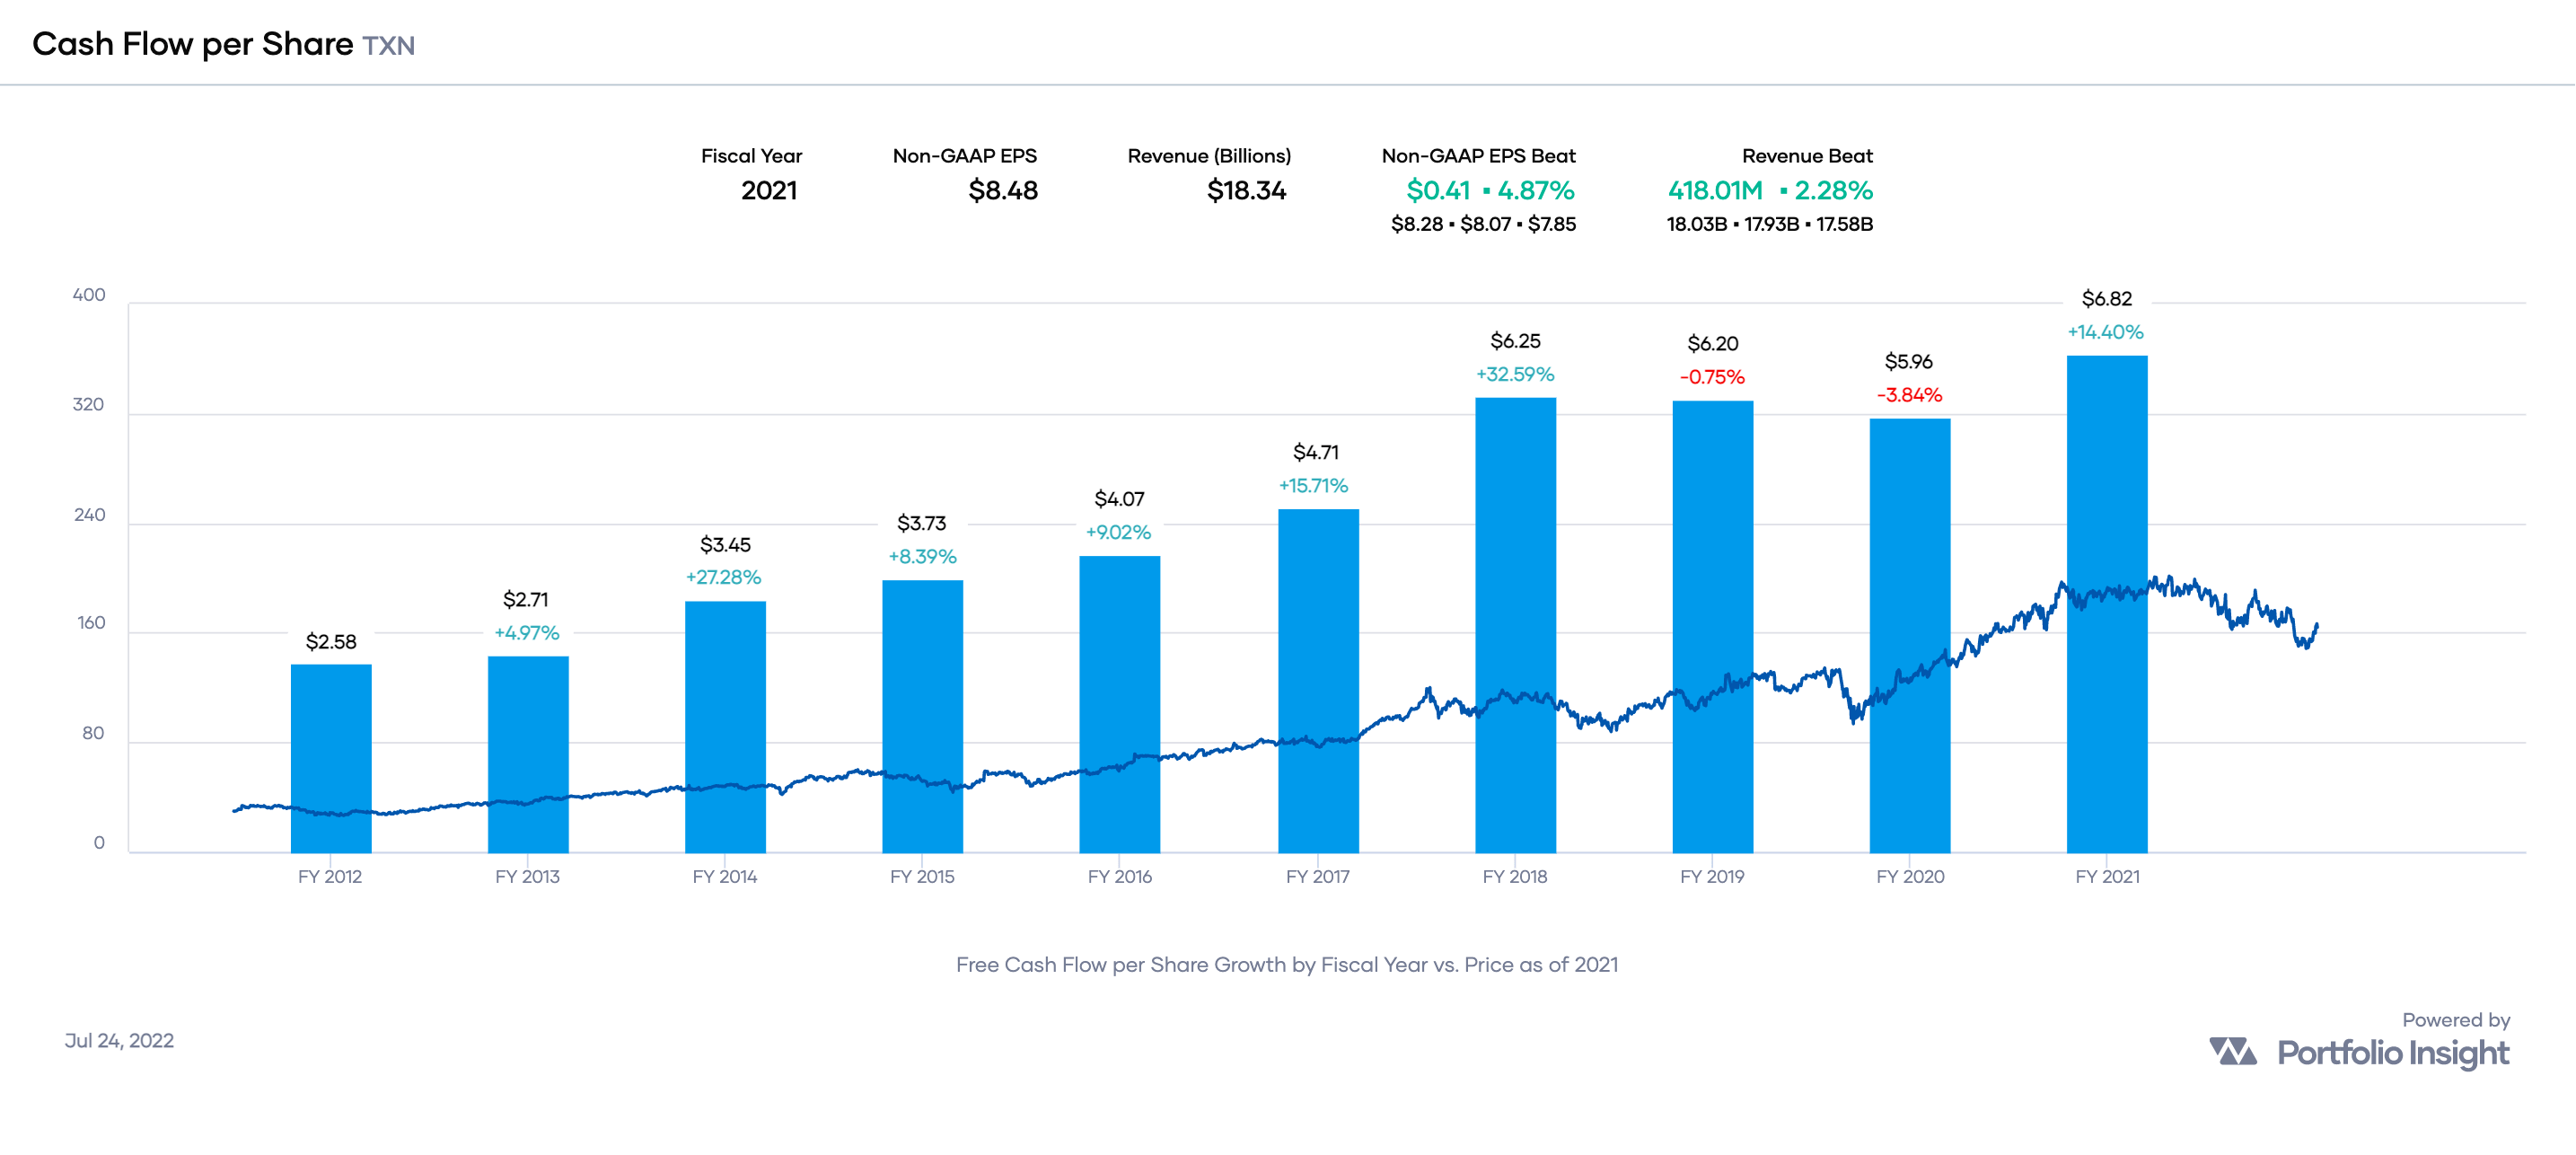
TXN’s payout ratio of 53% is “edging high for semi-conductor firms,” according to Simply Safe Dividends:
Simply Safe Dividends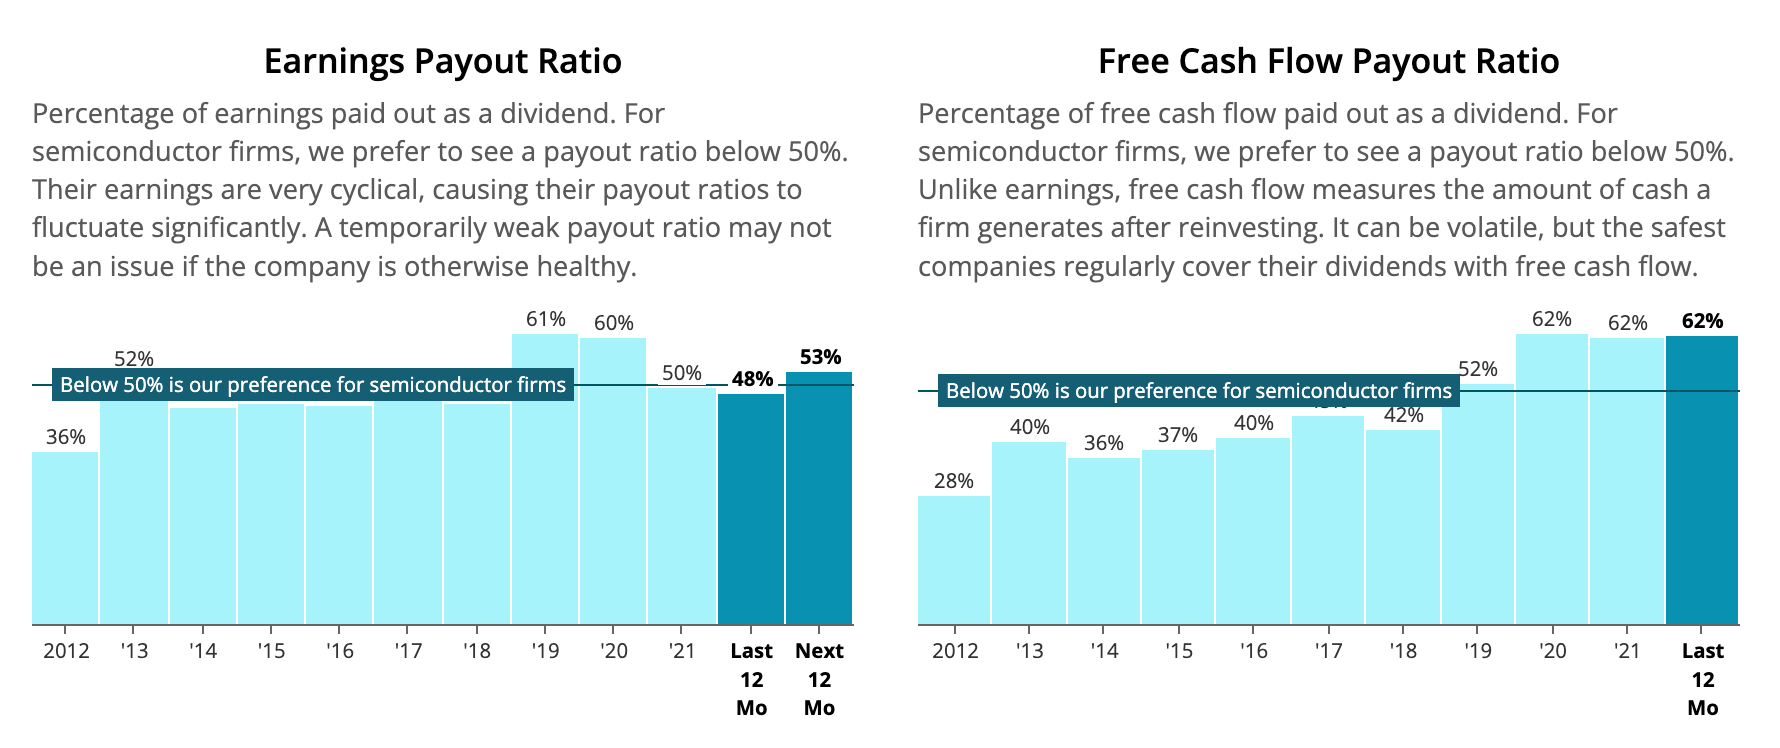
TXN has room to continue paying and increasing its dividend, though future dividend increases likely will be more modest, around 10-12% annually, assuming the same number of shares outstanding.
TXN has about $10 billion in stock repurchase authorizations remaining, with no specified expiration date. The authorizations represent approximately 61.5 million shares at the current share price or about 41% of shares outstanding.
Since 2004, the company has reduced its shares outstanding by 46%:
Texas Instruments Capital Management Scorecard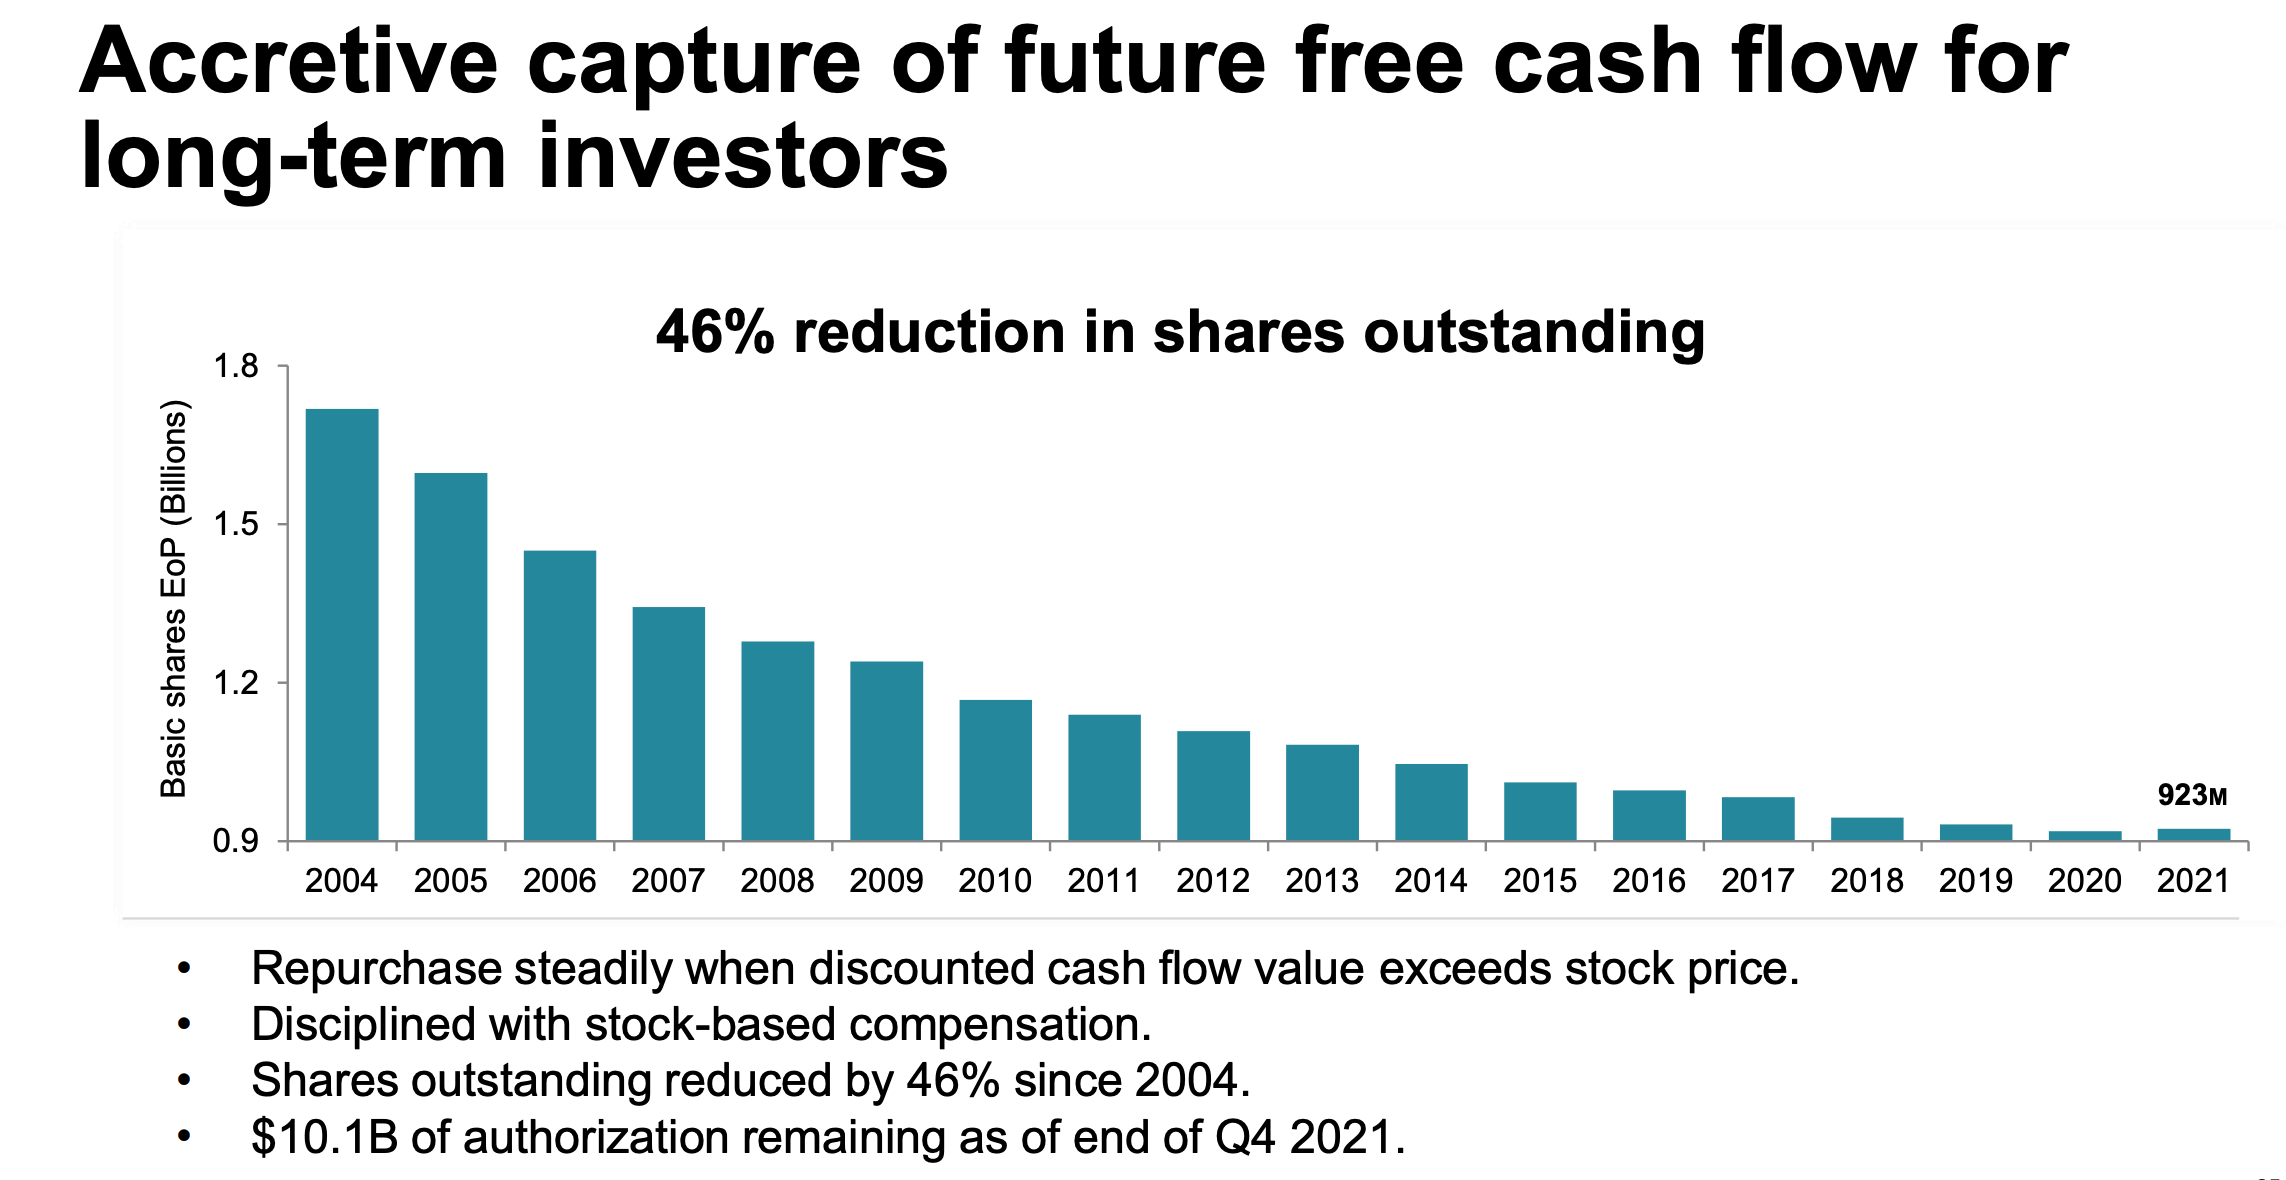
One way to reduce its annual dividend expenditure would be to continue reducing the number of shares outstanding. But it is good that management remains prudent about capital allocation. In 2021, the company used $527 million to repurchase 2.9 million shares compared with $2.55 billion used in 2020 to repurchase 23.4 million shares. Considering TXN’s soaring valuation over the past year, it is reassuring to see a much smaller capital outlay for share repurchases than in prior years.
Intrinsic Valuation
Dividend yield theory offers a quick way to determine the intrinsic value of blue-chip dividend growth stocks. Popularized by Geraldine Weiss in the 1990 book Dividends Don’t Lie: Finding Value in Blue-Chip Stocks, dividend yield theory suggests that a stock’s dividend yield fluctuates around a relatively fixed level for many years, approximating fair value [FV].
If a stock’s current yield is above its historical yield, it is likely undervalued. Conversely, if a stock’s current yield is below its historical yield, it is likely overvalued.
The following chart illustrates that TXN is undervalued relative to historical yields:
Portfolio Insight Dividend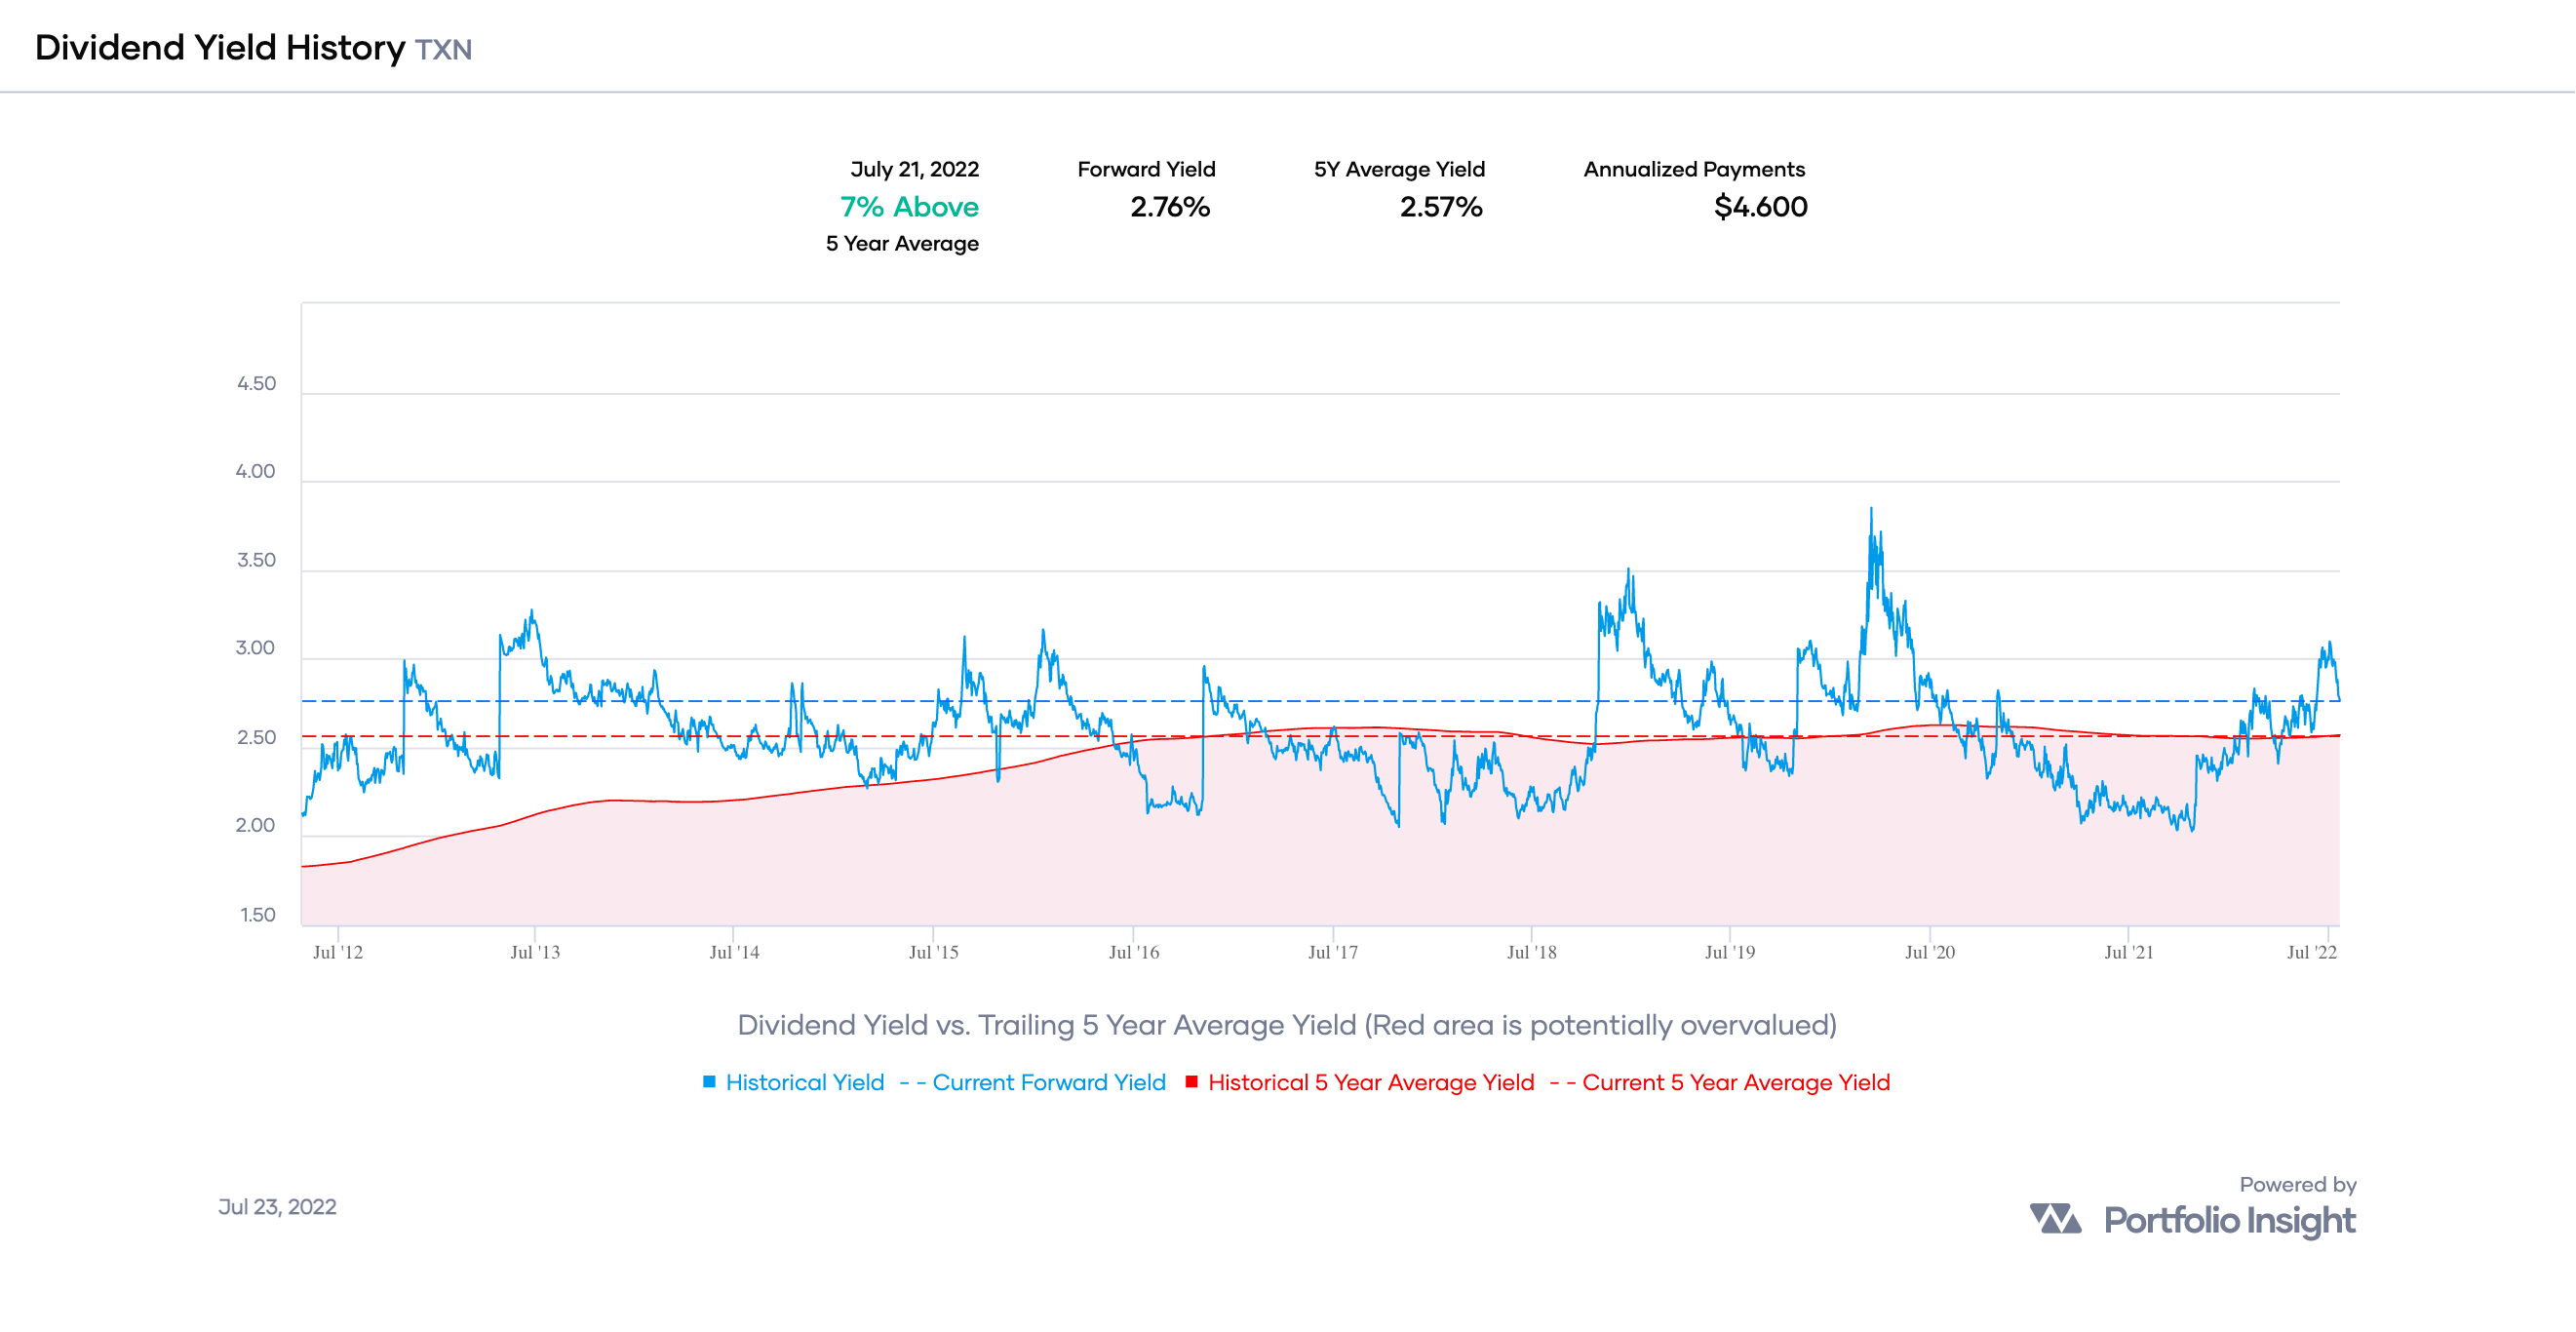
A quick way to estimate fair value is to divide the annualized payment of a dividend growth stock by its 5-year average yield. For TXN, using the numbers in the Dividend Yield History chart, we get $4.60 ÷ 2.57% ≈ $180. TXN closed just below $164 per share on Friday, July 22, so the stock is discounted relative to its past dividend yield history.
Portfolio Insight estimates FV by blending up to five different calculations, depending on a stock’s growth characteristics. For TXN, deemed a slow-growth stock, the blended FV estimate is $191:
Portfolio Insight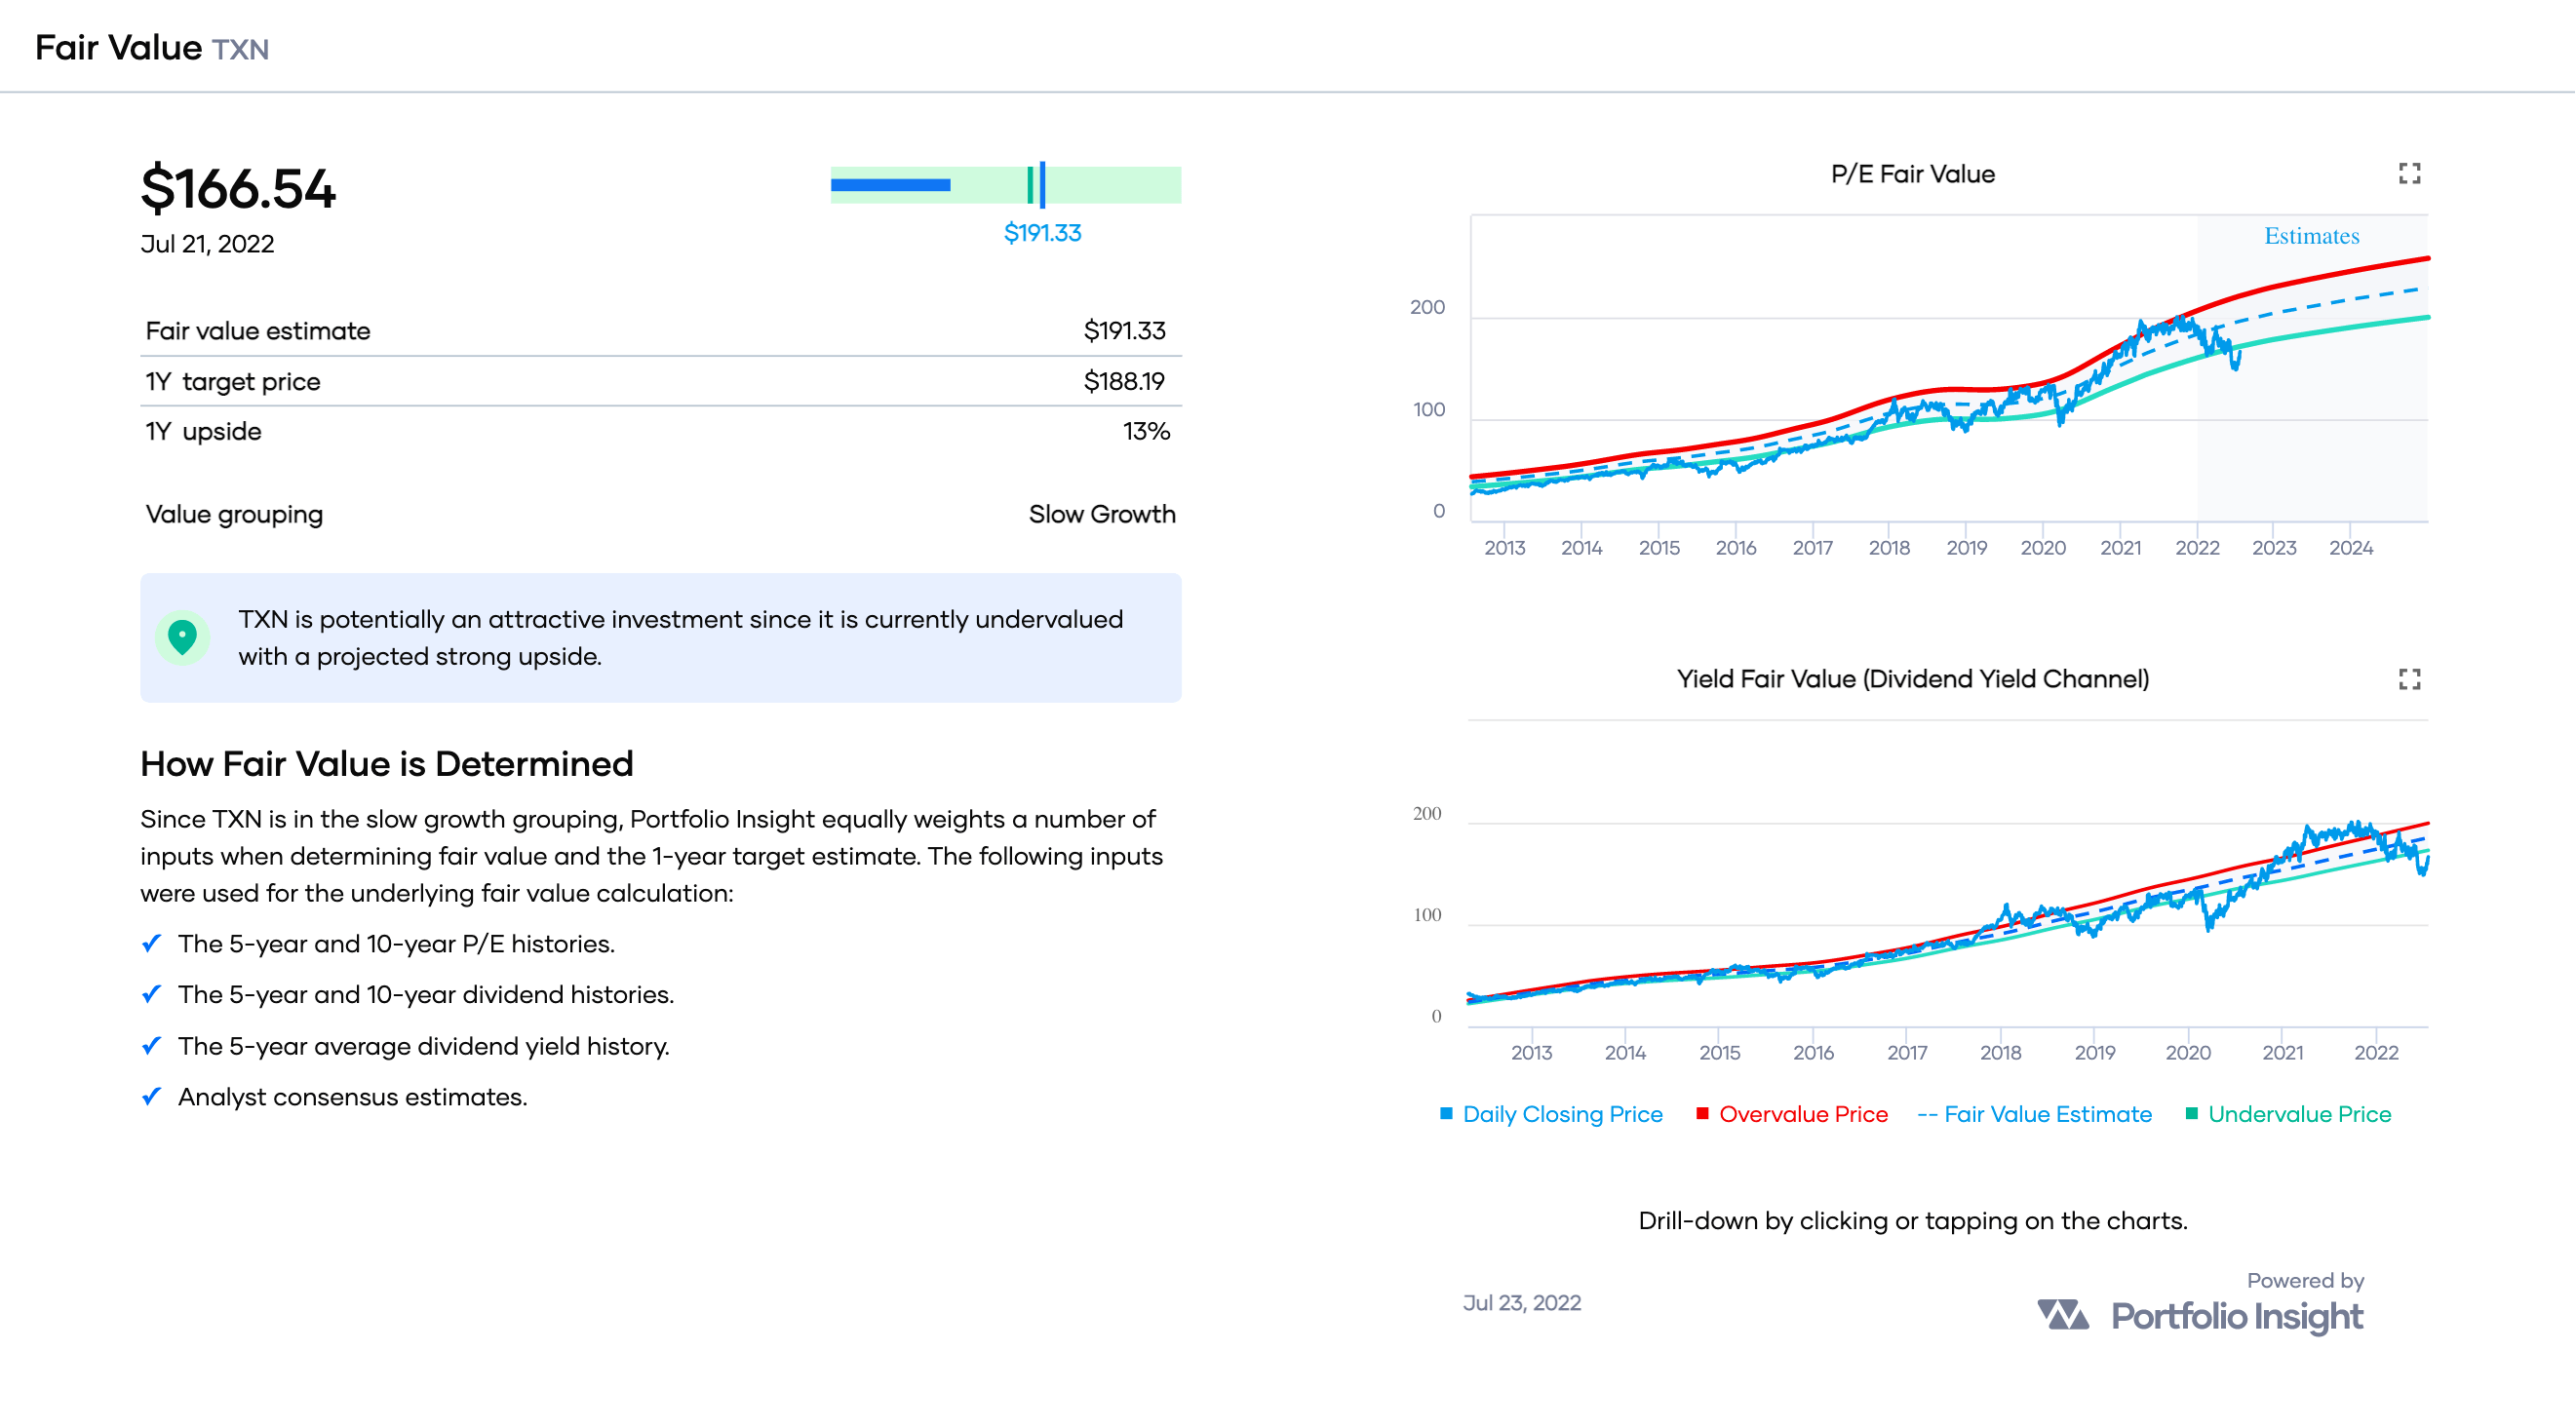
The P/E Fair Value and Dividend Yield Channel charts above indicate that TXN is undervalued, as its current price (blue line) has dropped below its undervalue price (green line).
Portfolio Insight uses these charts, and analyst consensus estimates to project a 1-year target price. For TXN, the 1-year target price is $188 for an upside of 13%.
I use a survey approach to estimate fair value, collecting fair value estimates and price targets from several online sources such as Portfolio Insight, Morningstar, and Finbox. Along with the quick fair value estimate I derive from a stock’s dividend yield history, I collect up to eleven estimates and targets. To determine my FV estimate, I ignore the outliers (the lowest and highest values) and use the average of the median and mean of the remaining values as my FV estimate.
My FV estimate of TXN is $182.
As a dividend growth investor with a long-term investment horizon, I’m more interested in owning quality stocks than getting a bargain on lower-quality stocks.
My risk-adjusted Buy Below prices allow premium valuations for the highest-quality stocks but require discounted valuations for lower-quality stocks:
Created by the author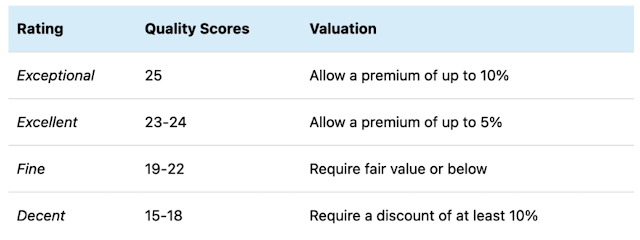
My Buy Below prices recognize that the highest-quality stocks rarely trade at discounted valuations.
Since TXN has a quality score of 24, I allow a premium of up to 5% relative to my FV estimate of $182. Therefore, my risk-adjusted Buy Below price for TXN is $191.
If Texas Instruments increased its dividend by 13% (as it did last September) to $1.30 per share, the quick valuation method would result in an FV estimate of $202 (4 × $1.30 ÷ 2.57% ≈ $202). That would imply an upside of about 23% to TXN’s current share price of $164.
The following table shows alternative scenarios and upsides:
|
FV (upside) with next dividend increase |
5-year average yield | |||
| 2.52% | 2.57% | 2.62% | ||
|
Next dividend increase |
10% (to $1.265) | $201 (22%) | $197 (20%) | $193 (18%) |
| 13% (to $1.300) | $206 (26%) | $202 (23%) | $198 (21%) | |
| 16% (to $1.334) | $212 (29%) | $208 (27%) | $204 (24%) | |
An increase in TXN’s dividend between 10% and 16% likely will result in an updated FV estimate (using the quick valuation method) of between $193 and $212, assuming a 5-year average yield between 2.52% and 2.62%.
I consider TXN a buy up to $191 per share.
Concluding Remarks
I consider TXN one of the best dividend growth stocks to own. The company pays a generous dividend yielding 2.76% at $164 per share and has a stellar track record of dividend growth and share buybacks. While I expect a lower dividend growth rate of 10-12% going forward, that rate still easily outpaces the current inflation rate, especially when reinvesting dividends.
Texas Instruments has a great management team focused on growing free cash flow as the primary driver of long-term value. The team is disciplined in allocating capital and is a top performer when measured by returns on invested capital. The company is well-positioned to benefit from a rapidly growing semiconductor industry, especially in the industrial and automotive markets in which the company leads with market share in analog and embedded systems.
TXN has a DVK quality score of 24, and I rate the stock Excellent. The dividend is deemed Very Safe, and I believe the stock has excellent growth and income prospects. TXN has outperformed the broader market over the past five years. The stock is discounted by about 10% relative to my fair value estimate of $182, though I’m willing to buy shares up to $191 per share given the stock’s Excellent rating.
My current position in TXN of 100 shares has an average cost basis of $108.84 and an average yield on cost of 4.23%. I consider it a full position, essentially matching the target I’ve set using my dynamic and flexible system for determining ideal target weights for stocks in my DivGro portfolio. My most recent buy of 25 shares of TXN at $158.35 per share was on 28 June 2022.
Thanks for reading, and happy investing!
Be the first to comment