

jetcityimage
In this analysis of Wayfair Inc. (NYSE:W), we analyzed the company following the company’s revenue decline in Q3 2022 of 9% and its decline for the full year of 2021 by 3%. Based on the company’s previous earnings briefing, management highlighted the softening macro-outlook and impact on the company. We analyzed the real PCE growth for home furnishing and compared it with services growth to verify the company’s statement. Furthermore, we analyzed the company’s breakdown by customer growth, order per customer and spending per customer to determine the factors behind its declining growth.
Home Furnishing Sales Slow as Services Spending Picks Up
In the company’s Q2 2022 earnings briefing, management previously highlighted that the macro-outlook was softening and there had “been a shift from goods to services”. As explained in the quote below, the company stated that consumer spending had shifted towards services such as travel.
For the past few months, we have also seen many of those discretionary dollars flow away from goods to services, especially travel as they slow to start spring turned quickly into summer. – Niraj Shah, Co-Founder, Chief Executive Officer & Co-Chairman
In its latest earnings briefing, management reiterated the shift from goods to services had impacted the retail sector and the company.
For much of the summer months, that discretionary spend shifted from goods to services, with pressure felt across a wide array of retail sectors, including ours. – Niraj Shah, Co-Founder, Chief Executive Officer & Co-Chairman
To verify the company’s statement, we analyzed the real PCE for services and furnishings and durable household equipment and compared the growth rates in the past quarters up to Q3 2022.
U.S. Bureau of Economic Analysis, Khaveen Investments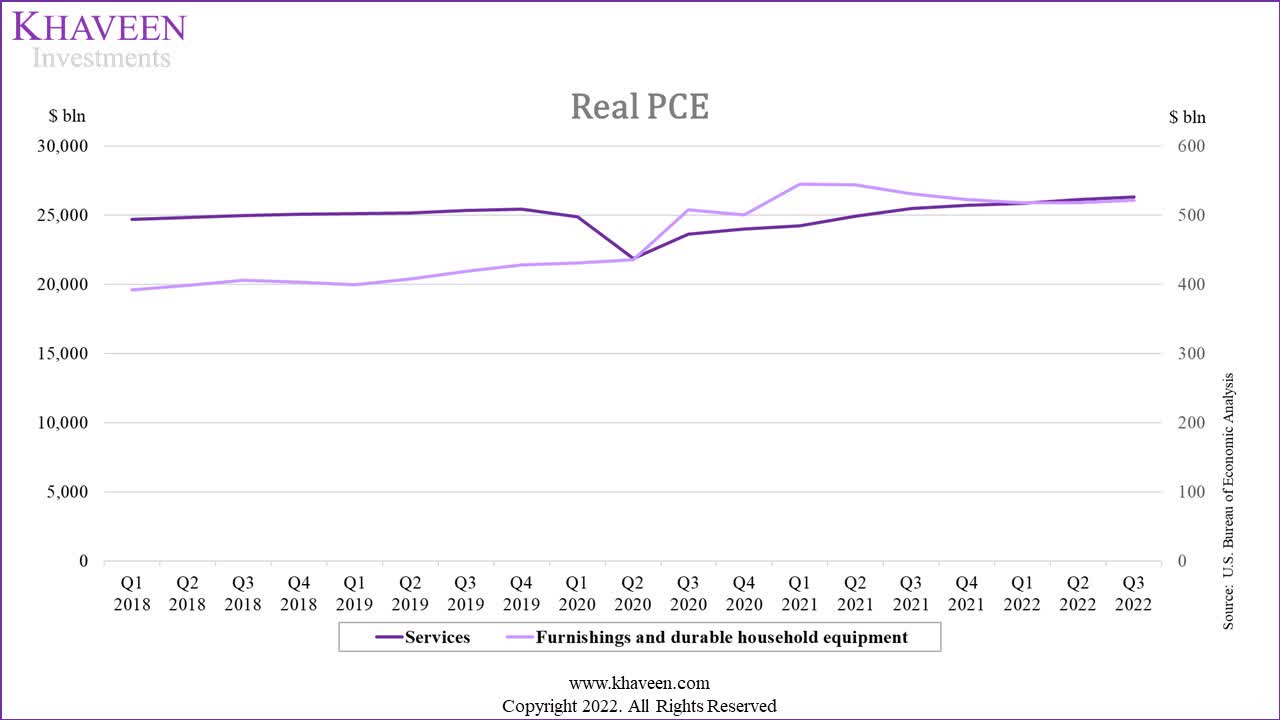
|
PCE ($ bln) |
Q1 2020 |
Q2 2020 |
Q3 2020 |
Q4 2020 |
Q1 2021 |
Q2 2021 |
Q3 2021 |
Q4 2021 |
Q1 2022 |
Q2 2022 |
Q3 2022 |
Average |
|
Furnishings and durable household equipment |
431.18 |
435.91 |
508.23 |
500.57 |
544.84 |
543.73 |
530.67 |
522.53 |
518.37 |
517.61 |
521.68 |
|
|
YoY Growth % |
7.9% |
6.9% |
21.4% |
16.9% |
26.4% |
24.7% |
4.4% |
4.4% |
-4.9% |
-4.8% |
-1.7% |
9.4% |
|
Services |
24,872 |
21,853 |
23,649 |
23,982 |
24,217 |
24,929 |
25,483 |
25,705 |
25,839 |
26,129 |
26,309 |
|
|
YoY Growth % |
-0.9% |
-13.2% |
-6.6% |
-5.8% |
-2.6% |
14.1% |
7.8% |
7.2% |
6.7% |
4.8% |
3.2% |
1.6% |
Source: U.S. Bureau of Economic Analysis, Khaveen Investments
As seen in the table above, the real PCE growth for Furnishings and durable household equipment had slowed down since Q3 2021. The PCE growth for Furnishings and durable household equipment had declined in Q1 and Q2 2022 at -4.9% and -4.8% YoY but had improved slightly in Q3 2022 at -1.7%. We believe this could be due to the end of the COVID-19 stimulus checks which had 3 rounds between 2020 and 2021.
In comparison, the real PCE for services had declined in 2020 and Q1 2021 but recovered to positive growth in Q2 2021 onwards. However, the growth rate had slowed down since Q2 2022 at 4.8% and further declined to 3.2% in Q3 2022 but still higher growth compared to Furnishings and durable household equipment.
Therefore, we believe management’s statement of the shift of consumer spending from goods to services could be accurate based on the declining growth in Furnishings and durable household equipment but the positive growth in services and could be a factor for the slowdown in the company’s growth.
Declining Customer Growth
|
Wayfair |
2Q FY20 |
3Q FY20 |
4Q FY20 |
1Q FY21 |
2Q FY21 |
3Q FY21 |
4Q FY21 |
1Q FY22 |
2Q FY22 |
3Q FY22 |
Average |
|
Active Customers (‘mln’) |
26 |
28.8 |
31 |
33 |
31 |
29.2 |
27 |
25 |
24 |
23 |
|
|
Growth % |
46.1% |
50.8% |
55.0% |
56.4% |
19.2% |
1.4% |
-12.9% |
-24.2% |
-22.6% |
-21.2% |
19.8% |
Source: Wayfair, Khaveen Investments
Based on the company’s quarterly reports, Wayfair’s customer base had shrunk since Q1 FY2022 and had negative growth since Q4 2021. In its latest quarter, its customer base continued to decline with a growth rate of -21.2% YoY at 23 mln in Q3 2022.
According to management, it highlighted in its previous earnings briefing that its NPS scores increased over the past year.
Customer feedback also speak to the increased satisfaction with NPS scores up meaningfully year-over-year and brand surveys highlighting our seamless experience and unparalleled selection. – Niraj Shah, Co-Founder, Chief Executive Officer & Co-Chairman
We compiled the company’s NPS score against its competitors to analyze its competitive positioning which is in contrast to its declining customer base.
|
Company |
NPS Score (November 2022) |
|
Wayfair |
-45 |
|
Overstock (OSTK) |
-4 |
|
Home Depot (HD) |
24 |
|
Lowe’s (LOW) |
10 |
|
Bed Bath & Beyond (BBBY) |
-58 |
|
Average |
-14.6 |
Source: Comparably, Khaveen Investments
Based on the NPS scores by Comparably, Wayfair had an NPS score of -45 in November 2022 which is the second lowest among the pure-play home furnishing competitors with Bed Bath & Beyond has a lower NPS score of -58. Additionally, Wayfair’s NPS had declined from -37 in December 2021 which is in contrast to management’s claim. Only Home Depot & Lowe’s have positive NPS scores of 24 and 10 respectively. Thus, we believe that Wayfair’s declining NPS score which is the second lowest among competitors highlights its poor customer satisfaction and could be one factor to explain its declining customer base.
|
Wayfair Projections |
2019 |
2020 |
2021 |
2022F |
2023F |
2024F |
2025F |
2026F |
|
Active customers (‘000s) |
20,290 |
31,194 |
27,300 |
21,107 |
23,088 |
25,068 |
27,049 |
29,030 |
|
Growth % |
33.9% |
53.7% |
-12.5% |
-22.7% |
9.4% |
8.6% |
7.9% |
7.3% |
|
Active customers Increase |
5,135 |
10,904 |
(3,894) |
(6,193) |
1,981 |
1,981 |
1,981 |
1,981 |
Source: Wayfair, Khaveen Investments
Overall, we expect Wayfair to continue losing customers with its poor customer satisfaction as indicated by its declining and negative NPS score. We forecasted its customer base growth in 2022 based on the company’s average Q1 to Q3 customer decline YoY at -22.7%. Furthermore, we conservatively forecasted its customer growth in 2023 and beyond based on its 10-year average customer increase of 1,981 customers per year for a 5-year forward growth rate of 2.1%.
Customers Buying Less but Spending More
|
Wayfair |
3Q FY20 |
4Q FY20 |
1Q FY21 |
2Q FY21 |
3Q FY21 |
4Q FY21 |
1Q FY22 |
2Q FY22 |
3Q FY22 |
Average |
|
Active Customers (‘mln’) |
28.8 |
31 |
33 |
31 |
29.2 |
27 |
25 |
24 |
23 |
|
|
Growth % |
50.8% |
55.0% |
56.4% |
19.2% |
1.4% |
-12.9% |
-24.2% |
-22.6% |
-21.2% |
14.8% |
|
Orders delivered (‘mln’) |
15.8 |
16.4 |
15 |
14 |
11 |
12 |
10 |
10 |
9 |
|
|
Growth % |
73.6% |
42.6% |
51.5% |
-25.9% |
-30.4% |
-26.8% |
-33.3% |
-28.6% |
-18.2% |
11.0% |
|
Orders Per Customer |
0.5 |
0.5 |
0.5 |
0.5 |
0.4 |
0.4 |
0.4 |
0.4 |
0.4 |
|
|
Growth % |
15.1% |
-8.0% |
-3.1% |
-37.9% |
-31.3% |
-16.0% |
-12.0% |
-7.7% |
3.9% |
-5.6% |
|
Revenue Per Order ($) |
243.01 |
223.82 |
231.87 |
275.50 |
283.74 |
270.98 |
299.30 |
328.40 |
315.56 |
|
|
Growth % |
-4.1% |
1.6% |
-1.5% |
21.0% |
16.8% |
21.1% |
29.1% |
19.2% |
11.2% |
10.4% |
|
Revenue ($ mln) |
3,840 |
3,671 |
3,478 |
3,857 |
3,121 |
3,252 |
2,993 |
3,284 |
2840 |
|
|
Growth % |
66.6% |
44.9% |
49.3% |
-10.4% |
-18.7% |
-11.4% |
-13.9% |
-14.9% |
-9.0% |
16.6% |
Source: Wayfair, Khaveen Investments
Based on the table above, Wayfair’s orders delivered had an average growth of 11% in the past 10 quarters. We divided this by its customer base for each quarter to calculate its orders per customer which is an average decline of 5.6%. Since Q4 2020, its orders per customer had declined YoY. Based on the company’s statement, management highlighted that the industry was previously faced with supply constraints but had changed to being over-inventoried.
The industry suppliers have experienced a dramatic shift in their positioning over the course of the last few quarters. From not having enough product to satisfy all of their customers, to facing canceled orders from brick-and-mortar retailers and being over-inventoried – Niraj Shah, Co-Founder, Chief Executive Officer & Co-Chairman
Despite the decline in orders per customer, its revenue per order had increased by an average of 10.4% which supports its total revenue growth despite the decline in orders per customer. We believe this could be due to inflation in the US as the home furnishings and operations index increased by 8.4% over the past year in October 2022 according to the Bureau of Labor Statistics.
|
Wayfair Projections |
2020 |
2021 |
2022F |
2023F |
2024F |
2025F |
2026F |
|
Active customers (‘000s) |
31,194 |
27,300 |
21,107 |
23,088 |
25,068 |
27,049 |
29,030 |
|
Growth % |
53.7% |
-12.5% |
-22.7% |
9.4% |
8.6% |
7.9% |
7.3% |
|
Orders Per Customer |
1.96 |
1.90 |
1.61 |
1.63 |
1.64 |
1.65 |
1.67 |
|
Growth % |
4.4% |
-2.6% |
-15.4% |
0.9% |
0.9% |
0.9% |
0.9% |
|
Revenue Per Order ($) |
231.89 |
263.62 |
315.9 |
332.05 |
349.04 |
366.89 |
385.65 |
|
Growth % |
-3.5% |
13.7% |
19.8% |
5.1% |
5.1% |
5.1% |
5.1% |
|
Revenue ($ mln) |
14,145 |
13,708 |
10,739 |
12,460 |
14,350 |
16,424 |
18,697 |
|
Growth % |
55.0% |
-3.1% |
-21.7% |
16.0% |
15.2% |
14.5% |
13.8% |
Source: Wayfair, Khaveen Investments
All in all, we believe that the company is facing a temporary headwind with high inflation in the home furnishing category boosting its revenue per order at a prorated growth of 22.7% in 2022 but impacted by a slowdown in orders per customer at -15.4% in 2022. We projected the company’s orders per customer and revenue per order on a 3-year average of 0.9% and 5.1% respectively beyond 2022 and forecasted its total revenue to decline by 21.7% in 2022 before recovering for a 5-year forward average growth of 7.6%.
Risk: High Debt
|
Credit Analysis |
2014 |
2015 |
2016 |
2017 |
2018 |
2019 |
2020 |
2021 |
TTM |
Average |
|
EBIT interest coverage |
369.5x |
62.6x |
280.3x |
-24.0x |
-16.6x |
-16.9x |
2.5x |
-2.5x |
-29.3x |
84.2x |
|
EBITDA interest coverage |
339.3x |
49.5x |
231.7x |
-18.5x |
-14.1x |
-14.9x |
3.5x |
2.1x |
-25.8x |
71.3x |
|
CFO interest coverage |
-10.3x |
-103.9x |
-89.7x |
3.6x |
3.0x |
-3.6x |
9.7x |
12.4x |
-12.4x |
-37.0x |
|
FCF interest coverage |
128.0x |
1.8x |
47.1x |
-10.5x |
-6.3x |
-19.3x |
7.9x |
-3.4x |
-29.0x |
30.4x |
|
EBITDA/Total Debt |
-0.5x |
-0.1x |
-0.2x |
-0.1x |
-0.2x |
-0.2x |
0.1x |
0.0x |
-0.1x |
-0.2x |
|
EBITDA/Net Debt |
0.4x |
0.3x |
3.5x |
-0.9x |
-0.7x |
-0.4x |
0.3x |
0.0x |
-0.2x |
0.3x |
Source: Wayfair, Khaveen Investments
Wayfair’s net debt had increased to $3.2 bln in the TTM and $2.6 bln in 2021 from $2 bln in 2020. Its net debt as a % of market cap was 95.9%. Moreover, its interest coverage ratios had declined over the past 10 years and were negative in TTM as the company was unprofitable. We believe this could highlight a risk for the company to repay its financial obligations.
Wayfair, Khaveen Investments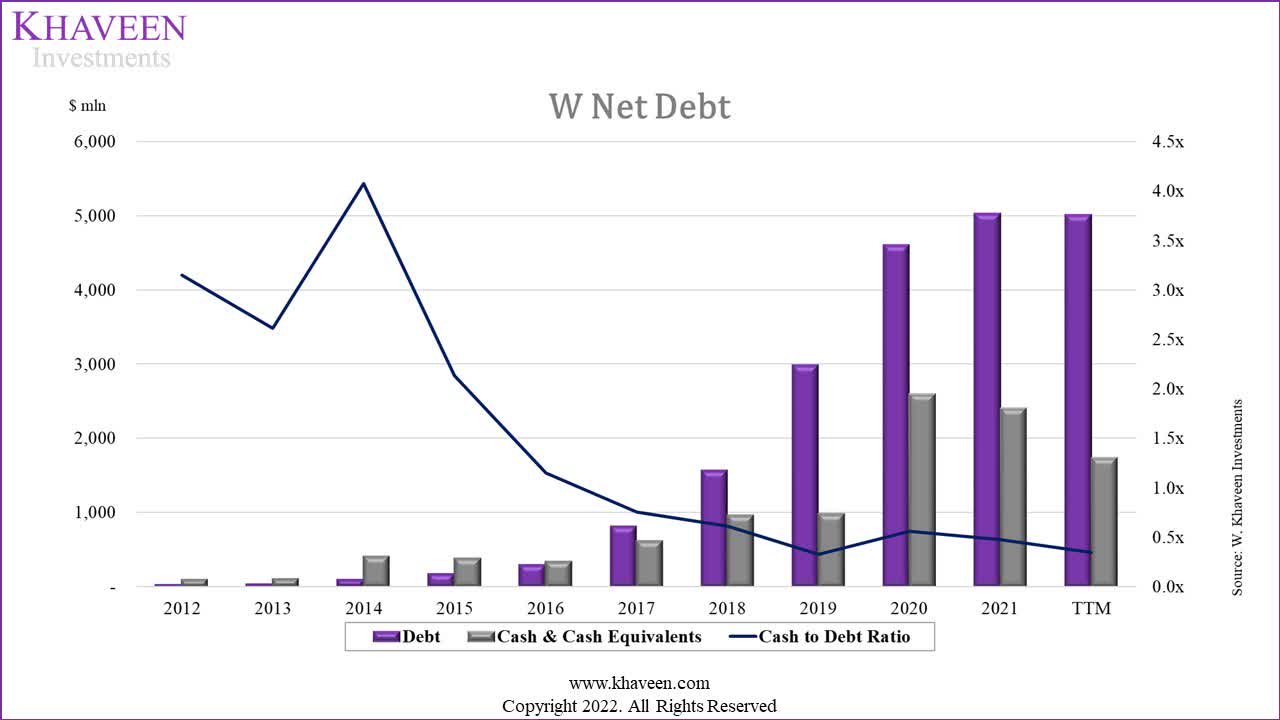
Verdict
To sum it up, we believe the company was impacted by the shift of consumer spending from goods such as home furnishing to services as seen by the contrasting growth between real services PCE and the decline of the PCE for home furnishings. Moreover, we expect the company’s customer base to decline by 22.7% for the full year in 2022 with its low and declining NPS scores compared to competitors but forecasted a 5-year forward growth rate of 2.1%. Moreover, while its revenue per order had increased which we believe could be due to the inflationary impact, its orders per customer had declined and we forecasted its total revenue growth to decline by 21.7% in 2023 before recovering at a 5-year forward average of only 7.6%, lower than its past 5-year growth rate of 34%. Additionally, with the high debt risk of the company, we rate the company based on the low end of analyst consensus price target of $30 by Tip Ranks which is an upside of -9.7% and rated it as a Hold.
Be the first to comment